


 |
市場調查報告書
商品編碼
2099503
人工智慧搜尋最佳化軟體:市場佔有率分析、產業趨勢與統計、成長預測(2026-2031)AI Search Optimization Software - Market Share Analysis, Industry Trends & Statistics, Growth Forecasts (2026 - 2031) |
||||||

※ 本網頁內容可能與最新版本有所差異。詳細情況請與我們聯繫。
根據 Mordor Intelligence 預測,人工智慧搜尋最佳化軟體市場規模將從 2025 年的 10.3 億美元成長到 2026 年的 12.3 億美元,然後在 2031 年達到 33.2 億美元,2026 年至 2031 年的複合年成長率為 21.97%。
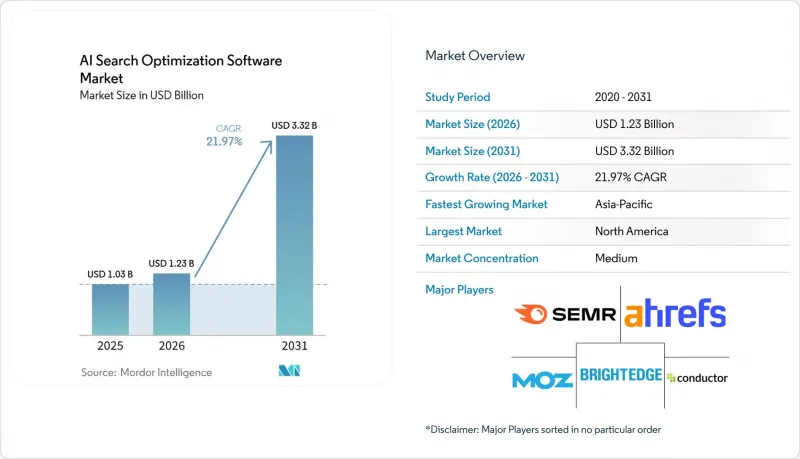
本報告按元件(軟體和服務)、部署類型(雲端、本地部署、混合部署)、最佳化類型(例如,AI搜尋可見性最佳化)、企業規模(大型企業和中小企業)、最終用戶產業(例如,零售/電子商務、銀行、金融服務和保險)以及地區進行細分。市場預測以價值(美元)表示。
全球人工智慧搜尋最佳化軟體市場趨勢與洞察
企業對人工智慧搜尋可見性的需求日益成長
由於人工智慧驅動的搜尋可見度差距比傳統排名差距更難檢測,因此對專用監控的需求日益迫切,促使企業迅速採用相關技術。隨著大規模行銷團隊開始將人工智慧搜尋可見性不足視為營運風險而非成長挑戰,人工智慧搜尋最佳化軟體市場正受益於此轉變。 2026年6月,Semrush宣布,其基於對美國1.26億條人工智慧搜尋提示的分析而擴展的「人工智慧可見性指數」顯示,同一類別中競爭品牌的品牌提及率存在顯著差異。在這種不均衡的提及格局下,人工審核已不再是有效的管理流程,尤其對於擁有眾多品牌、產品和內容團隊的大型企業而言更是如此。因此,傳統的分析工具無法清楚地指出這些差距,這使得能夠提供可重現的可見性基準的供應商在客戶維繫擁有競爭優勢。隨著企業從試點專案轉向系統化的平台部署,這一趨勢將持續推動人工智慧搜尋最佳化軟體市場的需求成長。
從關鍵字排名到答案引擎最佳化的轉變
從關鍵字排名到答案引擎最佳化的轉變正在改變買家對搜尋軟體的期望。人工智慧搜尋最佳化軟體市場正受益於這一轉變,因為在答案環境中,提及次數本身比單一藍色連結的排名更為重要。企業合約也不斷擴展,因為買家不再只是為簡單的關鍵字儀錶板付費,而是開始為監控、競爭對手基準測試和響應面智慧等功能付費。 Conductor 於 2026 年 4 月發布了其下一代人工智慧搜尋效能解決方案,作為答案引擎最佳化的整合記錄系統,進一步強化了這一趨勢。此舉表明,現有平台正在重新定義其核心產品的價值,專注於答案可見度、工作流程執行和效能管理。隨著這一轉變的推進,人工智慧搜尋最佳化軟體市場預計將青睞那些能夠將搜尋、內容、技術訊號和引用管理整合到單一操作層的供應商。
人工智慧生成的視覺化效果與收入之間的因果關係尚不清楚。
人工智慧搜尋技術普及的最大障礙仍然是歸因問題。許多財務部門都希望找到人工智慧產生的引用事件與後續收入事件之間的直接關聯,但這種關聯在實際應用層面往往難以驗證。 BrightEdge 預測,到 2025 年,人工智慧搜尋將作為一個研究管道發揮作用,在目前的應用階段,幾乎無法追蹤到任何直接轉換。因此,即使行銷團隊意識到人工智慧搜尋最佳化軟體的策略價值,供應商也很難透過「最終點擊」邏輯來證明其預算的合理性。對於採購流程嚴格、對經審計的績效證據要求更高的企業而言,這個問題尤其突出。在供應商建構出更完善的輔助轉換模型和銷售通路影響模型之前,歸因的不確定性仍將是該領域快速轉型的一大限制因素。
細分市場分析
到2025年,軟體將佔市場佔有率的71.24%,這表明平台訂閱是該類別發展初期的主要收入來源。人工智慧搜尋最佳化軟體市場「軟體優先」的概念源於這樣一個事實:在擴展大規模服務項目之前,買家需要儀表板、引用監控、技術診斷和報告系統等功能。這一趨勢也反映了該類別的SaaS結構,平台可以隨著答案引擎的演進,在多個帳戶中部署更新。由於可見性監控需要持續使用而非一次性專案工作,企業團隊比服務主導模式更快採用了這些工具。因此,到2025年,軟體板塊將成為人工智慧搜尋最佳化軟體市場收入的核心支撐。
預計到 2031 年,服務板塊的複合年成長率將達到 24.83%,成為預測期內成長最快的板塊。服務板塊的成長源自於部署的複雜性,因為許多團隊在策略制定、整合、工作流程配置和執行管理方面仍然需要幫助。這並非表示軟體存在缺陷,而是表示該板塊正從工具購買階段轉向營運階段。 BrightEdge 於 2026 年 3 月發布了 AI Hyper Cube,體現了這種整合方法,擴展了 AI 代理監控和視覺分析的相關功能。由於買家通常從指導部署開始,然後逐步將業務活動轉移到軟體主導的工作流程,因此服務板塊的成長預計將進一步推動平台的普及。
2025年,基於雲端的部署模式佔據了人工智慧搜尋最佳化軟體市場68.41%的佔有率,顯著超越其他部署模式。雲端模式非常適合此類應用,因為隨著答案引擎的演進,供應商需要頻繁更新提示庫、整合功能和追蹤邏輯。此外,雲端模式還支援分散式團隊間的共用測試、快速上手以及降低部署摩擦。這些優勢使得雲端成為追求速度和廣泛功能的企業的首選。因此,到2025年,雲端模式仍然是人工智慧搜尋最佳化軟體市場的主導部署方式。
混合部署預計到 2031 年將以 23.19% 的複合年成長率成長,這反映了各行業對數據和管治要求日益嚴格的需求。醫療保健、金融服務和公共部門的買家通常需要對其自身數據、客戶記錄和內部測試環境進行更嚴格的控制。混合模式為這些買家提供了一種方法,既能將敏感流程保留在自身的基礎架構中,又能根據需要利用基於雲端的基準測試和介面層。 2025 年 6 月,Botify 透過擴展其 AI 代理程式和 MCP 伺服器的整合,並加入 AWS ISV 加速計劃,進一步提升了其在企業雲端安全領域的應用。本地部署仍然是規模最小的部署模式,但仍被一部分在嚴格的主權和安全框架下運作的買家所採用。總體趨勢是,柔軟性而非單一架構將決定整個 AI搜尋最佳化軟體市場的部署模式。
區域分析
到2025年,北美將佔據人工智慧搜尋最佳化軟體市場34.62%的佔有率,成為最大的區域市場。這一主導地位得益於美國集中了大量大型企業客戶、成熟的數位行銷預算以及多家領先的平台營運商。因此,北美已成為答案引擎最佳化工具和營運流程最早、大規模的試驗場。雖然加拿大和墨西哥的貢獻相對較小,但兩國透過企業採用數位技術和進行跨境品牌推廣活動,也為區域需求提供了支持。
歐洲一直是人工智慧搜尋最佳化軟體市場結構性的重要區域,其中德國、英國和法國構成了企業需求的核心。此外,該地區的商業和政策環境尤其重視準確性、透明度和管治議題,使其地位更加重要。歐洲買家傾向於優先考慮可管理的流程和可記錄的回應質量,這支撐了對具備監控和管治功能的軟體的需求。預計到2031年,亞太地區的複合年成長率將達到27.84%,使其成為人工智慧搜尋最佳化軟體市場成長最快的區域市場。這種成長反映了響應引擎格局的日益分散,以及對支援多引擎的可視化工具而非單一平台最佳化方法的日益成長的需求。
儘管印度的數位化企業基礎正在不斷壯大,但日本和韓國仍然是企業級軟體和託管執行服務極具吸引力的市場。 2026年5月,Semrush將其人工智慧視覺化資料庫擴展至32個國家,並新增了17個區域市場,使其提示庫增加到超過2.61億個LLM提示,凸顯了全部區域日益成長的需求。南美洲仍處於人工智慧應用的早期階段,但隨著數位行銷成熟度的提高,其在巴西和阿根廷的重要性日益凸顯。中東和非洲仍然是規模最小的地區,但沙烏地阿拉伯和阿拉伯聯合大公國因其在數位轉型方面的積極投資而脫穎而出。奈及利亞和南非具有長期發展潛力,因為經濟高效的工具可以解決其尚未成熟的企業基礎設施問題。 2025年12月,經合組織指出,全球中小企業的人工智慧應用仍落後於大型企業,這顯示南美洲以及中東和非洲地區的需求滲透率不足。
其他好處:
- Excel格式的市場預測(ME)表
- 3個月的分析師支持
目錄
第1章:引言
- 研究假設和市場定義
- 調查範圍
第2章:調查方法
第3章執行摘要
第4章 市場狀況
- 市場概覽
- 市場促進因素
- 企業對人工智慧搜尋可見性的需求日益成長
- 從關鍵字排名到答案引擎最佳化的轉變
- 需要減少由人工智慧驅動的概覽分析所造成的自然流量波動。
- 跨多個房地產品牌的內容規模要求
- 將預算重新分配,以提高可衡量的有機效率
- 在專有引文追蹤方面擁有先發優勢
- 市場限制因素
- 人工智慧驅動的可視化與收入之間的關係尚不明確。
- 搜尋介面和排名訊號快速變化
- 對封閉或受限的人工智慧搜尋系統存取權限有限。
- 買家對新類別投資報酬率的懷疑態度
- 宏觀經濟因素對市場的影響
- 產業價值鏈分析
- 科技趨勢
- 監理情勢
- 波特五力分析
第5章 市場規模與成長預測
- 按組件
- 軟體
- 服務
- 部署模式
- 基於雲端的
- 現場
- 混合
- 依最佳化類型
- 人工智慧搜尋可見性最佳化
- 內容最佳化
- 技術搜尋引擎最佳化自動化
- 人工智慧分析和效能監控
- 最佳化聲譽和品牌知名度
- 按公司規模
- 大公司
- 小型企業
- 按最終用戶行業分類
- 零售與電子商務
- BFSI
- 醫療保健和生命科學
- 資訊科技/通訊
- 媒體與娛樂
- 政府/公共行政
- 教育和研究機構
- 運輸/物流
- 其他終端用戶產業
- 按地區
- 北美洲
- 美國
- 加拿大
- 墨西哥
- 南美洲
- 巴西
- 阿根廷
- 其他南美國家
- 歐洲
- 德國
- 英國
- 法國
- 義大利
- 西班牙
- 俄羅斯
- 其他歐洲國家
- 亞太地區
- 中國
- 印度
- 日本
- 韓國
- 澳洲
- 其他亞太國家
- 中東和非洲
- 中東
- 沙烏地阿拉伯
- 阿拉伯聯合大公國
- 其他中東國家
- 非洲
- 南非
- 奈及利亞
- 其他非洲國家
- 中東
- 北美洲
第6章 競爭情勢
- 市場集中度
- 策略趨勢
- 市佔率分析
- 公司簡介
- Semrush Holdings, Inc.
- Ahrefs Pte. Ltd.
- Moz, Inc.
- Conductor, Inc.
- BrightEdge Technologies, Inc.
- Similarweb Ltd.
- seoClarity, LLC
- Surfer Sp. z oo
- MarketMuse, Inc.
- Clearscope, Inc.
- Botify SAS
- ContentKing BV
- AccuRanker ApS
- Mangools sro
- Profound
- Otterly.ai
- Advanced Web Ranking SRL
- Serpstat Limited
- Peec AI
- Authoritas
第7章 市場機會與未來展望
According to Mordor Intelligence, the AI search optimization software market size is expected to grow from USD 1.03 billion in 2025 to USD 1.23 billion in 2026 and is forecast to reach USD 3.32 billion by 2031 at 21.97% CAGR over 2026-2031.
This report is Segmented by Component (Software, and Services), Deployment Mode (Cloud-Based, On-Premise, and Hybrid), Optimization Type (AI Search Visibility Optimization, and More), Enterprise Size (Large Enterprises, and Small and Medium Enterprises), End-User Industry (Retail and E-Commerce, BFSI, and More), and Geography. The Market Forecasts are Provided in Terms of Value (USD).
Global AI Search Optimization Software Market Trends and Insights
Rising Enterprise Demand for AI Search Visibility
Enterprise adoption has moved quickly because AI citation gaps are harder to detect than standard ranking gaps, and that makes the need for dedicated monitoring more urgent. The AI search optimization software market is benefiting from this shift because large marketing teams now treat a lack of AI visibility as an operating risk rather than just a growth issue. Semrush stated in June 2026 that its expanded AI Visibility Index analyzed 126 million U.S. AI search prompts and found wide variation in brand mention rates across competing brands in the same category. That kind of uneven citation exposure makes manual review a weak control process, especially in large organizations with many brands, products, and content teams. The result is a retention advantage for vendors that can provide repeatable visibility benchmarks, because buyers cannot clearly see these gaps with conventional analytics tools. This pattern supports recurring demand across the AI search optimization software market as enterprises move from testing to structured platform adoption.
Shift from Keyword Ranking to Answer Engine Optimization
The move from keyword ranking to answer engine optimization is changing what buyers expect from search software. The AI search optimization software market is gaining from this transition because citation presence matters more in answer environments than a single blue-link position. Enterprise contracts have also expanded as buyers pay for monitoring, competitive benchmarking, and response-surface intelligence rather than for simple keyword dashboards. Conductor reinforced this direction in April 2026, when it launched its next-generation AI Search Performance offer as a unified system of record for answer engine optimization. That move shows how incumbent platforms are recasting core product value around answer visibility, workflow execution, and performance management. As this shift continues, the AI search optimization software market is likely to reward vendors that can integrate search, content, technical signals, and citation control into a single operating layer.
Unclear Attribution Between AI Visibility And Revenue
The largest buying barrier is still attribution. Many finance teams want a direct line between an AI citation event and a later revenue event, and that link is often not visible at the prompt level. BrightEdge stated in 2025 that AI search was functioning as a research channel with near-zero direct conversions tracked at that stage of adoption. That makes it harder for vendors in the AI search optimization software market to justify budgets through last-click logic, even when marketing teams can see the strategic value. The problem is sharper in large enterprises because they have strict buying processes and stronger demands for audited performance evidence. Until vendors build better assisted-conversion and pipeline-influence models, attribution opacity will remain a meaningful restraint on faster category conversion.
Other drivers and restraints analyzed in the detailed report include:
- Need to Reduce Organic Traffic Volatility from AI Overviews
- Content Scale Requirements Across Multi-Property Brands
- Fast-Changing Search Interfaces and Ranking Signals
For complete list of drivers and restraints, kindly check the Table Of Contents.
Segment Analysis
Software accounted for 71.24% of the market in 2025, indicating that platform subscriptions formed the primary revenue base early in the category's development. The AI search optimization software market favored software-first because buyers needed dashboards, citation monitoring, technical diagnostics, and reporting systems before they could scale large service programs. This pattern also reflects the SaaS structure of the category, where platforms can roll out updates across many accounts as answer engines change. Enterprise teams adopted these tools faster than services-led models because visibility monitoring requires repeat use, not one-time project work. The software segment, therefore, anchored the commercial base of the AI search optimization software market in 2025.
Services are projected to grow at a 24.83% CAGR through 2031, making them the fastest-growing component over the forecast period. Growth in services comes from implementation complexity, since many teams still need help with strategy, integration, workflow setup, and managed execution. This is not a sign of software weakness; it shows that the category is moving from tool purchase to operational use. BrightEdge illustrated this combined approach in March 2026 when it launched AI Hyper Cube and also expanded related capabilities around AI agent monitoring and visibility analysis. Over time, service growth is likely to further support platform adoption, as buyers often start with guided delivery before shifting more activity into software-led workflows.
Cloud-based deployment accounted for 68.41% of the AI search optimization software market in 2025, leaving it well ahead of other deployment models. The cloud model fits the category because vendors need to update prompt libraries, integrations, and tracking logic frequently as answer engines change. It also supports shared benchmarking, faster onboarding, and lower deployment friction across distributed teams. These benefits made the cloud the default choice for enterprises that wanted speed and broad feature access. As a result, cloud remained the main delivery layer for the AI search optimization software market in 2025.
Hybrid deployment is expected to grow at a 23.19% CAGR through 2031, reflecting demand from sectors with stricter data and governance requirements. Healthcare, financial services, and public sector buyers often need tighter control over proprietary data, customer records, and internal testing environments. Hybrid models give these buyers a way to keep sensitive processes within their own infrastructure while still using cloud-based benchmarking or interface layers where needed. Botify supported the enterprise cloud security case in June 2025 by expanding its AI agents and MCP Server integration, and by joining the AWS ISV Accelerate Program. On-premise remains the smallest mode, but it still serves a narrow group of buyers that operate under strict sovereignty and security frameworks. The broader direction suggests that flexibility, not a single architecture, will shape deployment choices across the AI search optimization software market.
Complete Report Scope:
- By Component
- Software
- Services
- By Deployment Mode
- Cloud-Based
- On-Premise
- Hybrid
- By Optimization Type
- AI Search Visibility Optimization
- Content Optimization
- Technical SEO Automation
- AI Analytics and Performance Monitoring
- Reputation and Brand Presence Optimization
- By Enterprise Size
- Large Enterprises
- Small And Medium Enterprises
- By End-User Industry
- Retail and E-Commerce
- BFSI
- Healthcare and Life Sciences
- IT and Telecom
- Media and Entertainment
- Government and Public Administration
- Education and Research Institutions
- Transportation and Logistics
- Other End-User Industries
- By Geography
- North America
- United States
- Canada
- Mexico
- South America
- Brazil
- Argentina
- Rest of South America
- Europe
- Germany
- United Kingdom
- France
- Italy
- Spain
- Russia
- Rest of Europe
- Asia-Pacific
- China
- India
- Japan
- South Korea
- Australia
- Rest of Asia-Pacific
- Middle East and Africa
- Middle East
- Saudi Arabia
- United Arab Emirates
- Rest of Middle East
- Africa
- South Africa
- Nigeria
- Rest of Africa
- Middle East
- North America
Geography Analysis
North America held 34.62% of the AI search optimization software market share in 2025, making it the largest regional segment. The region led because major enterprise buyers, mature digital marketing budgets, and several core platform operators are concentrated in the United States. This made North America the earliest large-scale testing ground for answer engine optimization tools and operating workflows. Canada and Mexico were smaller contributors, but both supported regional demand through enterprise digital adoption and cross-border brand activity.
Europe remained a structurally important region for the AI search optimization software market, as Germany, the United Kingdom, and France accounted for the core of enterprise demand. The region also carries added importance because accuracy, transparency, and governance concerns are especially relevant in its business and policy environment. Buyers in Europe are more likely to value controlled workflows and documented response quality, which supports demand for software with monitoring and governance layers. Asia-Pacific is projected to grow at a 27.84% CAGR through 2031, making it the fastest-growing regional segment in the AI search optimization software market. This growth reflects a more fragmented answer-engine environment, which increases the need for multi-engine visibility tools rather than single-platform optimization approaches.
India is expanding with its digital enterprise base, while Japan and South Korea remain attractive markets for enterprise-grade software and managed execution. Semrush supported the case for broader regional demand in May 2026, when it expanded its AI Visibility Database to 32 countries and added 17 new regional markets, bringing the prompt base to more than 261 million LLM prompts. South America is still earlier in adoption, but Brazil and Argentina are building relevance as digital marketing maturity improves. The Middle East and Africa remain the smallest region, though Saudi Arabia and the United Arab Emirates stand out because of digital transformation spending. Nigeria and South Africa offer longer-term potential where cost-efficient tools can match less mature enterprise infrastructure. The OECD stated in December 2025 that AI adoption among small and medium-sized enterprises still lagged that of larger firms globally, indicating underpenetrated demand across South America, the Middle East, and Africa.
- Semrush Holdings, Inc.
- Ahrefs Pte. Ltd.
- Moz, Inc.
- Conductor, Inc.
- BrightEdge Technologies, Inc.
- Similarweb Ltd.
- seoClarity, LLC
- Surfer Sp. z o.o.
- MarketMuse, Inc.
- Clearscope, Inc.
- Botify SAS
- ContentKing B.V.
- AccuRanker ApS
- Mangools s.r.o.
- Profound
- Otterly.AI
- Advanced Web Ranking SRL
- Serpstat Limited
- Peec AI
- Authoritas
Additional Benefits:
- The market estimate (ME) sheet in Excel format
- 3 months of analyst support
TABLE OF CONTENTS
1 INTRODUCTION
- 1.1 Study Assumptions and Market Definition
- 1.2 Scope of the Study
2 RESEARCH METHODOLOGY
3 EXECUTIVE SUMMARY
4 MARKET LANDSCAPE
- 4.1 Market Overview
- 4.2 Market Drivers
- 4.2.1 Rising Enterprise Demand for AI Search Visibility
- 4.2.2 Shift From Keyword Ranking to Answer Engine Optimization
- 4.2.3 Need To Reduce Organic Traffic Volatility From AI Overviews
- 4.2.4 Content Scale Requirements Across Multi-Property Brands
- 4.2.5 Budget Reallocation Toward Measurable Organic Efficiency
- 4.2.6 Early-Mover Advantage In Proprietary Citation Tracking
- 4.3 Market Restraints
- 4.3.1 Unclear Attribution Between AI Visibility And Revenue
- 4.3.2 Fast-Changing Search Interfaces and Ranking Signals
- 4.3.3 Limited Access To Closed or Restricted AI Search Systems
- 4.3.4 Buyer Skepticism Around New Category ROI
- 4.4 Impact of Macroeconomic Factors on the Market
- 4.5 Industry Value Chain Analysis
- 4.6 Technology Outlook
- 4.7 Regulatory Landscape
- 4.8 Porter's Five Forces Analysis
- 4.8.1 Threat of New Entrants
- 4.8.2 Bargaining Power of Suppliers
- 4.8.3 Bargaining Power of Buyers
- 4.8.4 Threat of Substitutes
- 4.8.5 Intensity of Competitive Rivalry
5 MARKET SIZE AND GROWTH FORECASTS (VALUE)
- 5.1 By Component
- 5.1.1 Software
- 5.1.2 Services
- 5.2 By Deployment Mode
- 5.2.1 Cloud-Based
- 5.2.2 On-Premise
- 5.2.3 Hybrid
- 5.3 By Optimization Type
- 5.3.1 AI Search Visibility Optimization
- 5.3.2 Content Optimization
- 5.3.3 Technical SEO Automation
- 5.3.4 AI Analytics and Performance Monitoring
- 5.3.5 Reputation and Brand Presence Optimization
- 5.4 By Enterprise Size
- 5.4.1 Large Enterprises
- 5.4.2 Small And Medium Enterprises
- 5.5 By End-User Industry
- 5.5.1 Retail and E-Commerce
- 5.5.2 BFSI
- 5.5.3 Healthcare and Life Sciences
- 5.5.4 IT and Telecom
- 5.5.5 Media and Entertainment
- 5.5.6 Government and Public Administration
- 5.5.7 Education and Research Institutions
- 5.5.8 Transportation and Logistics
- 5.5.9 Other End-User Industries
- 5.6 By Geography
- 5.6.1 North America
- 5.6.1.1 United States
- 5.6.1.2 Canada
- 5.6.1.3 Mexico
- 5.6.2 South America
- 5.6.2.1 Brazil
- 5.6.2.2 Argentina
- 5.6.2.3 Rest of South America
- 5.6.3 Europe
- 5.6.3.1 Germany
- 5.6.3.2 United Kingdom
- 5.6.3.3 France
- 5.6.3.4 Italy
- 5.6.3.5 Spain
- 5.6.3.6 Russia
- 5.6.3.7 Rest of Europe
- 5.6.4 Asia-Pacific
- 5.6.4.1 China
- 5.6.4.2 India
- 5.6.4.3 Japan
- 5.6.4.4 South Korea
- 5.6.4.5 Australia
- 5.6.4.6 Rest of Asia-Pacific
- 5.6.5 Middle East and Africa
- 5.6.5.1 Middle East
- 5.6.5.1.1 Saudi Arabia
- 5.6.5.1.2 United Arab Emirates
- 5.6.5.1.3 Rest of Middle East
- 5.6.5.2 Africa
- 5.6.5.2.1 South Africa
- 5.6.5.2.2 Nigeria
- 5.6.5.2.3 Rest of Africa
- 5.6.5.1 Middle East
- 5.6.1 North America
6 COMPETITIVE LANDSCAPE
- 6.1 Market Concentration
- 6.2 Strategic Moves
- 6.3 Market Share Analysis
- 6.4 Company Profiles (includes Global Level Overview, Market Level Overview, Core Segments, Financials as available, Strategic Information, Market Rank/Share, Products and Services, Recent Developments)
- 6.4.1 Semrush Holdings, Inc.
- 6.4.2 Ahrefs Pte. Ltd.
- 6.4.3 Moz, Inc.
- 6.4.4 Conductor, Inc.
- 6.4.5 BrightEdge Technologies, Inc.
- 6.4.6 Similarweb Ltd.
- 6.4.7 seoClarity, LLC
- 6.4.8 Surfer Sp. z o.o.
- 6.4.9 MarketMuse, Inc.
- 6.4.10 Clearscope, Inc.
- 6.4.11 Botify SAS
- 6.4.12 ContentKing B.V.
- 6.4.13 AccuRanker ApS
- 6.4.14 Mangools s.r.o.
- 6.4.15 Profound
- 6.4.16 Otterly.ai
- 6.4.17 Advanced Web Ranking SRL
- 6.4.18 Serpstat Limited
- 6.4.19 Peec AI
- 6.4.20 Authoritas
7 MARKET OPPORTUNITIES AND FUTURE OUTLOOK
- 7.1 White-Space and Unmet-Need Assessment

 生成式人工智慧引擎最佳化(GEO)平台市場:按產品類型、部署類型、平台功能、技術類型、應用、最終用戶和地區分類
 創新通路情報:市場佔有率分析、產業趨勢與統計、成長預測(2026-2031)人工智慧搜尋可見性服務:市場佔有率分析、行業趨勢和統計數據、成長預測(2026-2031 年)AI創新最佳化服務:市場佔有率分析、產業趨勢與統計、成長預測(2026-2031年)合成媒體行銷服務:市場佔有率分析、產業趨勢與統計、成長預測(2026-2031)
 生成式引擎最佳化(GEO)平台市場:依產品類型、應用、部署類型、技術、平台功能、國家及地區分類-全球產業分析、市場規模、市場佔有率及2026年至2033年預測
 內容自動化人工智慧工具市場規模、佔有率和成長分析:按工具功能、部署模式、應用領域、企業規模、銷售管道和地區分類-2026-2033年產業預測
 2026年全球銷售說明摘要工具市場報告2026年Web3.0人工智慧生成內容(AIGC)引擎全球市場報告
 設計領域的人工智慧 (AI) 市場:策略洞察與預測 (2026–2031)