


 |
市場調查報告書
商品編碼
2119372
創新通路情報:市場佔有率分析、產業趨勢與統計、成長預測(2026-2031)Innovation Pipeline Intelligence - Market Share Analysis, Industry Trends & Statistics, Growth Forecasts (2026 - 2031) |
||||||

※ 本網頁內容可能與最新版本有所差異。詳細情況請與我們聯繫。
根據 Mordor Intelligence 預測,創新通路情報市場將從 2025 年的 5.4216 億美元成長到 2026 年的 6.1734 億美元,到 2031 年將進一步成長到 9.1102 億美元,2026 年至 2031 年的複合成長率為 8.09%。
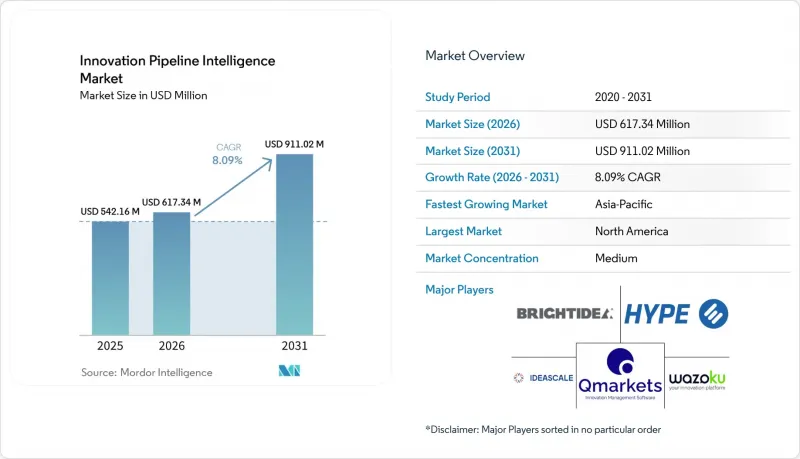
本報告按產品/服務(解決方案和服務)、部署模式(雲端原生、混合、本地部署)、組織規模(大型企業和中小企業)、應用領域(例如,創意管理平台)、產業(例如,科技和電信)以及地區進行細分。市場預測以美元計價。
全球創新通路情報市場趨勢與洞察
企業對結構化創新管道的需求
各組織日益意識到,不受控制的創意生成會導致篩選不嚴謹、工作重複以及缺乏課責。創新流程智慧市場透過階段性評審、評估標準、專案組合文件和通用工作流程來解決此問題。這些功能可以追蹤從提案提交到可行性研究、資金籌措、實施和商業化的整個流程。領導者需要的不只是創意庫,他們還必須權衡可行性、資源分配、風險、策略契合度和預期價值。當創新領導者對回報課責時,決策過程的文件過程就成為採購的必要條件。這提升了管治平台的價值,即使軟體預算有限。
生成式人工智慧在創意評估與投資組合決策的應用
生成式人工智慧可以整理想法、辨識重複項、輔助初步篩檢並模擬場景。當這些功能在不延長決策週期的前提下提升審核效率時,創新流程智慧市場將從中受益。隨著想法數量的增加,限制因素也從產生提案轉向評估提案的品質和可行性。供應商必須證明,人工智慧驅動的評分過程透明、可追溯,並有助於資源分配。這一點在後續的決策審查中尤其重要,因為高階主管和合規團隊也會進行審查。 Wazoku 使用其專有的「期望值」演算法從量化角度評估想法。
跨分散企業系統整合的複雜性
在大規模組織中,整合是一項挑戰,因為財務、客戶資料、專案、人力資源、協作和產品開發等都使用獨立的系統。創新工具需要這些數據來展示專案成本、資源需求和業務價值。當連接需要客製化設計、測試、安全審查或IT部門批准時,創新通路智慧市場可能會面臨部署週期延長的問題。創新團隊可能在未評估平台在其現有架構中的位置之前就購買了該平台。不完整的連結會導致平台數據無法與財務和績效數據進行比較,從而降低報告的準確性。實現可靠的整合可以縮短部署週期並提高專案組合報告的品質。
細分市場分析
到2025年,解決方案將佔創新專案情報市場收入的81.23%。這一主導地位反映了分散式企業團隊對創意管理、專案組合管理和技術搜尋軟體的日益普及。各組織機構正選擇整合解決方案,共用工作流程、標準化數據、產生報告並明確其創新項目的責任歸屬。此類軟體支援專案提交、審核、優先排序、資金籌措申請、協作和決策。它還能幫助領導者跨業務部門和地理管理專案。
預計2026年至2031年,服務業的複合年成長率將達到8.12%。買家通常需要專案設計、實施、培訓、管治和成果評估的協助。當創新流程需要與既定的專案管理和核准流程保持一致時,這種支援至關重要。供應商正擴大利用服務來提高採用率並定義有效的指標。在創新通路智慧產業,能夠將產品功能與高效交付結合的供應商備受青睞。
到 2025 年,雲端原生 SaaS 將佔據創新流程智慧市場 76.42% 的營收佔有率。這一主導地位源自於其低廉的初始成本、快速部署、頻繁更新以及減少內部升級需求。雲端系統可在不同的 IT 環境和地點提供通用服務,這對於不願維護專用基礎架構的小規模買家來說非常有利。更新功能可讓使用者更快地存取新的分析、安全控制和人工智慧功能。
預計2026年至2031年間,混合部署的複合年成長率將達到8.34%。受監管的機構可能需要將敏感的研究資料、產品資料、個人資訊或機密資料保存在指定位置。將於2026年8月全面實施的歐盟人工智慧法案強調人工智慧系統的文檔記錄、管治和可追溯性。混合環境使機構能夠在利用雲端服務進行協作的同時,保持對敏感工作負載的控制。創新流程智慧市場需要支援靈活的架構,而不是單一的雲端模式。
區域分析
預計到2025年,北美將佔創新通路智慧市場收入的38.42%。這主導美國,美國正利用其成熟的企業軟體採購、平台供應商、雲端採用以及正式的創新計劃。在加拿大,與多倫多、蒙特婁和溫哥華的大學合作進行的人工智慧研究正在加速人工智慧的普及應用;而在墨西哥,跨國公司的需求也不斷成長。北美買家通常會參與制定供應商的人工智慧評估、分析以及與Microsoft 365和Salesforce整合藍圖。
歐洲在創新管線情報市場領域已趨於成熟,且監管環境較為敏感。德國、英國和法國在製造業、金融服務業、製藥業、研究網路和公共部門等領域的應用方面處於領先地位。 Qmarkets於2025年10月成為法國國家公共採購機構UGAP的認證供應商。歐盟人工智慧法預計將於2026年8月全面實施,這將使人工智慧管治備受關注。義大利、西班牙和北歐國家是成長型市場,而南美洲的需求則集中在巴西和墨西哥。
預計到2031年,亞太地區將以9.94%的複合年成長率成長,成為「創新管道智慧市場」所有區域中成長最快的地區。中國、印度、日本和韓國正在加強對研發活動、雲端基礎設施和創新的公共支援。中國的私人科技公司正在推廣系統化的創新實踐。印度的成長與「創業印度」和「數位印度」計畫密切相關,IT服務公司正在將人工智慧和機器學習融入其內部專案中。日本正在推動產品開發管治的數位化,中東地區的需求則得益於阿拉伯聯合大公國和沙烏地阿拉伯的轉型計畫。非洲仍處於起步階段,南非和奈及利亞是主要的採用中心。
其他好處:
- Excel格式的市場預測(ME)表
- 3個月的分析師支持
目錄
第1章:引言
- 研究假設和市場定義
- 調查範圍
第2章:調查方法
第3章執行摘要
第4章 市場狀況
- 市場概覽
- 市場促進因素
- 企業對結構化創新管道的需求
- 雲端優先採購和訂閱經濟
- 用於創意評估和投資組合決策的生成式人工智慧
- 加強研發及生態系型創新
- 證明創新投資報酬率的壓力
- 受監管產業對可追溯創新管治的需求。
- 市場限制因素
- 跨分散企業系統整合的複雜性
- 創意轉化為商業成果的轉換率很低。
- 關於資料儲存位置和保密性的限制
- 變革管理中的摩擦以及經營團隊缺乏支持
- 宏觀經濟因素對市場的影響
- 產業價值鏈分析
- 技術展望
- 監理情勢
- 波特五力分析
第5章 市場規模與成長預測
- 報價
- 解決方案
- 服務
- 按部署模式
- 雲端原生
- 混合
- 現場
- 按組織規模
- 大公司
- 小型企業
- 透過使用
- 創意管理平台
- 投資組合和專案管理平台
- 科技探索與開放式創新平台
- 創新分析與預測平台
- 其他用途
- 按行業
- 科技與通訊
- 製造業/汽車
- 金融和保險
- 醫療保健和生命科學
- 消費品和零售
- 能源公用事業
- 政府/教育
- 按地區
- 北美洲
- 美國
- 加拿大
- 墨西哥
- 南美洲
- 巴西
- 阿根廷
- 智利
- 其他南美國家
- 歐洲
- 德國
- 英國
- 法國
- 義大利
- 西班牙
- 其他歐洲國家
- 亞太地區
- 中國
- 日本
- 印度
- 韓國
- 澳洲
- 其他亞太國家
- 中東
- 阿拉伯聯合大公國
- 沙烏地阿拉伯
- 卡達
- 其他中東國家
- 非洲
- 南非
- 埃及
- 奈及利亞
- 其他非洲國家
- 北美洲
第6章 競爭情勢
- 市場集中度
- 策略趨勢
- 市佔率分析
- 公司簡介
- Brightidea Inc.
- HYPE Innovation GmbH
- IdeaScale Inc.
- Qmarkets Ltd.
- Wazoku Ltd.
- Sopheon plc
- Planbox Inc.
- InnovationCast BV
- Ideanote ApS
- Agorize SAS
- Accept Mission BV
- Viima Solutions Oy
- AEVO Innovate
- Vianeo SAS
- Exago SL
- Nosco ApS
- Crowdicity Ltd.
- Innosabi GmbH
- ITONICS GmbH
- CrowdWorx GmbH
- Catapult Innovations Ltd.
- Ezassi, Inc.
- Questel SAS
- Planview, Inc.
- Collaboration.Ai, Inc.
第7章 市場機會與未來展望
According to Mordor Intelligence, the innovation pipeline intelligence market size is projected to expand from USD 542.16 million in 2025 to USD 617.34 million in 2026, and to USD 911.02 million by 2031, registering a CAGR of 8.09% between 2026 and 2031.
This report is Segmented by Offering (Solutions, and Services), Deployment Model (Cloud-Native, Hybrid, and On-Premises), Organization Size (Large Enterprises, and Small and Medium-Sized Enterprises), Application (Idea Management Platforms, and More), Industry Vertical (Technology and Telecommunications, and More), and Geography. The Market Forecasts are Provided in Terms of Value (USD).
Global Innovation Pipeline Intelligence Market Trends and Insights
Enterprise Demand for Structured Innovation Pipelines
Organizations increasingly view unmanaged idea generation as a source of weak selection, duplicated work, and limited accountability. The Innovation Pipeline Intelligence Market addresses this concern through stage gates, evaluation criteria, portfolio records, and common workflows. These capabilities track proposals from submission through feasibility review, funding, implementation, and commercialization. Leaders need more than an idea repository because they must compare feasibility, resourcing, risk, strategic fit, and expected value. A documented decision trail becomes a procurement requirement when innovation leaders are accountable for returns. This makes governance platforms valuable even when software budgets are constrained.
Generative AI for Idea Evaluation and Portfolio Decisions
Generative AI can organize ideas, identify duplicates, support early screening, and model scenarios. The Innovation Pipeline Intelligence Market benefits when these functions increase review capacity without extending decision cycles. Greater idea volume shifts the constraint from generating proposals to judging their quality and feasibility. Vendors must demonstrate that AI-supported scoring is transparent, traceable, and useful for resource allocation. This is especially important when executives or compliance teams later review decisions. Wazoku uses its Expected Value algorithm to assess ideas across quantitative dimensions.
Integration Complexity Across Fragmented Enterprise Systems
Integration is challenging because large organizations use separate systems for finance, customer data, projects, human resources, collaboration, and product development. Innovation tools need this data to show project costs, resourcing needs, and business value. The Innovation Pipeline Intelligence Market can face longer deployments when connections require custom design, testing, security review, or IT approval. Innovation teams may buy platforms before assessing their place within existing architecture. Incomplete links weaken reporting when platform data cannot be compared with financial or execution data. Reliable integrations can shorten implementation and improve portfolio reporting.
Other drivers and restraints analyzed in the detailed report include:
- Cloud-First Procurement and Subscription Economics
- Rising R&D Intensity and Ecosystem-Based Innovation
- Low Conversion From Ideas to Commercialized Outcomes
For complete list of drivers and restraints, kindly check the Table Of Contents.
Segment Analysis
Solutions accounted for 81.23% of Innovation Pipeline Intelligence Market revenue in 2025. This lead reflects the established use of idea management, portfolio management, and technology scouting software by dispersed enterprise teams. Organizations choose integrated solutions for shared workflows, data standards, reporting, and ownership across innovation programs. The software supports intake, review, prioritization, funding requests, collaboration, and decision records. It also helps leaders manage projects across business units and locations.
Services are forecast to grow at an 8.12% CAGR from 2026 to 2031. Buyers often need help with program design, adoption, training, governance, and outcome measurement. Support is important when innovation processes must align with established project management and approval practices. Vendors increasingly use services to improve adoption and define useful metrics. The Innovation Pipeline Intelligence industry rewards providers that combine product capability with effective delivery.
Cloud-Native SaaS represented 76.42% of Innovation Pipeline Intelligence Market revenue in 2025. Its lead reflects lower upfront costs, faster implementation, more frequent updates, and a reduced need for internal upgrades. Cloud systems offer a common service across different IT environments and locations. This is useful for smaller buyers who do not want to maintain specialized infrastructure. Updates can make new analytics, security controls, and AI functions available faster.
Hybrid deployment is forecast to grow at an 8.34% CAGR between 2026 and 2031. Regulated organizations may need sensitive research, product, personal, or confidential data to remain within defined locations. The EU AI Act is fully applicable in August 2026 and emphasizes documentation, governance, and traceability for AI systems. Hybrid environments retain control over sensitive workloads while using cloud services for collaboration. The Innovation Pipeline Intelligence Market must support flexible architectures rather than a single cloud model.
Complete Report Scope:
- By Offering
- Solutions
- Services
- By Deployment Model
- Cloud-Native
- Hybrid
- On-Premises
- By Organization Size
- Large Enterprises
- Small and Medium-Sized Enterprises
- By Application
- Idea Management Platforms
- Portfolio and Project Management Platforms
- Technology Scouting and Open Innovation Platforms
- Innovation Analytics and Prediction Platforms
- Other Applications
- By Industry Vertical
- Technology and Telecommunications
- Manufacturing and Automotive
- Financial Services and Insurance
- Healthcare and Life Sciences
- Consumer Goods and Retail
- Energy and Utilities
- Government and Education
- By Geography
- North America
- United States
- Canada
- Mexico
- South America
- Brazil
- Argentina
- Chile
- Rest of South America
- Europe
- Germany
- United Kingdom
- France
- Italy
- Spain
- Rest of Europe
- Asia-Pacific
- China
- Japan
- India
- South Korea
- Australia
- Rest of Asia-Pacific
- Middle East
- United Arab Emirates
- Saudi Arabia
- Qatar
- Rest of Middle East
- Africa
- South Africa
- Egypt
- Nigeria
- Rest of Africa
- North America
Geography Analysis
North America accounted for 38.42% of Innovation Pipeline Intelligence Market revenue in 2025, led by the United States, driven by established enterprise software purchasing, platform suppliers, cloud adoption, and formal innovation programs. Canada has supported adoption through AI research linked to universities in Toronto, Montreal, and Vancouver, while Mexico is gaining demand from multinational deployments. North American buyers often shape vendor road maps for AI-assisted evaluation, analytics, and integrations with Microsoft 365 and Salesforce.
Europe is a mature, regulation-sensitive region for the Innovation Pipeline Intelligence Market. Germany, the United Kingdom, and France lead in adoption across manufacturing, financial services, pharmaceuticals, research networks, and public-sector demand. Qmarkets became an accredited supplier on UGAP, France's national public procurement agency, in October 2025. The EU AI Act will be fully applicable in August 2026 and has drawn attention to AI governance. Italy, Spain, and the Nordic countries are growing markets, while demand in South America is concentrated in Brazil and Mexico.
Asia-Pacific is forecast to grow at a 9.94% CAGR through 2031, the fastest regional rate in the Innovation Pipeline Intelligence Market. China, India, Japan, and South Korea combine to expand R&D activity, cloud infrastructure, and public support for innovation. China's private technology firms are increasing structured innovation practices. India's growth is linked to Startup India and Digital India programs, while IT services firms are adding AI and machine learning to internal programs. Japan is digitizing product-development governance, and demand in the Middle East is supported by transformation programs in the UAE and Saudi Arabia. Africa remains in its early stages, with South Africa and Nigeria as the main centers of adoption.
- Brightidea Inc.
- HYPE Innovation GmbH
- IdeaScale Inc.
- Qmarkets Ltd.
- Wazoku Ltd.
- Sopheon plc
- Planbox Inc.
- InnovationCast B.V.
- Ideanote ApS
- Agorize SAS
- Accept Mission B.V.
- Viima Solutions Oy
- AEVO Innovate
- Vianeo SAS
- Exago S.L.
- Nosco ApS
- Crowdicity Ltd.
- Innosabi GmbH
- ITONICS GmbH
- CrowdWorx GmbH
- Catapult Innovations Ltd.
- Ezassi, Inc.
- Questel SAS
- Planview, Inc.
- Collaboration.Ai, Inc.
Additional Benefits:
- The market estimate (ME) sheet in Excel format
- 3 months of analyst support
TABLE OF CONTENTS
1 INTRODUCTION
- 1.1 Study Assumptions and Market Definition
- 1.2 Scope of the Study
2 RESEARCH METHODOLOGY
3 EXECUTIVE SUMMARY
4 MARKET LANDSCAPE
- 4.1 Market Overview
- 4.2 Market Drivers
- 4.2.1 Enterprise Demand for Structured Innovation Pipelines
- 4.2.2 Cloud-First Procurement and Subscription Economics
- 4.2.3 Generative AI for Idea Evaluation and Portfolio Decisions
- 4.2.4 Rising R&D Intensity and Ecosystem-Based Innovation
- 4.2.5 Pressure to Demonstrate Innovation ROI
- 4.2.6 Regulated-Industry Demand for Traceable Innovation Governance
- 4.3 Market Restraints
- 4.3.1 Integration Complexity Across Fragmented Enterprise Systems
- 4.3.2 Low Conversion from Ideas to Commercialized Outcomes
- 4.3.3 Data Residency and Confidentiality Constraints
- 4.3.4 Change-Management Friction and Weak Executive Sponsorship
- 4.4 Impact of Macroeconomic Factors on the Market
- 4.5 Industry Value-Chain Analysis
- 4.6 Technology Outlook
- 4.7 Regulatory Landscape
- 4.8 Porter's Five Forces Analysis
- 4.8.1 Threat of New Entrants
- 4.8.2 Bargaining Power of Suppliers
- 4.8.3 Bargaining Power of Buyers
- 4.8.4 Threat of Substitutes
- 4.8.5 Intensity of Competitive Rivalry
5 MARKET SIZE AND GROWTH FORECASTS (VALUE)
- 5.1 By Offering
- 5.1.1 Solutions
- 5.1.2 Services
- 5.2 By Deployment Model
- 5.2.1 Cloud-Native
- 5.2.2 Hybrid
- 5.2.3 On-Premises
- 5.3 By Organization Size
- 5.3.1 Large Enterprises
- 5.3.2 Small and Medium-Sized Enterprises
- 5.4 By Application
- 5.4.1 Idea Management Platforms
- 5.4.2 Portfolio and Project Management Platforms
- 5.4.3 Technology Scouting and Open Innovation Platforms
- 5.4.4 Innovation Analytics and Prediction Platforms
- 5.4.5 Other Applications
- 5.5 By Industry Vertical
- 5.5.1 Technology and Telecommunications
- 5.5.2 Manufacturing and Automotive
- 5.5.3 Financial Services and Insurance
- 5.5.4 Healthcare and Life Sciences
- 5.5.5 Consumer Goods and Retail
- 5.5.6 Energy and Utilities
- 5.5.7 Government and Education
- 5.6 By Geography
- 5.6.1 North America
- 5.6.1.1 United States
- 5.6.1.2 Canada
- 5.6.1.3 Mexico
- 5.6.2 South America
- 5.6.2.1 Brazil
- 5.6.2.2 Argentina
- 5.6.2.3 Chile
- 5.6.2.4 Rest of South America
- 5.6.3 Europe
- 5.6.3.1 Germany
- 5.6.3.2 United Kingdom
- 5.6.3.3 France
- 5.6.3.4 Italy
- 5.6.3.5 Spain
- 5.6.3.6 Rest of Europe
- 5.6.4 Asia-Pacific
- 5.6.4.1 China
- 5.6.4.2 Japan
- 5.6.4.3 India
- 5.6.4.4 South Korea
- 5.6.4.5 Australia
- 5.6.4.6 Rest of Asia-Pacific
- 5.6.5 Middle East
- 5.6.5.1 United Arab Emirates
- 5.6.5.2 Saudi Arabia
- 5.6.5.3 Qatar
- 5.6.5.4 Rest of Middle East
- 5.6.6 Africa
- 5.6.6.1 South Africa
- 5.6.6.2 Egypt
- 5.6.6.3 Nigeria
- 5.6.6.4 Rest of Africa
- 5.6.1 North America
6 COMPETITIVE LANDSCAPE
- 6.1 Market Concentration
- 6.2 Strategic Moves
- 6.3 Market Share Analysis
- 6.4 Company Profiles (includes Global Level Overview, Market Level Overview, Core Segments, Financials as available, Strategic Information, Market Rank/Share, Products and Services, Recent Developments)
- 6.4.1 Brightidea Inc.
- 6.4.2 HYPE Innovation GmbH
- 6.4.3 IdeaScale Inc.
- 6.4.4 Qmarkets Ltd.
- 6.4.5 Wazoku Ltd.
- 6.4.6 Sopheon plc
- 6.4.7 Planbox Inc.
- 6.4.8 InnovationCast B.V.
- 6.4.9 Ideanote ApS
- 6.4.10 Agorize SAS
- 6.4.11 Accept Mission B.V.
- 6.4.12 Viima Solutions Oy
- 6.4.13 AEVO Innovate
- 6.4.14 Vianeo SAS
- 6.4.15 Exago S.L.
- 6.4.16 Nosco ApS
- 6.4.17 Crowdicity Ltd.
- 6.4.18 Innosabi GmbH
- 6.4.19 ITONICS GmbH
- 6.4.20 CrowdWorx GmbH
- 6.4.21 Catapult Innovations Ltd.
- 6.4.22 Ezassi, Inc.
- 6.4.23 Questel SAS
- 6.4.24 Planview, Inc.
- 6.4.25 Collaboration.Ai, Inc.
7 MARKET OPPORTUNITIES AND FUTURE OUTLOOK
- 7.1 White-Space and Unmet-Need Assessment

 生成式人工智慧引擎最佳化(GEO)平台市場:按產品類型、部署類型、平台功能、技術類型、應用、最終用戶和地區分類
 人工智慧搜尋可見性服務:市場佔有率分析、行業趨勢和統計數據、成長預測(2026-2031 年)AI創新最佳化服務:市場佔有率分析、產業趨勢與統計、成長預測(2026-2031年)合成媒體行銷服務:市場佔有率分析、產業趨勢與統計、成長預測(2026-2031)
 生成式引擎最佳化(GEO)平台市場:依產品類型、應用、部署類型、技術、平台功能、國家及地區分類-全球產業分析、市場規模、市場佔有率及2026年至2033年預測人工智慧搜尋最佳化軟體:市場佔有率分析、產業趨勢與統計、成長預測(2026-2031)
 內容自動化人工智慧工具市場規模、佔有率和成長分析:按工具功能、部署模式、應用領域、企業規模、銷售管道和地區分類-2026-2033年產業預測
 2026年全球銷售說明摘要工具市場報告2026年Web3.0人工智慧生成內容(AIGC)引擎全球市場報告
 設計領域的人工智慧 (AI) 市場:策略洞察與預測 (2026–2031)