


 |
市場調查報告書
商品編碼
2119231
AI創新最佳化服務:市場佔有率分析、產業趨勢與統計、成長預測(2026-2031年)AI Creative Optimization Services - Market Share Analysis, Industry Trends & Statistics, Growth Forecasts (2026 - 2031) |
||||||

※ 本網頁內容可能與最新版本有所差異。詳細情況請與我們聯繫。
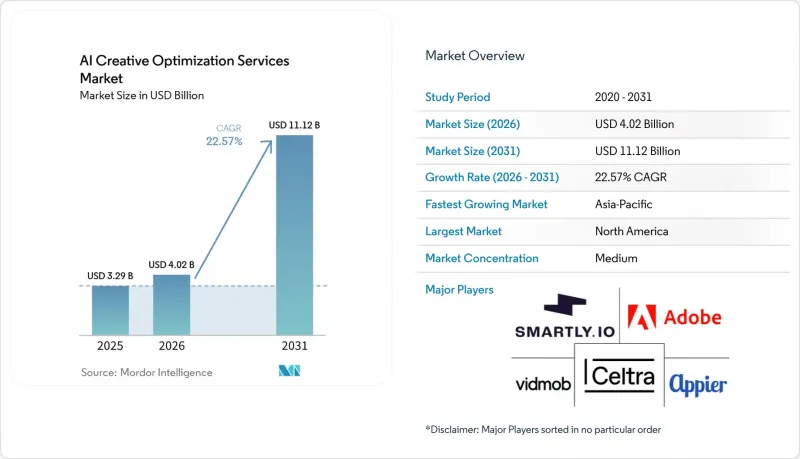
據 Mordor Intelligence 稱,2025 年人工智慧創新最佳化服務市值為 32.9 億美元,預計到 2031 年將從 2026 年的 40.2 億美元成長至 111.2 億美元,預測期(2026-2031 年)複合年成長率為 22.57%。
本報告按服務類型(包括創新策略和最佳化諮詢服務、動態創新最佳化 (DCO) 管理服務、生成式創新變體開發服務以及創新效果分析和洞察服務)、最終用戶行業(包括零售和電子商務)以及地區進行細分。市場預測以價值(美元)表示。
全球人工智慧創新最佳化服務市場趨勢與洞察
利用人工智慧生成技術,減少創建變體所需的時間和成本。
在人工智慧創新最佳化服務市場,隨著團隊從手動開發轉向人工智慧驅動的素材創建,製作流程正在改變。過去每個宣傳活動只能製作 5-10 個不同版本的品牌,現在可以同時在不同的廣告位、目標受眾、產品和視覺表現形式上部署數百個管道就緒版本。這種能力使得付費媒體能夠更頻繁地進行測試和更新,而不再局限於大型宣傳活動推出。據 IAB 稱,人工智慧驅動的製作可以將創新開發週期縮短 80-90%,使持續更新對廣告主而言更加現實。更多的素材版本為投放系統提供了更多創新訊號,以便在分配展示次數時進行評估。 Google Performance Max 和 Meta Advantage+ 充分利用提交素材的品質和多樣性來最佳化投放流程,從而更緊密地將創新基礎架構、媒體效率和宣傳活動執行聯繫起來。在人工智慧創新最佳化服務市場,這種轉變正在改變創新團隊的角色。創新團隊現在需要跨管道管理素材數量、效果回饋、品牌規則和投放準備情況,並將這些活動視為相互關聯的任務。因此,生產速度使得工作流程能夠支援創新更新以及在宣傳活動啟動後進行的持續最佳化工作。
付費社群媒體、展示廣告和聯網電視上的個人化廣告需求不斷成長
人工智慧創新最佳化服務市場的發展動力源自於付費社群媒體、展示廣告和聯網電視等管道對個人化廣告的需求。個人化創新已不再局限於簡單的文案修改,而是根據不同的受眾和投放條件,以情境感知的方式將多種視覺和訊息元素組合在一起。 IAB 的一項調查預測,到 2025 年,廣告主將使用生成式人工智慧來建立受眾最佳化版本、修改視覺風格並增強情境相關性。 Innovid 的一份報告顯示,醫療保健行銷人員在聯網電視的預算分配增加了 60%,這表明即使在以前主要用於廣播的廣告形式中,個人化需求也變得越來越重要。醫療保健和金融服務業的廣告主在高度監管的環境中應用個人化創新時,需要逐一版本進行審核。託管服務透過提供對已通過核准的訊息和素材的存取權限,並對更多版本進行醫療、法律和監管方面的檢查,來滿足這一需求。因此,在人工智慧創新最佳化服務市場中,服務提供者必須將個人化視為一個營運流程,而不僅僅是宣傳活動開始時選擇的一種創新選項。此外,當需要在不改變已通過核准聲明的情況下產生多個版本時,可重複使用的核准規則和系統化的資產記錄就變得很有用。
資料隱私和訊號遺失限制了個人化所需的輸入資訊。
由於用於個人化的行為訊號持續流失,人工智慧創新最佳化服務市場面臨諸多限制。 Safari 和 Firefox 的保護機制、用戶級廣告攔截器、用戶同意選項以及行動追蹤限制,都在減少創新系統可取得的受眾資料。儘管Google已撤回其從 Chrome 瀏覽器中徹底移除第三方 Cookie 的計劃,但跨網站追蹤的品質在整個廣告領域仍然受到限制。 IAB 技術實驗室正在製定「已驗證受眾」標準,旨在支援更負責任的定向和數據利用。廣告主可以利用 Google Ads Data Hub 和 Amazon Marketing Cloud 等無塵室環境來處理部分第一方資料。與傳統的基於像素的工作流程相比,這些方法需要更高的整合度和更管治,這增加了個人化創新投放的營運負擔,並延緩了宣傳活動規劃中的資料利用,同時也凸顯了在隱私保護流程中對可用資產的品質和多樣性的日益重視。
細分市場分析
到 2025 年,託管式動態創新最佳化服務將佔人工智慧創新最佳化服務市場 27.38% 的佔有率。企業廣告主利用這些服務同時調整程式化廣告、社群媒體廣告和聯網電視資源的個人化程度。其營運模式包括持續的資料擷取、創新組裝、A/B 測試和效果報告。這與一次性創新部署不同,因為即使廣告資源、受眾和宣傳活動效果發生變化,該服務也能持續運作。這種持續性的工作模式支撐了託管服務的收入,並使服務提供者能夠在宣傳活動啟動後繼續參與其中。
預計從2026年到2031年,生成式創新變體開發服務將以23.17%的複合年成長率成長。隨著品牌建構能夠根據單一簡報產生數百個管道適用素材的流程,該服務類別中的人工智慧創新最佳化服務市場正在擴張。團隊可以利用此流程創建針對不同投放位置、受眾、語言、產品和格式需求的客製化版本,而無需從頭開始重新建立每個素材。 2025年2月,VidMob發布了適用於Adobe Premiere Pro和Adobe Illustrator的生成式人工智慧插件,展示了創新工具與以效果為導向的製作工作流程之間的整合。此外,其創新效果分析和洞察服務正在加強創新數據與行銷智慧系統之間的聯繫,幫助廣告主評估影響投放和回應效果的素材特徵。
區域分析
到2025年,北美將佔據41.63%的市場佔有率。該地區擁有成熟的程序化廣告基礎設施、經驗豐富的企業廣告主,以及許多主要平台和服務供應商在美國的集中佈局。這些條件有利於在社群媒體、展示廣告、聯網電視和電商媒體等各個領域應用創新系統,使團隊能夠協調素材的創建、使用和效果衡量。此外,該地區還有大量廣告主願意投資數據整合、創新測試和效果衡量工具,以支援創意管理系統的實施。南美洲是一個新興市場,其中巴西是成長的主要驅動力,社交影片和電商廣告的持續發展推動了這一趨勢。
歐洲,尤其是在德國、英國和法國等國的推動下,已成為全球第二大人工智慧創意最佳化服務市場。該地區的人工智慧創新最佳化服務市場受制於對先進程式化系統和第一方數據主導創新方法的需求,這些方法能夠在更嚴格的授權控制下運作。由於GDPR的授權和資料最小化規則限制了行為定向,廣告主更加重視創新品質訊號,從而提高了廣告素材的相關性,並增強了受控測試的效用。歐盟人工智慧法新增了內容管治要求,預計在2027年前分階段實施。這將有助於建立一套系統化的工作流程,用於審查和記錄人工智慧驅動的廣告內容。
預計亞太地區在2026年至2031年間將以23.94%的複合年成長率成長。印度和中國是這一成長的主要驅動力,這得益於零售媒體、短影片以及大規模位廣告生態系統,而後者需要頻繁且地域性強的廣告內容。騰訊、位元組跳動、百度、阿里巴巴和抖音/TikTok等公司正在將人工智慧創新工具整合到其廣告技術堆疊中,這使得廣告主需要管理跨多個平台、具有不同數據和格式要求的廣告活動。 Appier於2026年在泰國和越南推出“AdCreative.ai”,將其生成式創新能力擴展到東南亞市場。隨著廣告主適應行動優先的媒體環境,該地區的人工智慧創意最佳化服務市場具有巨大的發展潛力,因為行動優先的媒體環境需要多語言、多平台和多層次的創新基礎設施以及在創新的執行。同時,在中東,阿拉伯聯合大公國和沙烏地阿拉伯引領人工智慧的應用,而在非洲,埃及、奈及利亞和南非正在支援行動優先的需求。
其他好處:
- Excel格式的市場預測(ME)表
- 3個月的分析師支持
目錄
第1章:引言
- 研究假設和市場定義
- 調查範圍
第2章:調查方法
第3章執行摘要
第4章 市場狀況
- 市場概覽
- 市場促進因素
- 擴大效果行銷預算,以最佳化創新主導行銷
- 付費社群媒體、展示廣告和連網電視廣告對個人化廣告的需求日益成長。
- 透過人工智慧生成技術,降低了產品變體的生產時間和成本。
- 日益加劇的創新疲勞和對持續更新的需求
- 第一方創新數據和預測評分正擴大被用作媒體的輸入數據。
- 零售媒體形式的快速成長正在推動對整合創新管理的需求。
- 市場限制因素
- 資料隱私和訊號遺失限制了用於個人化的輸入資訊。
- 行銷技術、廣告技術和衡量指標體系之間整合的複雜性。
- 關於披露人工智慧內容和合成表演者的合規負擔
- 原生平台的自動化正在減少獨立供應商的差異化機會。
- 產業價值鏈分析
- 宏觀經濟因素對市場的影響
- 監理情勢
- 技術展望
- 波特五力分析
第5章 市場規模與成長預測
- 按服務類型
- 創新策略與最佳化諮詢服務
- 託管式動態創新最佳化 (DCO) 服務
- 生成式創新變體開發服務
- 創新分析與洞察
- 其他服務類型
- 按最終用戶行業分類
- 零售與電子商務
- 媒體與娛樂
- 資訊科技/通訊
- BFSI
- 醫療保健和生命科學
- 車
- 其他終端用戶產業
- 按地區
- 北美洲
- 美國
- 加拿大
- 墨西哥
- 南美洲
- 巴西
- 阿根廷
- 智利
- 其他南美國家
- 歐洲
- 德國
- 英國
- 法國
- 義大利
- 西班牙
- 其他歐洲國家
- 亞太地區
- 中國
- 日本
- 印度
- 韓國
- 澳洲
- 其他亞太國家
- 中東
- 沙烏地阿拉伯
- 阿拉伯聯合大公國
- 卡達
- 其他中東國家
- 非洲
- 南非
- 埃及
- 奈及利亞
- 其他非洲國家
- 北美洲
第6章 競爭情勢
- 市場集中度
- 策略趨勢
- 市佔率分析
- 公司簡介
- Adobe Inc.
- Smartly.io Solutions Oy
- Celtra, Inc.
- VidMob, Inc.
- Appier Group Inc.
- Bannerflow AB
- Jivox Corporation
- Persado, Inc.
- Mediaocean LLC
- Adform A/S
- Criteo SA
- Quantcast Corporation
- Innovid Corp.
- Hunch Ads doo
- Marpipe, Inc.
- Creatopy Inc.
- CreativeX, Inc.
- Shuttlerock Limited
第7章 市場機會與未來展望
According to Mordor Intelligence, the AI creative optimization services market size was valued at USD 3.29 billion in 2025 and estimated to grow from USD 4.02 billion in 2026 to reach USD 11.12 billion by 2031, at a CAGR of 22.57% during the forecast period (2026-2031).
This report is Segmented by Service Type (Creative Strategy and Optimization Consulting Services, Managed Dynamic Creative Optimization (DCO) Services, Generative Creative Variant Development Services, Creative Performance Analytics and Insight Services, and More), End-User Industry (Retail and E-Commerce, and More), and Geography. The Market Forecasts are Provided in Terms of Value (USD).
Global AI Creative Optimization Services Market Trends and Insights
Generative AI Compression of Variant Production Time and Cost
The AI creative optimization services market is transforming production workflows as teams shift from manual development to AI-assisted asset creation. Brands that once produced 5-10 variants for a campaign can now deploy hundreds of channel-ready versions simultaneously, across different placements, audiences, products, and visual treatments. This capacity supports more frequent testing and refresh cycles across paid media, rather than limiting updates to major campaign launches. The IAB reported that AI-assisted production can reduce creative development cycle times by 80-90%, making continuous refresh programs more feasible for advertisers. Greater variation also gives delivery systems more creative signals to assess when allocating impressions. Google Performance Max and Meta Advantage+ use the quality and diversity of submitted assets in their delivery processes, making creative infrastructure more closely connected to media efficiency and campaign execution. Within the AI creative optimization services market, this changes the role of creative teams, who must manage asset volume, performance feedback, brand rules, and channel readiness as interconnected activities. The result is a workflow in which production speed supports both creative refresh and ongoing optimization work performed after a campaign is live.
Demand for Personalized Ads Across Paid Social, Display, and Connected TV
The AI creative optimization services market is supported by demand for personalized advertising across paid social, display, and connected TV. Personalized creative has moved beyond simple copy changes to the context-aware assembly of multiple visual and messaging elements for different audiences and placement conditions. In 2025, the IAB found that advertisers used generative AI to create audience-specific versions, change visual styles, and improve contextual relevance. Innovid reported a 60% increase in healthcare marketer allocation to connected TV, showing that personalization requirements are reaching formats once used mainly for broadcast-style delivery. Healthcare and financial services advertisers need version-level review processes as they apply personalized creative in regulated environments. Managed services can address this requirement by applying medical, legal, and regulatory checks to a larger set of versions while keeping approved messages and assets available for activation. The AI creative optimization services market, therefore, requires providers to treat personalization as an operational process rather than merely a creative option selected at the start of a campaign. This also makes reusable approval rules and orderly asset records useful when teams must produce many versions without changing approved claims.
Data Privacy and Signal Loss Limiting Personalization Inputs
The AI creative optimization services market faces limits due to the continued loss of behavioral signals used for personalization. Safari and Firefox protections, user-level ad blockers, consent choices, and mobile tracking limits reduce the observable audience data available to creative systems. Google changed its plan to fully remove third-party cookies from Chrome, but the quality of cross-site tracking remains constrained across the broader advertising environment. The IAB Tech Lab describes authenticated audience standards that seek to support more responsible addressability and data use. Advertisers can use clean-room environments such as Google Ads Data Hub and Amazon Marketing Cloud to work with some first-party data. These approaches require more integration and governance than older pixel-based workflows, raising the operating burden for personalized creative delivery, slowing the use of data in campaign planning, and shifting attention toward the quality and variety of assets that remain available within privacy-safe processes.
Other drivers and restraints analyzed in the detailed report include:
- Expansion of Performance Marketing Budgets Toward Creative-Led Optimization
- Retail Media Format Proliferation Raising Demand for Creative Orchestration
- Integration Complexity Across MarTech, AdTech, and Measurement Stacks
For complete list of drivers and restraints, kindly check the Table Of Contents.
Segment Analysis
Managed Dynamic Creative Optimization Services captured 27.38% of the AI creative optimization services market size in 2025. Enterprise advertisers use these services to coordinate personalization across programmatic, social, and connected TV inventory simultaneously. The operating model covers recurring data ingestion, creative assembly, A/B testing, and performance reporting. This differs from a one-time creative deployment because the service remains active as inventory, audiences, and campaign results change. The recurring nature of this work supports managed-service revenue and keeps providers involved after a campaign launches.
Generative Creative Variant Development Services is projected to expand at a 23.17% CAGR between 2026 and 2031. The AI creative optimization services market for this service type is advancing as brands build pipelines that can turn 1 brief into hundreds of channel-ready assets. Teams can use the process to create versions for placement, audience, language, product, and format needs without rebuilding every asset from the start. VidMob introduced a generative AI plugin for Adobe Premiere Pro and Adobe Illustrator in February 2025, illustrating the connection between creative tools and performance-oriented production workflows. Creative Performance Analytics and Insight Services also increasingly connect creative data with marketing intelligence systems, helping advertisers assess the asset features that support delivery and response outcomes.
Complete Report Scope:
- By Service Type
- Creative Strategy and Optimization Consulting Services
- Managed Dynamic Creative Optimization (DCO) Services
- Generative Creative Variant Development Services
- Creative Analytics and Insights
- Other Service Types
- By End-user Industry
- Retail and E-commerce
- Media and Entertainment
- IT and Telecom
- BFSI
- Healthcare and Life Sciences
- Automotive
- Other End-user Industries
- By Geography
- North America
- United States
- Canada
- Mexico
- South America
- Brazil
- Argentina
- Chile
- Rest of South America
- Europe
- Germany
- United Kingdom
- France
- Italy
- Spain
- Rest of Europe
- Asia-Pacific
- China
- Japan
- India
- South Korea
- Australia
- Rest of Asia-Pacific
- Middle East
- Saudi Arabia
- United Arab Emirates
- Qatar
- Rest of Middle East
- Africa
- South Africa
- Egypt
- Nigeria
- Rest of Africa
- North America
Geography Analysis
North America held 41.63% in 2025. The region has mature programmatic advertising infrastructure, experienced enterprise advertisers, and a concentration of major platform and service providers in the United States. These conditions support the use of managed creative systems across social, display, connected TV, and commerce media, where teams can connect asset production with activation and measurement. The region also has a large base of advertisers who can invest in data connections, creative testing, and measurement tools that support managed implementation models. South America is an emerging region, with Brazil serving as the main growth anchor as social video and e-commerce advertising continue to develop.
Europe held the second-largest regional position, supported by adoption in Germany, the United Kingdom, and France. The AI creative optimization services market in the region is shaped by advanced programmatic systems and demand for first-party data-led creative methods that can operate with stronger consent controls. GDPR consent and data minimization rules encourage advertisers to rely more on creative quality signals when behavioral targeting is limited, which makes asset relevance and controlled testing more useful. The EU AI Act is adding content governance requirements, with provisions expected to take effect progressively through 2027, and this is encouraging structured workflows for the review and documentation of AI-supported advertising content.
Asia-Pacific is projected to grow at a 23.94% CAGR between 2026 and 2031. India and China are the main growth engines, supported by retail media, short-form video, and large digital advertising ecosystems that require frequent and localized asset adaptation. Tencent, ByteDance, Baidu, Alibaba, and Douyin/TikTok integrate AI creative tools into their advertising stacks, which increases the need for advertisers to manage activity across several platforms with different data and format requirements. Appier launched AdCreative.ai in Thailand and Vietnam during 2026, extending generative creative capabilities to Southeast Asian markets. The AI creative optimization services market can develop in the region as advertisers navigate multiple languages, platforms, levels of creative infrastructure, and mobile-first media environments that require localized execution, while the United Arab Emirates and Saudi Arabia lead adoption in the Middle East and Egypt, Nigeria, and South Africa support mobile-first demand in Africa.
- Adobe Inc.
- Smartly.io Solutions Oy
- Celtra, Inc.
- VidMob, Inc.
- Appier Group Inc.
- Bannerflow AB
- Jivox Corporation
- Persado, Inc.
- Mediaocean LLC
- Adform A/S
- Criteo S.A.
- Quantcast Corporation
- Innovid Corp.
- Hunch Ads d.o.o.
- Marpipe, Inc.
- Creatopy Inc.
- CreativeX, Inc.
- Shuttlerock Limited
Additional Benefits:
- The market estimate (ME) sheet in Excel format
- 3 months of analyst support
TABLE OF CONTENTS
1 INTRODUCTION
- 1.1 Study Assumptions and Market Definition
- 1.2 Scope of the Study
2 RESEARCH METHODOLOGY
3 EXECUTIVE SUMMARY
4 MARKET LANDSCAPE
- 4.1 Market Overview
- 4.2 Market Drivers
- 4.2.1 Expansion of Performance Marketing Budgets Toward Creative-Led Optimization
- 4.2.2 Demand for Personalized Ads Across Paid Social, Display, and CTV
- 4.2.3 Generative AI Compression of Variant Production Time and Cost
- 4.2.4 Rising Creative Fatigue and Always-On Refresh Requirements
- 4.2.5 First-Party Creative Data and Predictive Scoring Becoming Media Inputs
- 4.2.6 Retail Media Format Proliferation Raising Demand for Creative Orchestration
- 4.3 Market Restraints
- 4.3.1 Data Privacy and Signal Loss Limiting Personalization Inputs
- 4.3.2 Integration Complexity Across MarTech, AdTech, and Measurement Stacks
- 4.3.3 AI Content Disclosure and Synthetic Performer Compliance Burdens
- 4.3.4 Native Platform Automation Compressing Standalone Vendor Differentiation
- 4.4 Industry Value Chain Analysis
- 4.5 Impact of Macroeconomic Factors on the Market
- 4.6 Regulatory Landscape
- 4.7 Technological Outlook
- 4.8 Porter's Five Forces Analysis
- 4.8.1 Threat of New Entrants
- 4.8.2 Bargaining Power of Buyers
- 4.8.3 Bargaining Power of Suppliers
- 4.8.4 Threat of Substitutes
- 4.8.5 Industry Rivalry
5 MARKET SIZE AND GROWTH FORECASTS (VALUE)
- 5.1 By Service Type
- 5.1.1 Creative Strategy and Optimization Consulting Services
- 5.1.2 Managed Dynamic Creative Optimization (DCO) Services
- 5.1.3 Generative Creative Variant Development Services
- 5.1.4 Creative Analytics and Insights
- 5.1.5 Other Service Types
- 5.2 By End-user Industry
- 5.2.1 Retail and E-commerce
- 5.2.2 Media and Entertainment
- 5.2.3 IT and Telecom
- 5.2.4 BFSI
- 5.2.5 Healthcare and Life Sciences
- 5.2.6 Automotive
- 5.2.7 Other End-user Industries
- 5.3 By Geography
- 5.3.1 North America
- 5.3.1.1 United States
- 5.3.1.2 Canada
- 5.3.1.3 Mexico
- 5.3.2 South America
- 5.3.2.1 Brazil
- 5.3.2.2 Argentina
- 5.3.2.3 Chile
- 5.3.2.4 Rest of South America
- 5.3.3 Europe
- 5.3.3.1 Germany
- 5.3.3.2 United Kingdom
- 5.3.3.3 France
- 5.3.3.4 Italy
- 5.3.3.5 Spain
- 5.3.3.6 Rest of Europe
- 5.3.4 Asia-Pacific
- 5.3.4.1 China
- 5.3.4.2 Japan
- 5.3.4.3 India
- 5.3.4.4 South Korea
- 5.3.4.5 Australia
- 5.3.4.6 Rest of Asia-Pacific
- 5.3.5 Middle East
- 5.3.5.1 Saudi Arabia
- 5.3.5.2 United Arab Emirates
- 5.3.5.3 Qatar
- 5.3.5.4 Rest of Middle East
- 5.3.6 Africa
- 5.3.6.1 South Africa
- 5.3.6.2 Egypt
- 5.3.6.3 Nigeria
- 5.3.6.4 Rest of Africa
- 5.3.1 North America
6 COMPETITIVE LANDSCAPE
- 6.1 Market Concentration
- 6.2 Strategic Moves
- 6.3 Market Share Analysis
- 6.4 Company Profiles (includes Global Level Overview, Market Level Overview, Core Segments, Financials as available, Strategic Information, Market Rank/Share, Products and Services, Recent Developments)
- 6.4.1 Adobe Inc.
- 6.4.2 Smartly.io Solutions Oy
- 6.4.3 Celtra, Inc.
- 6.4.4 VidMob, Inc.
- 6.4.5 Appier Group Inc.
- 6.4.6 Bannerflow AB
- 6.4.7 Jivox Corporation
- 6.4.8 Persado, Inc.
- 6.4.9 Mediaocean LLC
- 6.4.10 Adform A/S
- 6.4.11 Criteo S.A.
- 6.4.12 Quantcast Corporation
- 6.4.13 Innovid Corp.
- 6.4.14 Hunch Ads d.o.o.
- 6.4.15 Marpipe, Inc.
- 6.4.16 Creatopy Inc.
- 6.4.17 CreativeX, Inc.
- 6.4.18 Shuttlerock Limited
7 MARKET OPPORTUNITIES AND FUTURE OUTLOOK
- 7.1 White-Space and Unmet-Need Assessment

 生成式人工智慧引擎最佳化(GEO)平台市場:按產品類型、部署類型、平台功能、技術類型、應用、最終用戶和地區分類
 創新通路情報:市場佔有率分析、產業趨勢與統計、成長預測(2026-2031)人工智慧搜尋可見性服務:市場佔有率分析、行業趨勢和統計數據、成長預測(2026-2031 年)合成媒體行銷服務:市場佔有率分析、產業趨勢與統計、成長預測(2026-2031)
 生成式引擎最佳化(GEO)平台市場:依產品類型、應用、部署類型、技術、平台功能、國家及地區分類-全球產業分析、市場規模、市場佔有率及2026年至2033年預測人工智慧搜尋最佳化軟體:市場佔有率分析、產業趨勢與統計、成長預測(2026-2031)
 內容自動化人工智慧工具市場規模、佔有率和成長分析:按工具功能、部署模式、應用領域、企業規模、銷售管道和地區分類-2026-2033年產業預測
 2026年全球銷售說明摘要工具市場報告2026年Web3.0人工智慧生成內容(AIGC)引擎全球市場報告
 設計領域的人工智慧 (AI) 市場:策略洞察與預測 (2026–2031)