


 |
市場調查報告書
商品編碼
2099305
高密度網路光纖骨幹:市場佔有率分析、產業趨勢與統計及成長預測(2026-2031 年)Fiber Backbone For Network Densification - Market Share Analysis, Industry Trends & Statistics, Growth Forecasts (2026 - 2031) |
||||||

※ 本網頁內容可能與最新版本有所差異。詳細情況請與我們聯繫。
根據 Mordor Intelligence 預測,到 2025 年,用於提高網路密度的光纖骨幹網路市場規模將達到 211.2 億美元,到 2031 年將達到 417.7 億美元,2026 年至 2031 年的複合年成長率為 11.82%。
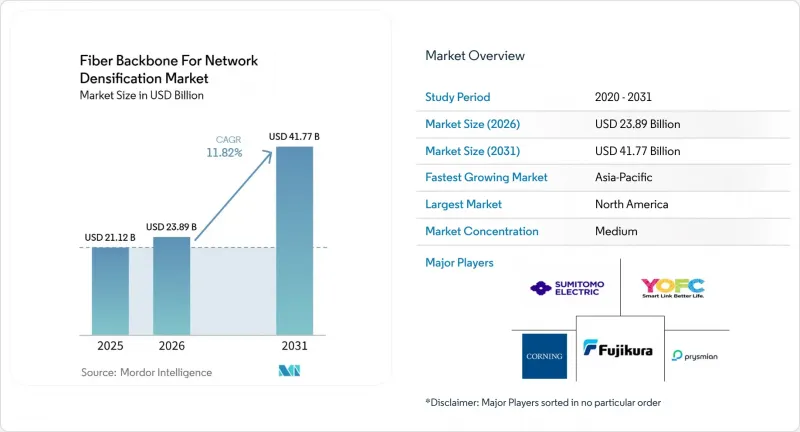
本報告按部署類型(地下、架空及其他)、光纖類型(單模和多模)、組件(光纖電纜、傳輸設備及其他)、最終用戶(通訊業者、超大規模資料中心、企業、公共部門及其他)和地區(北美、南美、亞太及其他)進行細分。市場預測以美元計價。
全球光纖骨幹網路市場網路密集化趨勢及洞察。
5G小型基地台密度更高、容量更大。
行動網路密度的不斷提升是光纖骨幹網路市場短期內最迫切的需求推動要素。獨立組網(SA)5G和雲端無線接取網路(RAN)配置需要可靠的去程傳輸和匯聚鏈路,這使得光纖在建構高密度無線都市區繼續發揮核心作用。隨著通訊業者增加小型基地台並擴展傳輸容量,網路規劃正從升級單一基地台轉向建構更廣闊的區域骨幹網路。這一點至關重要,因為隨著城市網路密度的增加,對無線叢集與核心層之間的延遲控制、路徑分集和傳輸穩定性提出了更高的要求。這也縮小了在難以放寬服務品質要求的去程傳輸環路中實際採用無線替代方案的範圍。因此,即使在人工智慧和企業流量的未來成長完全顯現之前,網路密度市場中的光纖骨幹網路建設週期也將更加穩定。
人工智慧導致交通流量增加,東西向主幹網路擁擠
人工智慧工作負載正在改變光纖骨幹網路的設計方式,以實現網路密集化,這與以往的流量成長週期截然不同。傳統網路的成長主要由使用者到伺服器的流量驅動,而人工智慧的訓練和推理則在計算叢集內部和叢集之間產生大規模向流量。這種轉變也改變了擁塞的發生位置,因為連接到主要人工智慧資料中心叢集的路由比更廣泛的國家網路更快地承受著流量負載的成長。此外,人工智慧園區需要比傳統伺服器設施更高的密度、更多的路徑冗餘和更大的光容量,從而導致每個站點的光纖需求增加。因此,超大規模資料中心業者的大規模路由訂單正變得更加長期,並且涉及更多的光纖電纜,這正在改變電纜製造的經濟性和時間表。為了實現網路密集化,光纖骨幹網路正在推動對特定走廊沿線長途和城域骨幹網路的投資,而此時網路其他部分的需求尚未恢復正常。
高昂的土木工程成本和土地徵用延誤
對於旨在提高網路密度的光纖骨幹網路而言,土木工程和授權成本是短期內最大的瓶頸。據光纖寬頻協會(Fiber Broadband Association)稱,92%的美國光纖寬頻協會(Fiber Broadband Association)稱,92%的美國光纖營運商將在2025年面臨成本上漲,其中地下鋪設成本中位數將達到每英尺18美元,架空鋪設成本中位數將達到每英尺8美元。同一項產業調查發現,88%的受訪者預計2026年成本將進一步上漲,主要原因是人事費用成本、材料成本、授權採集費用和前期準備工作。這些成本壓力十分顯著,因為骨幹網路需要大量的初步土木工程投資,才能運作任何一項創收服務。此外,土地使用許可的延誤也會對工程進度產生負面影響,因為單一路口的許可被拒就可能危及整個走廊的獲利能力。在高密度網路的光纖骨幹網路領域,這種限制導致路由運作延遲,這與其說是由於長期需求下降,不如說是由於調度和成本管理方面的考慮。
細分市場分析
2025年,地下光纖骨幹網路按部署類型分類的收入佔比達到45.98%,成為網路密集化光纖骨幹網路市場中最大的部署類型。這一主導地位反映了營運商在高密度走廊中優先考慮地下基礎設施,因為在這些區域,路由安全、資產壽命和較低的長期維護成本比初始建設成本更為重要。由於5G去程傳輸和資料中心連接流量對路由不穩定性接受度較低,地下安裝仍是城域環路和主要城際骨幹網路路段的首選。預計2026年至2031年,海底和城際光纖骨幹網路的複合年成長率將達到12.87%,顯示長距離路由建設正在加速推進,推動網路複雜性提升和市場擴張,同時也與城域光纖骨幹網路的互補性相輔相成。
此外,隨著許多新的人工智慧設施選址於電力資源豐富的待開發區,而這些綠地又不在現有光纖鋪設權的覆蓋範圍內,網路配置正在改變。這種選址方式催生了連接新運算中心與現有交換點和雲端區域的城際線路的新需求。 Lumen公司連接西雅圖和明尼阿波利斯的「NorthLine」線路便清晰地展現了這一趨勢。該線路圍繞著美國北部新興的資料中心走廊而設計,預計於2026年底投入使用。同時,微型溝槽施工在都市區地下工程的重要性日益凸顯。這是因為微型溝槽施工能夠減少對都市區道路施工的干擾,並縮短部署時間。城際線路新需求與更快捷的都市區安裝方式結合,正在拓展光纖骨幹網路部署工程在高密度網路中的作用。這也意味著線路設計正變得更加區域化,地下鋪設在核心走廊中佔據主導地位,而新建的長途線路也迎來了新的機會。
預計到2025年,單模光纖的銷售額將占到89.96%,繼續保持其在網路密集化光纖骨幹網路市場的主導地位。這一主導地位反映了骨幹網路、城域環網和5G去程傳輸網路需要更長的傳輸距離以及與連貫光纖通訊的兼容性,而單模光纖仍然是這些應用的標準選擇。雖然ITU-T G.652.D等標準仍然是主流骨幹網路部署的基礎,但G.654.E在需要低衰減長距離傳輸的高容量長距離和海底通訊應用中正變得越來越重要。此外,中國正在推進骨幹網路升級,向400 Gbps和800 Gbps網路能力邁進,這支持了對高效能單模光纖基礎設施的持續採購,以用於高密度傳輸層。預計到 2031 年,多模光纖的複合年成長率將達到 9.99%,但其成長將集中在短距離的校園內和資料中心間連接應用,而不是核心傳輸。
單模光纖正透過更高密度的光纜設計獲得競爭優勢。 2025年10月,Prizemian推出了BendBrightXS 160µm單模光纖,無需新的土木工程即可在每根光纜或管道中容納更多光纖。這種設計在管道空間日益緊張的都市區和校園環境中尤其重要。隨著光纜密度的增加,單模解決方案可以應用於以往因實體佈局限制而依賴多模光纖的應用場景。在高密度網路的光纖骨幹網路市場,儘管短距離應用不斷擴展,但這一趨勢阻止了光纖類型總體構成比的快速變化。這也印證了這樣一種觀點:容量密度(而不僅僅是傳輸距離)才是整個高密度網路產業光纖骨幹網路採購決策的驅動力。
區域分析
2025年,北美將佔全球光纖骨幹網路銷售額的33.12%,在網路密集化光纖骨幹網路市場佔據最大市場佔有率。該地區正經歷5G網路的快速部署,同時對超大規模人工智慧基礎設施和公共寬頻支援的大規模投資,使得城域網路和長途連接的需求持續旺盛。美國仍然是主要驅動力,超大規模資料中心業者正以前所未有的速度擴展運算能力和互連容量,從而加速光纖的採購、建置和傳輸系統升級。隨著對可靠電力供應和穩定運行環境的需求推動資料中心投資,加拿大的重要性也日益提升,這使得骨幹網路需求擴展到美國主要樞紐區域之外。
預計亞太地區在2026年至2031年間將以13.87%的複合年成長率成長,成為網路密度市場中光骨幹領域成長最快的區域。中國正透過骨幹網路現代化計畫推動該地區的成長,這些計劃強調高容量光纖傳輸和增強主要計算中心之間的連接。日本也採取了類似的策略,KDDI於2026年6月推出了商用解耦式骨幹路由器,Softbank Corporation的目標是在2027年前部署覆蓋全國的全光都會區網路。 NTT和NTT東日本也在展示用於全光電網路的高速光波長路徑交換技術,以支援該地區在人工智慧時代實現更敏捷的傳輸。印度和韓國正透過5G的持續擴展和日益成長的資料中心間連接需求獲得進一步的成長動力,確保亞太地區保持廣泛的市場基礎,而不是集中在單一的國內市場。
歐洲仍然是一個具有重要戰略意義的地區,監管和政策支持有助於在私營部門盈利能力面臨壓力的情況下維持骨幹網投資。該地區在數位連接方面仍面臨挑戰,需要在成員國範圍內對Gigabit基礎設施進行大規模投資,以支援線路的持續擴展和現代化。英國、德國、法國和義大利仍然是關鍵的部署市場,而中歐和東歐在低滲透率地區仍有獲利能力空間,尤其是在待開發區線路投資方面。中東和非洲的貢獻相對較小,沙烏地阿拉伯、阿拉伯聯合大公國、埃及和南非透過國家寬頻計畫和都市區連接計畫來支持骨幹網路需求。在南美洲,雖然隨著超大規模和互聯互通活動的活性化,巴西的成長較為集中,但全部區域發展仍然更具選擇性,主要由基於走廊的部署所驅動。
其他好處:
- Excel格式的市場預測(ME)表
- 3個月的分析師支持
目錄
第1章:引言
- 研究假設和市場定義
- 調查範圍
第2章:調查方法
第3章執行摘要
第4章 市場狀況
- 市場概覽
- 市場促進因素
- 5G小型基地台密度更高、容量更大。
- 擴展超大規模資料中心和邊緣資料中心之間的互連
- 利用開放式無線存取網(Open RAN)和雲端無線存取網(Cloud-RAN)升級傳輸網路
- 政府光纖網路計劃和公共資金
- 共享光纖線路、微型溝槽施工和公用設施走廊設計的創新
- 人工智慧導致交通流量增加,東西骨幹網路擁擠
- 市場限制因素
- 高昂的土木工程成本和土地徵用延誤
- 人口密集都市區管線和電線杆供不應求。
- 光纖線路的安全、破壞和蓄意破壞風險
- 區域城市投資復甦期延長與租金壓力
- 供應鏈分析
- 監理情勢
- 技術展望
- 波特五力分析
- 價格分析
第5章 市場規模與成長預測
- 依部署類型
- 地下光纖骨幹網
- 空中光纖骨幹網
- 海底及城際光纖骨幹網
- 纖維類型
- 單模光纖
- 多模光纖
- 按組件
- 光纖電纜
- 光纖傳輸設備
- 被動元件
- 其他規則
- 最終用戶
- 通訊業者
- 雲端和超大規模資料中心營運商
- 企業及專用網路營運商
- 公共部門和公共產業
- 其他最終用戶
- 按地區
- 北美洲
- 美國
- 加拿大
- 墨西哥
- 南美洲
- 巴西
- 阿根廷
- 其他南美國家
- 歐洲
- 英國
- 德國
- 法國
- 義大利
- 其他歐洲國家
- 亞太地區
- 中國
- 日本
- 印度
- 韓國
- 其他亞太國家
- 中東和非洲
- 中東
- 沙烏地阿拉伯
- 阿拉伯聯合大公國
- 其他中東國家
- 非洲
- 南非
- 埃及
- 其他非洲國家
- 中東
- 北美洲
第6章 競爭情勢
- 市場集中度
- 策略趨勢
- 市佔率分析
- 公司簡介
- Corning Incorporated
- Prysmian SpA
- Nexans
- Fujikura Ltd.
- Sumitomo Electric Industries, Ltd.
- Furukawa Electric Co., Ltd.
- Sterlite Technologies Limited
- Hengtong Optic-Electric Co., Ltd.
- YOFC(Yangtze Optical Fibre and Cable Joint Stock Limited Company)
- AFL
- LS Cable and System Ltd.
- Adtran Holdings, Inc.
- Nokia Corporation
- Ciena Corporation
- ZTE Corporation
- Huawei Technologies Co., Ltd.
- FiberHome Telecommunication Technologies Co., Ltd.
- Infinera Corporation
第7章 市場機會與未來展望
According to Mordor Intelligence, the fiber backbone for network densification market size was USD 21.12 billion in 2025 and is forecast to reach USD 41.77 billion by 2031, growing at a CAGR of 11.82% over 2026-2031.
This report is Segmented by Deployment Type (Underground, Aerial, and More), Fiber Type (Single-Mode and Multi-Mode), Component (Optical Fiber Cable, Transmission Equipment, and More), End User (Telecom Operators, Hyperscale, Enterprises, Public Sector, and More), and Geography (North America, South America, Asia-Pacific, and More). The Market Forecasts are Provided in Terms of Value (USD).
Global Fiber Backbone For Network Densification Market Trends and Insights
5G Small Cell Densification and Capacity Expansion
Mobile network densification is the most immediate near-term demand lever for the fiber backbone market. Standalone 5G and cloud-RAN layouts require highly reliable fronthaul and aggregation links, which keep fiber at the center of dense radio site buildouts. As operators add more small cells and raise transport capacity, network planning is moving from isolated site upgrades toward broader regional backbone commitments. That matters because denser urban footprints need tighter latency control, higher route diversity, and more stable transport between radio clusters and core layers. It also reduces the practical room for wireless substitutes in fronthaul rings, where service-quality requirements are harder to relax. The result is a steadier build cycle for the fiber backbone for the network densification market, even before later AI and enterprise traffic gains become fully visible.
AI-Driven Traffic Growth and East-West Backbone Congestion
AI workloads are reshaping the fiber backbone for the network densification market in ways that differ from earlier traffic growth cycles. Traditional internet growth was driven mainly by user-to-server traffic, whereas AI training and inference generate large east-west flows within and across compute clusters. That shift changes where congestion appears, because routes connected to major AI data center hubs are seeing traffic strain earlier than broad national networks. It also raises the fiber requirement per site, since AI campuses need greater density, more route redundancy, and more optical headroom than legacy server facilities. Large route orders from hyperscalers are therefore becoming longer in duration and larger in fiber count, which is changing cable manufacturing economics and procurement timing. In the fiber backbone for network densification market, this is driving long-haul and metro backbone investment along selected corridors before demand normalizes across the rest of the network.
High Civil Works Cost and Right-Of-Way Delays
Civil works and permitting costs are the largest near-term drag on the fiber backbone for the network densification market. The Fiber Broadband Association reported that 92% of US fiber deployers faced cost increases in 2025, while median underground deployment costs reached USD 18.00 per foot and aerial deployment costs reached USD 8.00 per foot. The same industry feedback showed that 88% of respondents expected further cost increases in 2026, with labor, materials, permitting, and make-ready work remaining the main drivers. These pressures matter because backbone routes require high up-front civil spending before a single revenue-generating service goes live. Delays in right-of-way approvals also weaken project sequencing, since a single blocked crossing can disrupt the economics of an entire corridor. In the fiber backbone for network densification market, this restraint is slowing route activation more through timing and cost discipline than through any drop in long-term demand.
Other drivers and restraints analyzed in the detailed report include:
- Hyperscale and Edge Data Center Interconnect Expansion
- Government Fiberization Programs and Public Funding
- Limited Duct and Pole Availability in Dense Urban Corridors
For complete list of drivers and restraints, kindly check the Table Of Contents.
Segment Analysis
Underground fiber backbone accounted for 45.98% of deployment-type revenue in 2025, making it the largest deployment format in the fiber backbone for network densification market share. That lead reflects the operator's preference for buried infrastructure in high-density corridors, where route security, asset life, and lower long-term maintenance costs carry more weight than initial build cost. Metro rings and major intercity backbone sections also continue to favor underground placement because 5G fronthaul and data center interconnect traffic leave less tolerance for route instability. Aerial routes remain relevant where speed and lower up-front cost matter most, but they face more timeline risk in dense zones because access and permitting can delay installation. The submarine and intercity fiber backbone is projected to grow at a 12.87% CAGR from 2026 to 2031, indicating that long-haul route creation is gaining momentum alongside metro infill in the fiber backbone, driving network densification and market size.
The mix is also changing because many new AI facilities are being placed in power-rich greenfield locations outside legacy fiber rights-of-way. That placement is creating fresh demand for intercity segments that connect new compute locations to existing exchange points and cloud regions. Lumen's NorthLine route between Seattle and Minneapolis clearly shows this pattern, as it was designed around emerging northern US data center corridors and is expected to be available by the end of 2026. At the same time, micro-trenching is becoming increasingly important in metropolitan infill because it reduces disruption and shortens deployment time on sealed urban surfaces. This combination of new intercity demand and faster urban installation methods is broadening the role of deployment engineering in the fiber backbone for the network densification market. It also means route design is becoming more location-specific, with underground strength in core corridors and rising opportunities across newly connected long-haul paths.
Single-mode fiber accounted for 89.96% of revenue in 2025, keeping it firmly dominant in the fiber backbone for network densification market size. Its lead reflects the fact that backbone, metro ring, and 5G fronthaul networks depend on longer reach and coherent optical compatibility, where single-mode remains the standard choice. Standard references such as ITU-T G. 652. D still anchors mainstream backbone deployment, while G. 654. E is gaining relevance in higher-capacity long-haul and submarine applications that need lower attenuation over longer distances. China is also pushing backbone upgrades toward 400 Gbps and 800 Gbps network capabilities, supporting continued procurement of high-performance single-mode infrastructure for dense transport layers. Multi-mode fiber is still projected to grow at a 9.99% CAGR through 2031, but that growth remains centered on short-reach campus and data center interconnect use rather than core transport.
Single-mode fiber is also extending its competitive reach through denser cable design. Prysmian launched BendBrightXS 160µm single-mode fiber in October 2025, enabling more fibers per cable and per duct without requiring new civil works. That kind of design matters because duct space is becoming a strategic constraint in urban and campus environments. As cable density improves, single-mode solutions can enter use cases that once relied more on multi-mode due to physical packing constraints. In the fiber backbone for network densification market, this keeps the overall fiber type mix from shifting quickly, even as short-reach applications grow. It also reinforces the view that capacity density, not only transmission reach, is shaping procurement decisions across the broader fiber backbone for the network densification industry.
Complete Report Scope:
- By Deployment Type
- Underground Fiber Backbone
- Aerial Fiber Backbone
- Submarine and Intercity Fiber Backbone
- By Fiber Type
- Single-Mode Fiber
- Multi-Mode Fiber
- By Component
- Optical Fiber Cable
- Optical Transmission Equipment
- Passive Components
- Other Components
- By End User
- Telecom Operators
- Cloud and Hyperscale Data Center Operators
- Enterprises and Private Network Operators
- Public Sector and Utilities
- Other End-users
- By Geography
- North America
- United States
- Canada
- Mexico
- South America
- Brazil
- Argentina
- Rest of South America
- Europe
- United Kingdom
- Germany
- France
- Italy
- Rest of Europe
- Asia-Pacific
- China
- Japan
- India
- South Korea
- Rest of Asia-Pacific
- Middle East and Africa
- Middle East
- Saudi Arabia
- United Arab Emirates
- Rest of Middle East
- Africa
- South Africa
- Egypt
- Rest of Africa
- Middle East
- North America
Geography Analysis
North America accounted for 33.12% of revenue in 2025, giving the region the largest market share in the fiber backbone for network densification market. The region combines active 5G densification, large hyperscale AI infrastructure spending, and public broadband support, which keeps both metro and long-haul route demand elevated. The United States remains the core driver because hyperscalers are expanding compute and interconnect capacity at a scale that pulls forward fiber procurement, construction, and transport upgrades. Canada is also becoming more relevant as data center investment follows power availability and stable operating conditions, which extends backbone demand beyond the main US hubs.
Asia-Pacific is projected to expand at a 13.87% CAGR from 2026 to 2031, making it the fastest-growing regional block in the fiber backbone for network densification market. China is pushing the region through backbone modernization plans that emphasize higher-capacity optical transport and stronger links between major computing hubs. Japan is advancing on a parallel path, with KDDI launching commercial disaggregated backbone routers in June 2026 and SoftBank pursuing nationwide all-optical metro deployment by 2027. NTT and NTT East also demonstrated rapid optical wavelength-path switching for all-photonics networking, which supports the region's push toward more agile AI-era transport. India and South Korea add incremental momentum through continued 5G expansion and rising data center interconnect needs, keeping Asia-Pacific broadly based rather than concentrated in a single national market.
Europe remains strategically important because regulatory and policy support are helping sustain backbone investment even when private operator returns are under pressure. The region's digital connectivity agenda still points to a major investment requirement for gigabit-capable infrastructure across member states, which supports continued route expansion and modernization. The United Kingdom, Germany, France, and Italy remain the main deployment markets, while Central and Eastern Europe still offer room for greenfield-style route economics in underpenetrated areas. The Middle East and Africa are smaller contributors, but national broadband plans and urban connectivity programs are supporting backbone demand in Saudi Arabia, the UAE, Egypt, and South Africa. South America is seeing focused growth in Brazil as hyperscale and interconnection activity rise, while wider regional development remains more selective and corridor-based.
- Corning Incorporated
- Prysmian S.p.A.
- Nexans
- Fujikura Ltd.
- Sumitomo Electric Industries, Ltd.
- Furukawa Electric Co., Ltd.
- Sterlite Technologies Limited
- Hengtong Optic-Electric Co., Ltd.
- YOFC (Yangtze Optical Fibre and Cable Joint Stock Limited Company)
- AFL
- LS Cable and System Ltd.
- Adtran Holdings, Inc.
- Nokia Corporation
- Ciena Corporation
- ZTE Corporation
- Huawei Technologies Co., Ltd.
- FiberHome Telecommunication Technologies Co., Ltd.
- Infinera Corporation
Additional Benefits:
- The market estimate (ME) sheet in Excel format
- 3 months of analyst support
TABLE OF CONTENTS
1 INTRODUCTION
- 1.1 Study Assumptions and Market Definition
- 1.2 Scope of the Study
2 RESEARCH METHODOLOGY
3 EXECUTIVE SUMMARY
4 MARKET LANDSCAPE
- 4.1 Market Overview
- 4.2 Market Drivers
- 4.2.1 5G Small Cell Densification and Capacity Expansion
- 4.2.2 Hyperscale and Edge Data Center Interconnect Expansion
- 4.2.3 Open RAN and Cloud-RAN Transport Upgrades
- 4.2.4 Government Fiberization Programs and Public Funding
- 4.2.5 Fiber Route Sharing, Micro-Trenching, and Utility Corridor Design Innovations
- 4.2.6 AI-Driven Traffic Growth and East-West Backbone Congestion
- 4.3 Market Restraints
- 4.3.1 High Civil Works Cost and Right-of-Way Delays
- 4.3.2 Limited Duct and Pole Availability in Dense Urban Corridors
- 4.3.3 Fiber Route Security, Vandalism, and Sabotage Risk
- 4.3.4 Long Payback Periods and Lease Rate Pressure in Secondary Cities
- 4.4 Supply Chain Analysis
- 4.5 Regulatory Landscape
- 4.6 Technological Outlook
- 4.7 Porter's Five Forces Analysis
- 4.7.1 Bargaining Power of Suppliers
- 4.7.2 Bargaining Power of Buyers
- 4.7.3 Threat of New Entrants
- 4.7.4 Threat of Substitutes
- 4.7.5 Industry Rivalry
- 4.8 Pricing Analysis
5 MARKET SIZE AND GROWTH FORECASTS (VALUE)
- 5.1 By Deployment Type
- 5.1.1 Underground Fiber Backbone
- 5.1.2 Aerial Fiber Backbone
- 5.1.3 Submarine and Intercity Fiber Backbone
- 5.2 By Fiber Type
- 5.2.1 Single-Mode Fiber
- 5.2.2 Multi-Mode Fiber
- 5.3 By Component
- 5.3.1 Optical Fiber Cable
- 5.3.2 Optical Transmission Equipment
- 5.3.3 Passive Components
- 5.3.4 Other Components
- 5.4 By End User
- 5.4.1 Telecom Operators
- 5.4.2 Cloud and Hyperscale Data Center Operators
- 5.4.3 Enterprises and Private Network Operators
- 5.4.4 Public Sector and Utilities
- 5.4.5 Other End-users
- 5.5 By Geography
- 5.5.1 North America
- 5.5.1.1 United States
- 5.5.1.2 Canada
- 5.5.1.3 Mexico
- 5.5.2 South America
- 5.5.2.1 Brazil
- 5.5.2.2 Argentina
- 5.5.2.3 Rest of South America
- 5.5.3 Europe
- 5.5.3.1 United Kingdom
- 5.5.3.2 Germany
- 5.5.3.3 France
- 5.5.3.4 Italy
- 5.5.3.5 Rest of Europe
- 5.5.4 Asia-Pacific
- 5.5.4.1 China
- 5.5.4.2 Japan
- 5.5.4.3 India
- 5.5.4.4 South Korea
- 5.5.4.5 Rest of Asia-Pacific
- 5.5.5 Middle East and Africa
- 5.5.5.1 Middle East
- 5.5.5.1.1 Saudi Arabia
- 5.5.5.1.2 United Arab Emirates
- 5.5.5.1.3 Rest of Middle East
- 5.5.5.2 Africa
- 5.5.5.2.1 South Africa
- 5.5.5.2.2 Egypt
- 5.5.5.2.3 Rest of Africa
- 5.5.5.1 Middle East
- 5.5.1 North America
6 COMPETITIVE LANDSCAPE
- 6.1 Market Concentration
- 6.2 Strategic Moves
- 6.3 Market Share Analysis
- 6.4 Company Profiles (includes Global Level Overview, Market Level Overview, Core Segments, Financials as available, Strategic Information, Market Rank/Share, Products and Services, Recent Developments)
- 6.4.1 Corning Incorporated
- 6.4.2 Prysmian S.p.A.
- 6.4.3 Nexans
- 6.4.4 Fujikura Ltd.
- 6.4.5 Sumitomo Electric Industries, Ltd.
- 6.4.6 Furukawa Electric Co., Ltd.
- 6.4.7 Sterlite Technologies Limited
- 6.4.8 Hengtong Optic-Electric Co., Ltd.
- 6.4.9 YOFC (Yangtze Optical Fibre and Cable Joint Stock Limited Company)
- 6.4.10 AFL
- 6.4.11 LS Cable and System Ltd.
- 6.4.12 Adtran Holdings, Inc.
- 6.4.13 Nokia Corporation
- 6.4.14 Ciena Corporation
- 6.4.15 ZTE Corporation
- 6.4.16 Huawei Technologies Co., Ltd.
- 6.4.17 FiberHome Telecommunication Technologies Co., Ltd.
- 6.4.18 Infinera Corporation
7 MARKET OPPORTUNITIES AND FUTURE OUTLOOK
- 7.1 White-Space and Unmet-Need Assessment
- 7.2 Infrastructure Sharing and Open-Access Backbone Opportunities
- 7.3 Edge Transport for AI-Ready Networks
- 7.4 Resilience and Route Diversity Investment Themes

 光纖冷鍵合市場規模、佔有率及成長分析:按鍵合類型、光纖類型、應用、最終用戶、安裝方法和地區分類-2026-2033年產業預測
 光纖市場規模、佔有率和成長分析:按光纖類型、產品類型、應用、安裝、最終用戶和地區分類-2026-2033年產業預測
 光纖測試市場-2026-2032年全球市場預測
 國防和戰場通訊網路光纖:市場佔有率分析、產業趨勢和統計數據以及成長預測(2026-2031 年)中空芯光纖骨幹網路:市場佔有率分析、產業趨勢與統計及成長預測(2026-2031)主權光纖骨幹基礎設施:市場佔有率分析、產業趨勢與統計及成長預測(2026-2031 年)
 軍工和航太光纖市場報告:趨勢、預測和競爭分析(至2035年)
 光纖板市場:按類型、應用和地區分類
 光纖檢測設備市場:按產品類型、最終用戶和地區分類(2026-2034 年)光纖行動連接器市場報告:趨勢、預測和競爭分析(至2035年)