


 |
市場調查報告書
商品編碼
2073594
美國特種肥料:市場佔有率分析、行業趨勢和統計數據、成長預測(2026-2031 年)United States Specialty Fertilizer - Market Share Analysis, Industry Trends & Statistics, Growth Forecasts (2026 - 2031) |
||||||

※ 本網頁內容可能與最新版本有所差異。詳細情況請與我們聯繫。
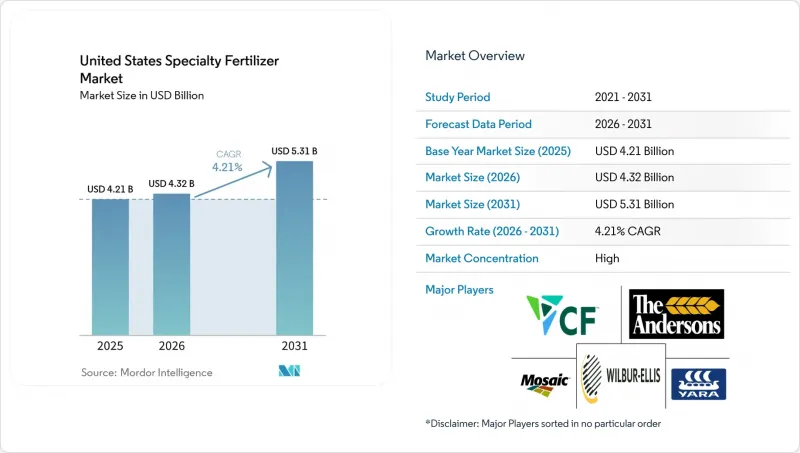
根據 Mordor Intelligence 預測,美國特殊肥料市場規模將從 2025 年的 42.1 億美元成長到 2026 年的 43.2 億美元,然後在 2031 年達到 53.1 億美元,2026 年至 2031 年的複合年成長率為 4.21%。
本報告依特殊肥料種類(控釋肥、液體肥料等)、施用方法(灌溉施肥、葉面噴布等)及作物類型(田間作物、園藝作物等)進行分類。市場預測以價值(美元)和數量(公噸)兩種單位呈現。
美國特種肥料市場的趨勢與洞察
精密農業的引進正在加速對高效投入材料的需求。
到2024年,主要州的75%的玉米和大豆面積已採用GPS定位的可變施肥系統,從而促進了能夠同步養分釋放與作物吸收的肥料的推廣應用。種植者能夠在不降低產量的情況下減少10%至15%的施肥量,抵銷了特種肥料較高的成本。系統基於田間感測器資料、NDVI影像和土壤電導率測繪資料產生即時施肥方案,並建議穩定處理、聚合物包膜和抑制劑增強配方。人工智慧(AI)驅動的決策工具與可程式釋放顆粒結合,可在90天內逐步調整養分釋放量。這些技術的結合,滿足了高價值農地對特殊肥料等高品質投入品的長期需求。
關於營養物質徑流的環境法規建議使用緩釋和水溶性產品。
美國環保署 (EPA) 在切薩皮克灣和其他水質惡化令人擔憂的流域推行的「總最大日負荷量 (TMDL)」計劃,要求到 2025 年將氮排放減少 25%。為了遵守這項規定,生產商被迫轉向使用能夠將養分保留在土壤中的產品,例如聚合物包膜尿素和雙抑制劑肥料。一些中西部州正在擴大自願成本分攤獎勵,並透過水權交易計劃,使農民能夠將使用高效肥料所實現的養分減排轉化為收益。這一趨勢有利於那些能夠利用第三方機構的數據證明其產品減少了養分損失的供應商。
與通用肥料相比的價格差異
由於特種肥料比散裝NPK肥料貴20%至40%,當玉米價格跌破每蒲式耳4.50美元、大豆價格跌破12美元時,種植者往往會延後使用特種肥料。通用作物生產系統的利潤率平均只有5%至10%,因此種植者對投入成本仍然非常敏感。區域運費進一步加劇了價格差異,偏遠地區的溢價甚至高達50%。然而,一些區域性肥料混合商推出了一系列通用緩效肥料,在物流條件良好的地區,這些混合肥料的溢價已降至15%左右。儘管如此,品牌供應商仍透過提供優質的農業服務和技術支援來保持競爭優勢。
細分市場分析
到2025年,液態肥料將佔據美國特種肥料市場38.7%的最大佔有率。種植者青睞液態肥料,用於生長季的氮肥追肥和快速補充微量元素。此外,水溶性肥料在施肥、灌溉和可控環境系統中繼續發揮重要作用,因為這些系統對快速溶解和精準施用要求很高。緩釋型有機和無機混合肥料在草坪管理中也仍然非常重要,它們能夠長期穩定地提供養分,從而減輕草坪的維護負擔。
預計到2031年,緩釋肥料的年複合成長率(CAGR)6.8%,成為成長最快的特殊肥料類型。這項成長主要得益於徑流法規的推動,這些法規促進了能夠將養分供應期延長90至120天的技術的應用。生產商正擴大將多種釋放機制融入單一顆粒肥料中,從而在生長季初期釋放水溶性氮,隨後根據溫度釋放其他養分。包膜技術的進步,以及田間試驗所證實的農藝和經濟效益,正進一步擴大緩釋肥料在美國特種肥料市場的應用。
其他好處:
- Excel格式的市場預測(ME)表
- 3個月的分析師支持
目錄
第1章:引言
- 研究假設和市場定義
- 調查範圍
- 調查方法
第2章:執行摘要和主要發現
第3章:本報告的內容
第4章:主要產業趨勢
- 主要農作物種植面積
- 大田作物
- 園藝作物
- 平均施肥量
- 微量營養素
- 田間作物
- 園藝作物
- 主要營養素
- 田間作物
- 園藝作物
- 次要營養元素
- 田間作物
- 園藝作物
- 微量營養素
- 配備灌溉設施的農田
- 法律規範
- 價值鍊和通路分析
- 市場促進因素
- 精密農業的引進正在加速對高效投入材料的需求。
- 關於營養物質徑流的環境法規使得緩釋和水溶性產品具有優勢。
- 微灌技術的推廣應用正在推動化肥需求的成長。
- 草坪和觀賞植物的蓬勃發展帶動了對專業應用的需求。
- 食品零售商的碳評分系統評估並鼓勵能夠最大限度減少氮流失的技術。
- 滴灌、化學能獲取 (CEA) 和垂直農業需要水溶性且極為純淨的營養素。
- 市場限制因素
- 與通用肥料相比的價格差異
- 氨和天然氣的價格波動
- 禁止在聚合物塗料中使用微塑膠的趨勢
- 加拿大鉀肥關稅風險推高了鉀肥特種產品的價格。
第5章 市場規模與成長預測
- 產品類型
- CRF
- 聚合物塗層
- 聚合物硫塗層
- 其他
- 液體肥料
- SRF
- 水溶性
- CRF
- 使用方法
- 施肥和灌溉
- 葉面噴布
- 土壤
- 作物類型
- 田間作物
- 園藝作物
- 草坪和觀賞植物
第6章 競爭情勢
- 關鍵策略趨勢
- 市佔率分析
- 企業狀況
- 公司簡介
- Nutrien Ltd.
- The Mosaic Company
- CF Industries Holdings Inc.
- Koch Fertilizer LLC(Koch Industries Inc.)
- Yara International ASA
- ICL Group Ltd.
- Haifa Chemicals Ltd.(Trance-Chem Ltd.)
- Sociedad Qumica y Minera de Chile SA
- Wilbur-Ellis Company LLC
- The Andersons Inc.
- JR Simplot Company
- Helena Agri-Enterprises LLC(Marubeni Corporation)
- The Scotts Miracle-Gro Company
- COMPO EXPERT GmbH(Grupa Azoty SA)
- Agro-Culture Liquid Fertilizers, Inc.
第7章 化肥產業執行長面臨的關鍵策略挑戰
According to Mordor Intelligence, the united states specialty fertilizer market size is projected to grow from USD 4.21 billion in 2025 to USD 4.32 billion in 2026 and is forecast to reach USD 5.31 billion by 2031 at 4.21% CAGR over 2026-2031.
This report is Segmented by Specialty Type (CRF, Liquid Fertilizer, and More), Application Mode (Fertigation, Foliar, and More), and Crop Type (Field Crops, Horticultural Crops, and More). The Market Forecasts are Provided in Terms of Value (USD) and Volume (Metric Tons).
United States Specialty Fertilizer Market Trends and Insights
Precision Agriculture Adoption Accelerates Demand for High-Efficiency Inputs
Seventy-five percent of corn and soybean acres in leading states used GPS-enabled variable-rate systems in 2024, opening the door for fertilizers that synchronize nutrient release with crop uptake. Growers see 10-15% reductions in application rates without yield loss, which offsets specialty fertilizer premiums. Field sensors, NDVI imagery, and soil conductivity mapping feed real-time prescriptions that lean toward stabilized, polymer-coated, and inhibitor-enhanced formulations. Artificial-intelligence decision tools are now pairing with programmable-release granules able to stagger nutrient availability across a 90-day window. Together, these technologies anchor long-term demand for premium inputs such as specialty fertilizers on high-value acres .
Environmental Rules on Nutrient Runoff Favor Controlled-Release and Soluble Products
Environmental Protection Agency (EPA) total Maximum Daily Load programs in the Chesapeake Bay and other impaired watersheds require a 25% nitrogen reduction by 2025. Compliance pushes growers to products that keep nutrients in the soil profile, such as polymer-coated urea and dual-inhibitor blends. Several Midwest states have expanded voluntary cost-share incentives, while water-quality credit trading programs allow farmers to monetize nutrient savings achieved through the use of enhanced-efficiency fertilizers. The trend favors suppliers able to validate loss reductions with third-party data.
Price Premium Versus Commodity Fertilizers
Specialty fertilizer grades cost 20%-40% more than bulk NPK, leading growers to delay adoption when crop prices fall below USD 4.50 per bushel for corn and USD 12.00 per bushel for soybeans. With margins in commodity systems averaging only 5%-10%, producers remain highly sensitive to input costs. Regional freight charges further widen the price gap, pushing premiums to as high as 50% in remote areas. However, regional blenders introducing generic controlled-release lines have reduced premiums to around 15% where logistics are favorable, though branded suppliers continue to differentiate through superior agronomic service and technical support.
Other drivers and restraints analyzed in the detailed report include:
- Turf and Ornamental Boom Drives Specialty Usage
- Drip, CEA and Vertical-Farm Buildout Needs Soluble, Ultra-Clean Nutrition
- Pending Microplastic Bans on Polymer Coatings
For complete list of drivers and restraints, kindly check the Table Of Contents.
Segment Analysis
Liquid fertilizers held the largest United States specialty fertilizer market share at 38.7% in 2025. These fertilizers are preferred by growers for in-season nitrogen top-dress applications and rapid micronutrient correction. Additionally, water-soluble fertilizers maintain a significant role in fertigation and controlled-environment systems, where their fast dissolution and precise dosing capabilities are essential. Slow-release organo-mineral blends also remain important in turf care, as their extended nutrient availability helps reduce maintenance needs.
Controlled-release fertilizers are anticipated to be the fastest-growing specialty fertilizer type, with a projected CAGR of 6.8% through 2031. This growth is driven by runoff regulations that promote nutrient-delivery technologies capable of extending nutrient availability for 90-120 days. Manufacturers are increasingly incorporating multiple release mechanisms within single granules, enabling early-season soluble nitrogen release followed by temperature-responsive nutrient delivery. Advances in coating technologies, coupled with field trials demonstrating both agronomic and economic benefits, are fostering wider adoption of controlled-release fertilizers across the United States specialty fertilizer market.
Complete Report Scope:
- Speciality Type
- CRF
- Polymer Coated
- Polymer-Sulfur Coated
- Others
- Liquid Fertilizer
- SRF
- Water Soluble
- CRF
- Application Mode
- Fertigation
- Foliar
- Soil
- Crop Type
- Field Crops
- Horticultural Crops
- Turf & Ornamental
List of Companies Covered in this Report:
- Nutrien Ltd.
- The Mosaic Company
- CF Industries Holdings Inc.
- Koch Fertilizer LLC (Koch Industries Inc.)
- Yara International ASA
- ICL Group Ltd.
- Haifa Chemicals Ltd. (Trance-Chem Ltd.)
- Sociedad Qumica y Minera de Chile S.A.
- Wilbur-Ellis Company LLC
- The Andersons Inc.
- J.R. Simplot Company
- Helena Agri-Enterprises LLC (Marubeni Corporation)
- The Scotts Miracle-Gro Company
- COMPO EXPERT GmbH (Grupa Azoty S.A.)
- Agro-Culture Liquid Fertilizers, Inc.
Additional Benefits:
- The market estimate (ME) sheet in Excel format
- 3 months of analyst support
TABLE OF CONTENTS
1 INTRODUCTION
- 1.1 Study Assumptions & Market Definition
- 1.2 Scope of the Study
- 1.3 Research Methodology
2 EXECUTIVE SUMMARY & KEY FINDINGS
3 REPORT OFFERS
4 KEY INDUSTRY TRENDS
- 4.1 Acreage Of Major Crop Types
- 4.1.1 Field Crops
- 4.1.2 Horticultural Crops
- 4.2 Average Nutrient Application Rates
- 4.2.1 Micronutrients
- 4.2.1.1 Field Crops
- 4.2.1.2 Horticultural Crops
- 4.2.2 Primary Nutrients
- 4.2.2.1 Field Crops
- 4.2.2.2 Horticultural Crops
- 4.2.3 Secondary Macronutrients
- 4.2.3.1 Field Crops
- 4.2.3.2 Horticultural Crops
- 4.2.1 Micronutrients
- 4.3 Agricultural Land Equipped For Irrigation
- 4.4 Regulatory Framework
- 4.5 Value Chain & Distribution Channel Analysis
- 4.6 Market Drivers
- 4.6.1 Precision-ag adoption accelerates demand for high-efficiency inputs
- 4.6.2 Environmental rules on nutrient runoff favor controlled-release and soluble products
- 4.6.3 Micro-irrigation expansion boosts fertigation-grade fertilizers
- 4.6.4 Turf-and-ornamental boom drives specialty usage
- 4.6.5 Food-retailer carbon scoring rewards low-loss nitrogen technologies
- 4.6.6 Drip, CEA/vertical-farm build-out needs soluble, ultra-clean nutrition
- 4.7 Market Restraints
- 4.7.1 Price premium versus commodity fertilizers
- 4.7.2 Ammonia and natural-gas price volatility
- 4.7.3 Pending micro-plastic bans on polymer coatings
- 4.7.4 Canada potash-tariff risk inflates potassium specialties
5 MARKET SIZE AND GROWTH FORECASTS (VALUE AND VOLUME)
- 5.1 Speciality Type
- 5.1.1 CRF
- 5.1.1.1 Polymer Coated
- 5.1.1.2 Polymer-Sulfur Coated
- 5.1.1.3 Others
- 5.1.2 Liquid Fertilizer
- 5.1.3 SRF
- 5.1.4 Water Soluble
- 5.1.1 CRF
- 5.2 Application Mode
- 5.2.1 Fertigation
- 5.2.2 Foliar
- 5.2.3 Soil
- 5.3 Crop Type
- 5.3.1 Field Crops
- 5.3.2 Horticultural Crops
- 5.3.3 Turf & Ornamental
6 COMPETITIVE LANDSCAPE
- 6.1 Key Strategic Moves
- 6.2 Market Share Analysis
- 6.3 Company Landscape
- 6.4 Company Profiles (Includes Global Level Overview, Market Level Overview, Core Business Segments, Financials, Headcount, Key Information, Market Rank, Market Share, Products and Services, and Analysis of Recent Developments)
- 6.4.1 Nutrien Ltd.
- 6.4.2 The Mosaic Company
- 6.4.3 CF Industries Holdings Inc.
- 6.4.4 Koch Fertilizer LLC (Koch Industries Inc.)
- 6.4.5 Yara International ASA
- 6.4.6 ICL Group Ltd.
- 6.4.7 Haifa Chemicals Ltd. (Trance-Chem Ltd.)
- 6.4.8 Sociedad Qumica y Minera de Chile S.A.
- 6.4.9 Wilbur-Ellis Company LLC
- 6.4.10 The Andersons Inc.
- 6.4.11 J.R. Simplot Company
- 6.4.12 Helena Agri-Enterprises LLC (Marubeni Corporation)
- 6.4.13 The Scotts Miracle-Gro Company
- 6.4.14 COMPO EXPERT GmbH (Grupa Azoty S.A.)
- 6.4.15 Agro-Culture Liquid Fertilizers, Inc.
7 KEY STRATEGIC QUESTIONS FOR FERTILIZER CEOS

 晶體肥料市場-2026-2032年全球市場預測特種肥料市場-2026-2032年全球市場預測
 特種肥料市場:商機、成長要素、產業趨勢分析及2026-2035年預測
 全球特種肥料市場(至2031年):依技術(緩釋肥料、微量元素肥料、水溶性肥料)、形態(乾粉、液體)、施用方法、類型、作物和地區分類的預測
 北美特種肥料市場:市場佔有率分析、產業趨勢與統計及成長預測(2026-2031 年)印度特種肥料市場:市場佔有率分析、產業趨勢與統計及成長預測(2026-2031)歐洲特種肥料:市場佔有率分析、產業趨勢與統計及成長預測(2026-2031 年)非洲特種肥料:市場佔有率分析、產業趨勢與統計及成長預測(2026-2031 年)中國特種肥料市場:市場佔有率分析、產業趨勢與統計及成長預測(2026-2031年)中東和非洲特種肥料市場:市場佔有率分析、行業趨勢和統計數據以及成長預測(2026-2031 年)