

 |
市場調查報告書
商品編碼
2072544
亞太地區特種肥料:市場佔有率分析、產業趨勢與統計及成長預測(2026-2031)Asia-Pacific Specialty Fertilizers - Market Share Analysis, Industry Trends & Statistics, Growth Forecasts (2026 - 2031) |
||||||
※ 本網頁內容可能與最新版本有所差異。詳細情況請與我們聯繫。
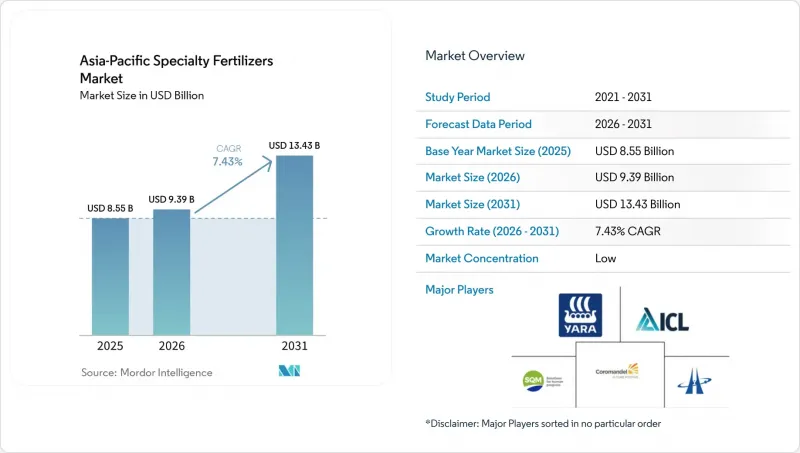
據 Mordor Intelligence 稱,亞太地區特種肥料市場在 2025 年的價值為 85.5 億美元,預計到 2031 年將從 2026 年的 93.9 億美元成長到 134.3 億美元,在預測期(2026-2031 年成長率)內的複合年成長率為 7.43%。
本報告按特殊肥料類型(控釋肥、液體肥料、緩釋肥、水溶性肥料)、施用方法(灌溉施肥、葉面噴布、土壤施用)、作物類型(田間作物、園藝作物、草坪和觀賞作物)以及國家(澳大利亞、孟加拉、中國、印度、印尼、日本等)進行細分。市場預測以價值(美元)和數量(公噸)表示。
亞太地區特種肥料市場趨勢及洞察。
精準施肥的引進
精準施肥技術的引入正在重塑亞太地區的特殊肥料市場,催生了對可與自動化灌溉系統無縫對接的水溶性和液態肥料的需求。 2024年,中國國家發展與改革委員會撥款28億美元用於水肥整合項目,目標是在2027年前建造500萬公頃新的施肥基礎設施。這項政策支持體現了該技術已被證實的卓越性能:與噴施肥料相比,精準施肥可使作物增產15%至25%,同時減少20%至30%的肥料用量。對於高價值作物而言,這種經濟效益尤其顯著,因為精準施肥灌溉系統能夠在作物關鍵生長階段精準輸送所需的微量元素混合物,從而最佳化植物養分供應和資源利用。
政府獎勵促進養分利用效率
亞太地區已開發市場的政府獎勵計畫透過直接補貼和稅收優惠,人為地推高了緩釋肥和高效肥的需求溢價。日本的「K計畫」於2024年啟動,投資額達2,500億日圓(約16.8億美元),該計畫將特種肥料列為重要農產品,並提供50%的成本補貼。這項政策干預有效地消除了先前限制緩釋肥推廣應用的價格溢價,從而引發了超越市場基本面的、結構性的需求模式轉變。
購買產品時的初始成本較高
專用肥料的價格比傳統複合肥高出200%至400%,這構成了推廣應用的一大障礙,尤其對於亞太地區的小規模農戶而言更是如此。小農戶佔農業生產者的80%,且融資和風險管理工具的取得管道有限。緩釋尿素的價格通常為每噸800至1200美元,而普通尿素的價格僅為每噸300至400美元,這迫使農民投入兩到三倍的流動資金來購買肥料。這種成本差異對水稻和小麥種植者來說是一個重大挑戰,因為大宗商品價格上漲的空間有限,難以消化不斷增加的投入成本,儘管專用肥料已被證實具有顯著的農藝效益,但仍構成了推廣應用的結構性障礙。
細分市場分析
在亞太地區特種肥料市場,液體肥料佔54.0%的市場佔有率(截至2025年),這主要得益於其與精準施肥系統的完美相容性,而精準施肥系統在該地區集約化農業區正迅速普及。液體肥料在該細分市場的主導地位反映了其在自動化施肥系統中的根本優勢,在這些系統中,精確的養分計量和均勻施肥對於最佳化作物產量至關重要。
緩釋肥料是成長最快的細分市場,預計2026年至2031年間的複合年成長率將達到7.8%。這主要得益於環境法規和排碳權計畫日益重視能夠減少養分流失和溫室氣體排放的技術。在緩釋肥料領域,聚合物包衣緩釋肥料面臨微塑膠法規帶來的新挑戰,促使人們致力於研發可生物分解的包衣材料,例如棕櫚硬脂、幾丁聚醣和澱粉基聚合物,這些材料既能保持緩釋性能,又能解決環境問題。
其他好處:
- Excel格式的市場預測(ME)表
- 3個月的分析師支持
目錄
第1章:引言
- 研究假設和市場定義
- 調查範圍
- 調查方法
第2章:本報告的內容
第3章:執行摘要和主要發現
第4章:主要產業趨勢
- 主要農作物種植面積
- 大田作物
- 園藝作物
- 平均施肥量
- 微量營養素
- 田間作物
- 園藝作物
- 主要營養素
- 田間作物
- 園藝作物
- 次要營養元素
- 田間作物
- 園藝作物
- 微量營養素
- 配備灌溉設施的農田
- 法律規範
- 價值鍊和通路分析
- 市場促進因素
- 精準施肥的引進
- 政府獎勵促進營養效率的提高
- 向高附加價值園藝轉型
- 土壤微量元素耗竭
- 透過電子商務取得小眾投入材料
- 由排碳權支持的N2O減排需求
- 市場限制因素
- 初始產品成本高
- 聚合物和鉀的價格波動
- 新近訂定的微塑膠塗層禁令
- 液體產品低溫運輸面臨的挑戰
第5章 市場規模與成長預測
- 產品類型
- CRF
- 聚合物塗層
- 聚合物硫塗層
- 其他
- 液體肥料
- SRF
- 水溶性
- CRF
- 使用方法
- 施肥和灌溉
- 葉面噴布
- 土壤
- 作物類型
- 田間作物
- 園藝作物
- 草坪和觀賞植物
- 國家
- 澳洲
- 孟加拉
- 中國
- 印度
- 印尼
- 日本
- 巴基斯坦
- 菲律賓
- 泰國
- 越南
- 其他亞太國家
第6章 競爭情勢
- 關鍵策略趨勢
- 市佔率分析
- 企業狀況
- 公司簡介。
- Yara International ASA
- ICL Group Ltd
- Sociedad Quimica y Minera de Chile SA
- Coromandel International Ltd.
- Huaqiang Chemical Group Stock Co., Ltd.
- Haifa Chemicals Ltd
- Compo Expert GmbH(Grupa Azoty SA)
- Kingenta Ecological Engineering Group Co. Ltd
- Nutrien Ltd
- Koch Industries Inc
- Hebei Sanyuan Jiuqi Fertilizer Co. Ltd
- Shandong Luxi Chemical Co. Ltd
- Hubei Xinyangfeng Fertilizer Co. Ltd
- Zhongchuang Xingyuan Chemical Technology Co. Ltd
- Zouping Hongyun Biotechnology Co. Ltd
第7章 化肥產業執行長面臨的關鍵策略挑戰
According to Mordor Intelligence, the asia-Pacific specialty fertilizer market size was valued at USD 8.55 billion in 2025 and estimated to grow from USD 9.39 billion in 2026 to reach USD 13.43 billion by 2031, at a CAGR of 7.43% during the forecast period (2026-2031).
This report is Segmented by Specialty Type (CRF, Liquid Fertilizer, SRF, and Water Soluble), by Application Mode (Fertigation, Foliar, Soil), by Crop Type (Field Crops, Horticultural Crops, and Turf and Ornamental), and by Country (Australia, Bangladesh, China, India, Indonesia, Japan, and More). The Market Forecasts are Provided in Terms of Value (USD) and Volume (Metric Tons).
Asia-Pacific Specialty Fertilizers Market Trends and Insights
Precision Fertigation Adoption
Precision fertigation adoption is reshaping the Asia-Pacific specialty fertilizer landscape by creating demand for water-soluble and liquid formulations that integrate seamlessly with automated irrigation systems. China's National Development and Reform Commission allocated USD 2.8 billion in 2024 for water-fertilizer integration projects, targeting 5 million hectares of new fertigation infrastructure by 2027. This policy push reflects the technology's proven ability to reduce fertilizer consumption by 20-30% while increasing crop yields by 15-25% compared to broadcast applications. The economic advantage becomes particularly compelling for high-value crops where fertigation systems can deliver targeted micronutrient blends during critical growth stages, optimizing both plant nutrition and resource utilization.
Government Nutrient-Efficiency Incentives
Government incentive programs across developed Asia-Pacific markets are creating artificial demand premiums for controlled-release and enhanced-efficiency fertilizers through direct subsidies and tax relief mechanisms. Japan's K Program, launched in 2024 with JPY 250 billion (USD 1.68 billion) in funding, designates specialty fertilizers as critical agricultural products eligible for 50% cost-sharing support. This policy intervention effectively eliminates the price premium that historically limited controlled-release fertilizer adoption, creating a structural shift in demand patterns that extends beyond market fundamentals.
High Upfront Product Cost
The 200-400% price premium of specialty fertilizers over conventional NPK creates significant adoption barriers, particularly among smallholder farmers who represent 80% of Asia-Pacific agricultural producers and operate with limited access to credit and risk management tools. Controlled-release urea typically costs USD 800-1,200 per tonne compared to USD 300-400 for conventional urea, requiring farmers to invest 2-3 times more working capital for fertilizer purchases. This cost differential becomes particularly challenging for rice and wheat producers, where commodity prices provide limited margin to absorb input cost increases, creating a structural barrier to adoption that persists despite proven agronomic benefits.
Other drivers and restraints analyzed in the detailed report include:
- Shift to High-Value Horticulture
- Soil Micronutrient Depletion
- Polymer and Potash Price Volatility
For complete list of drivers and restraints, kindly check the Table Of Contents.
Segment Analysis
Liquid fertilizers dominate the Asia-Pacific specialty fertilizer market share, accounting for 54.0% in 2025, driven by their seamless compatibility with precision fertigation systems that are expanding rapidly across the region's intensive agricultural areas. The segment's leadership position reflects the fundamental advantage of liquid formulations in automated application systems where precise nutrient metering and uniform distribution are critical for optimizing crop performance.
Controlled-release fertilizers represent the fastest-growing segment, with a 7.8% CAGR through 2026 to 2031, as environmental regulations and carbon credit programs increasingly favor technologies that reduce nutrient losses and greenhouse gas emissions. The polymer-coated segment within controlled-release fertilizers faces emerging challenges from microplastic regulations, driving innovation toward biodegradable coating materials, including palm stearin, chitosan, and starch-based polymers that maintain release characteristics while addressing environmental concerns
Complete Report Scope:
- Speciality Type
- CRF
- Polymer Coated
- Polymer-Sulfur Coated
- Others
- Liquid Fertilizer
- SRF
- Water Soluble
- CRF
- Application Mode
- Fertigation
- Foliar
- Soil
- Crop Type
- Field Crops
- Horticultural Crops
- Turf & Ornamental
- Country
- Australia
- Bangladesh
- China
- India
- Indonesia
- Japan
- Pakistan
- Philippines
- Thailand
- Vietnam
- Rest of Asia-Pacific
List of Companies Covered in this Report:
- Yara International ASA
- ICL Group Ltd
- Sociedad Quimica y Minera de Chile SA
- Coromandel International Ltd.
- Huaqiang Chemical Group Stock Co., Ltd.
- Haifa Chemicals Ltd
- Compo Expert GmbH (Grupa Azoty S.A.)
- Kingenta Ecological Engineering Group Co. Ltd
- Nutrien Ltd
- Koch Industries Inc
- Hebei Sanyuan Jiuqi Fertilizer Co. Ltd
- Shandong Luxi Chemical Co. Ltd
- Hubei Xinyangfeng Fertilizer Co. Ltd
- Zhongchuang Xingyuan Chemical Technology Co. Ltd
- Zouping Hongyun Biotechnology Co. Ltd
Additional Benefits:
- The market estimate (ME) sheet in Excel format
- 3 months of analyst support
TABLE OF CONTENTS
1 INTRODUCTION
- 1.1 Study Assumptions & Market Definition
- 1.2 Scope of the Study
- 1.3 Research Methodology
2 REPORT OFFERS
3 EXECUTIVE SUMMARY & KEY FINDINGS
4 KEY INDUSTRY TRENDS
- 4.1 Acreage Of Major Crop Types
- 4.1.1 Field Crops
- 4.1.2 Horticultural Crops
- 4.2 Average Nutrient Application Rates
- 4.2.1 Micronutrients
- 4.2.1.1 Field Crops
- 4.2.1.2 Horticultural Crops
- 4.2.2 Primary Nutrients
- 4.2.2.1 Field Crops
- 4.2.2.2 Horticultural Crops
- 4.2.3 Secondary Macronutrients
- 4.2.3.1 Field Crops
- 4.2.3.2 Horticultural Crops
- 4.2.1 Micronutrients
- 4.3 Agricultural Land Equipped For Irrigation
- 4.4 Regulatory Framework
- 4.5 Value Chain & Distribution Channel Analysis
- 4.6 Market Drivers
- 4.6.1 Precision fertigation adoption
- 4.6.2 Government nutrient-efficiency incentives
- 4.6.3 Shift to high-value horticulture
- 4.6.4 Soil micronutrient depletion
- 4.6.5 E-commerce access to niche inputs
- 4.6.6 Carbon-credit backed N?O-reduction demand
- 4.7 Market Restraints
- 4.7.1 High upfront product cost
- 4.7.2 Polymer and potash price volatility
- 4.7.3 Emerging microplastic-coating bans
- 4.7.4 Cold-chain gaps for liquid products
5 MARKET SIZE AND GROWTH FORECASTS (VALUE AND VOLUME)
- 5.1 Speciality Type
- 5.1.1 CRF
- 5.1.1.1 Polymer Coated
- 5.1.1.2 Polymer-Sulfur Coated
- 5.1.1.3 Others
- 5.1.2 Liquid Fertilizer
- 5.1.3 SRF
- 5.1.4 Water Soluble
- 5.1.1 CRF
- 5.2 Application Mode
- 5.2.1 Fertigation
- 5.2.2 Foliar
- 5.2.3 Soil
- 5.3 Crop Type
- 5.3.1 Field Crops
- 5.3.2 Horticultural Crops
- 5.3.3 Turf & Ornamental
- 5.4 Country
- 5.4.1 Australia
- 5.4.2 Bangladesh
- 5.4.3 China
- 5.4.4 India
- 5.4.5 Indonesia
- 5.4.6 Japan
- 5.4.7 Pakistan
- 5.4.8 Philippines
- 5.4.9 Thailand
- 5.4.10 Vietnam
- 5.4.11 Rest of Asia-Pacific
6 COMPETITIVE LANDSCAPE
- 6.1 Key Strategic Moves
- 6.2 Market Share Analysis
- 6.3 Company Landscape
- 6.4 Company Profiles (includes Global Level Overview, Market Level Overview, Core Business Segments, Financials, Headcount, Key Information, Market Rank, Market Share, Products and Services, and Analysis of Recent Developments).
- 6.4.1 Yara International ASA
- 6.4.2 ICL Group Ltd
- 6.4.3 Sociedad Quimica y Minera de Chile SA
- 6.4.4 Coromandel International Ltd.
- 6.4.5 Huaqiang Chemical Group Stock Co., Ltd.
- 6.4.6 Haifa Chemicals Ltd
- 6.4.7 Compo Expert GmbH (Grupa Azoty S.A.)
- 6.4.8 Kingenta Ecological Engineering Group Co. Ltd
- 6.4.9 Nutrien Ltd
- 6.4.10 Koch Industries Inc
- 6.4.11 Hebei Sanyuan Jiuqi Fertilizer Co. Ltd
- 6.4.12 Shandong Luxi Chemical Co. Ltd
- 6.4.13 Hubei Xinyangfeng Fertilizer Co. Ltd
- 6.4.14 Zhongchuang Xingyuan Chemical Technology Co. Ltd
- 6.4.15 Zouping Hongyun Biotechnology Co. Ltd
7 KEY STRATEGIC QUESTIONS FOR FERTILIZERS CEOS
 特種肥料市場-全球產業規模、佔有率、趨勢、機會和預測:按作物類型、形態、應用方法、技術、地區和競爭格局分類,2021-2031年
 晶體肥料市場:2026-2032年全球市場預測(依養分類型、應用、形態、作物類型、作用機制與銷售管道)特種肥料市場:2026-2032年全球市場預測(依產品形式、作物類型、養分類型、施用方法、通路和最終用途分類)
 特種肥料市場規模、佔有率和趨勢分析報告:按技術、作物、類型、應用、地區和細分市場預測(2026-2033 年)
 特種肥料:市場佔有率分析、產業趨勢與統計、成長預測(2026-2031)
 全球特種肥料市場規模、佔有率、趨勢和成長分析報告(2026-2034)
 2026年全球特種肥料市場報告
 特種肥料市場規模、佔有率和成長分析(按類型、技術、形態、作物類型、應用方法和地區分類)-2026-2033年產業預測全球特種肥料市場規模(依特種肥料類型、作物類型、施用方法、區域範圍及預測)中國特種肥料市場佔有率分析、產業趨勢與統計、成長預測(2025-2030年)