


 |
市場調查報告書
商品編碼
2073439
託管資訊服務:市場佔有率分析、行業趨勢和統計數據、成長預測(2026-2031 年)Managed Information Services - Market Share Analysis, Industry Trends & Statistics, Growth Forecasts (2026 - 2031) |
||||||

※ 本網頁內容可能與最新版本有所差異。詳細情況請與我們聯繫。
根據 Mordor Intelligence 估計,到 2026 年,託管資訊服務市值將達到 3,256.5 億美元,高於 2025 年的 3,031.6 億美元,預計到 2031 年將達到 4,657.4 億美元。
預計 2026 年至 2031 年的複合年成長率為 7.42%。
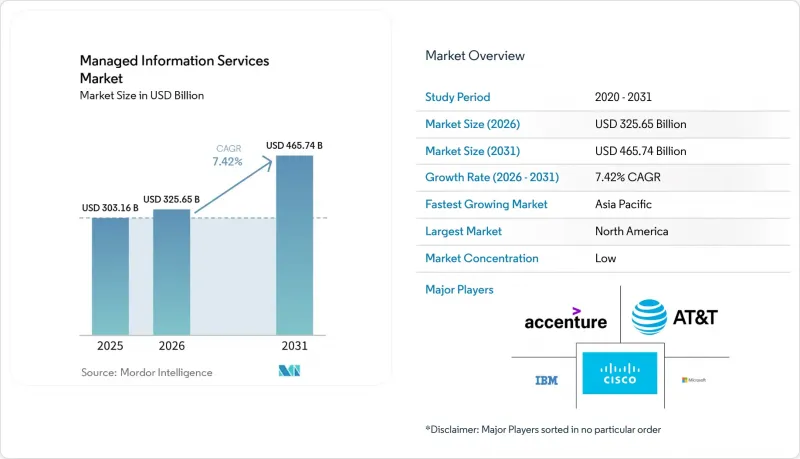
本報告按部署類型(雲端和本地部署)、服務類型(託管資料中心、託管安全、託管通訊(統一通訊和 VoIP)等)、最終用戶公司規模(中小企業和大型企業)、最終用戶產業(IT 和電信、銀行、金融服務和保險、醫療保健等)以及地區進行細分。市場預測以美元計價。
全球託管資訊服務市場趨勢與洞察
遷移到混合/多重雲端架構
混合雲和多重雲端不再只是工具選項,而是經營團隊的基本需求,預計到 2027 年,90% 的企業將採用這種方法。工作負載可攜性、資料居住法規和供應商多元化帶來的營運複雜性增加,促使企業將整合管理外包給第三方專家。思科的一份報告顯示,53% 的企業每週都會在本地端和雲端環境之間遷移工作負載,這持續推動了對編配平台和跨域管治服務的需求。能夠提供一致的策略執行、整合可觀測性和跨平台自動化工作負載部署的供應商,如今正收取高額費用。這種採用趨勢在高度監管的行業中尤其明顯,這些行業必須同時滿足合規性和創新目標,從而進一步強化了將本地控制與雲端敏捷性相結合的託管服務的價值提案。
成本最佳化和關注營運支出
經濟的不確定性和技術的快速發展正促使財務領導者轉向可預測的訂閱式支出模式。託管服務將資本支出轉化為營運支出 (OPEX),同時將硬體過時、授權和人才招募的風險轉移給供應商。中小企業 (SME) 是這種模式的快速採用者,因為它無需大量前期投資即可獲得企業級安全性和分析功能。此外,由於供應商承擔合規報告和事件回應的責任,企業內部團隊可以將有限的技能資源投入到面向客戶的創新中。因此,以營運支出主導的合約擴大包含與基礎設施可用性、服務水準、使用者體驗和業務指標相關的績效保證。
整合舊有系統和複雜的監管法規
許多公司的核心應用程式運作在已有數十年歷史的系統上,難以輕鬆與現代託管平台整合。銀行、公共產業和公共機構面臨嚴格的審計要求,這需要客製化的控制措施、專用適配器和漫長的檢驗週期。客製化整合會增加專案成本,並削弱支撐託管服務吸引力的規模經濟效益。諸如SOX和GDPR之類的合規框架通常要求進行本地審計日誌記錄和資料隔離,迫使服務提供者建置專用環境,並增加了部署負擔。這些因素會延長銷售週期,延遲價值實現時間,尤其對於面臨全球各地不同監管義務的公司而言。
細分市場分析
至2025年,本地部署環境仍將佔據託管資訊服務市場53.42%的佔有率。這主要是由於許多受嚴格監管的公司持續要求對其基礎設施擁有直接控制權。對私有資料中心和延遲敏感型工作負載的大量投資進一步加速了這一趨勢。然而,預計到2031年,基於雲端的託管服務將以13.25%的複合年成長率成長,這表明各行業的工作負載正在加速轉向更注重敏捷性和彈性使用的方向。混合環境目前佔據主導地位,服務供應商必須提供跨兩種環境的集中式視覺性、自動修正配置差異以及統一的安全控制。
雲端技術的加速普及反映出人們對超大規模平台的信心日益增強,這些平台如今提供特定產業的合規藍圖、主權雲端區域和精細化的加密選項。此外,企業意識到雲端現代化與應用轉型密不可分,這推動了對重構、DevSecOps 管線和持續合規監控的需求。擁有認證雲端專業知識、專有遷移加速器和強大的財務最佳化工具的託管服務合作夥伴正在贏得大規模的合約。同時,僅限於資料中心外包的供應商則面臨合約縮減的風險,因為客戶正在採用雲端原生設計模式,並期望獲得關於工作負載部署經濟性的主動指導。
預計到2025年,資安管理服務將佔總收入的28.92%,複合年成長率達14.18%,反映出網路風險已提升為公司層面的優先事項。如今,先進的服務將威脅情報、行為分析和自動化回應相結合,並透過整合平台交付,從而減少了人工處理的工作量。
此外,對零信任網路存取、雲端工作負載保護和供應鏈風險評估的需求正在不斷成長。同時,託管資料中心和網路服務持續產生可預測的經常性收入,但由於基礎設施自動化程度的提高導致傳統工單量下降,其成長速度落後於安全領域。因此,服務組合正圍繞著建構安全的多重雲端環境進行整合,供應商正在整合身分管治、預防資料外泄和合規性儀表板。 Canalys 指出,與孤立的提案相比,結合安全性和雲端最佳化的解決方案可產生高出 1.6 倍的交叉銷售收入。因此,投資 MDR 平台、安全分析和專用事件回應團隊的供應商正在獲得差異化的利潤率。
區域分析
2025年,北美地區繼續佔據34.87%的收入佔有率,這主要得益於早期雲端運算應用、健全的網路安全法規以及領先供應商蓬勃發展的生態系統。美國企業普遍需要預測分析、人工智慧驅動的營運以及將費用與業務關鍵績效指標 (KPI) 掛鉤的基於結果的合約。加拿大正透過聯邦數位管理計畫和依賴安全、多重雲端可擴展性的現代銀行舉措,進一步推動雲端運算發展。許多供應商正在部署區域交付中心和主權雲端區域,以遵守不斷變化的省級隱私法,同時保持低延遲的服務水準。
亞太地區是成長最快的市場,複合年成長率達12.45%,正迅速縮小與現有地區的差距。在中國,隨著智慧城市建設和製造業政策升級,託管資訊服務規模不斷擴大,這需要邊緣編配和安全連接。東南亞國家透過採用雲端託管應用和行動優先商務,實現了基礎設施的飛躍式發展,這需要合作夥伴的支援來進行網路最佳化和合規性檢查。那些建立合資企業、提供多語言服務台並部署區域性垂直解決方案的供應商,將擁有強大的市場佔有率成長潛力。
在歐洲,市場需求成熟且強勁,這得益於《一般資料保護規範》(GDPR)、《數位營運韌性法案》以及永續發展報告義務的支持。德國和英國仍然是最大的消費國,但隨著歐盟復甦基金對數位化計畫的支持,南歐國家的成長也正在加速。供應商正透過可衡量的碳減排舉措、僅限歐盟的資料居住要求以及提供符合檢驗要求的合規文件來脫穎而出。隨著未來環境法規的日益嚴格,採購標準將轉向那些在可再生能源採購和基於循環經濟的硬體營運方面展現出可驗證進展的合作夥伴。
其他好處:
- Excel格式的市場預測(ME)表
- 3個月的分析師支持
目錄
第1章:引言
- 研究假設和市場定義
- 調查範圍
第2章:調查方法
第3章執行摘要
第4章 市場狀況
- 市場概覽
- 市場促進因素
- 遷移到混合/多重雲端架構
- 成本最佳化和重點關注營運支出
- 網路威脅日益加劇,合規壓力也隨之增加。
- 邊緣運算部署需要本地 MSP 節點
- 綠色管理服務的永續性要求
- 人工智慧驅動的自主運作(AIOps)的成熟度
- 市場限制因素
- 整合舊有系統和複雜的監管法規
- 資料主權/隱私問題
- 熟練人員短缺推高了MSP成本。
- 採用無伺服器/零運維架構來縮小 MSP 營運範圍
- 價值鏈分析
- 監理情勢
- 技術展望
- 波特五力分析
- 投資分析
第5章 市場規模與成長預測
- 不同的發展
- 現場
- 雲
- 按服務類型
- 託管資料中心
- 託管安全
- 託管通訊(統一通訊和 VoIP)
- 託管網路(LAN/WAN/SASE)
- 託管基礎設施(伺服器/儲存)
- 行動性和裝置管理
- 託管應用程式和 DevOps
- 按最終用戶公司規模分類
- 中小企業
- 大公司
- 按最終用戶行業分類
- BFSI
- 資訊科技/通訊
- 衛生保健
- 媒體與娛樂
- 零售與電子商務
- 製造業
- 政府/公共部門
- 其他行業
- 按地區
- 北美洲
- 美國
- 加拿大
- 墨西哥
- 南美洲
- 巴西
- 阿根廷
- 其他南美國家
- 歐洲
- 德國
- 英國
- 法國
- 義大利
- 俄羅斯
- 西班牙
- 瑞士
- 其他歐洲國家
- 亞太地區
- 中國
- 印度
- 日本
- 韓國
- 馬來西亞
- 新加坡
- 越南
- 印尼
- 其他亞太國家
- 中東和非洲
- 中東
- 沙烏地阿拉伯
- 阿拉伯聯合大公國
- 土耳其
- 其他中東國家
- 非洲
- 奈及利亞
- 南非
- 其他非洲國家
- 中東
- 北美洲
第6章 競爭情勢
- 市場集中度
- 策略趨勢
- 市佔率分析
- 公司簡介
- IBM Corporation
- Accenture plc
- Cisco Systems Inc.
- Microsoft Corporation
- AT&T Inc.
- Fujitsu Ltd
- Hewlett Packard Enterprise(HPE)
- Dell Technologies Inc.
- Verizon Communications Inc.
- Rackspace Technology
- Deutsche Telekom AG(T-Systems)
- Nokia Solutions and Networks
- Telefonaktiebolaget LM Ericsson
- Tata Consultancy Services(TCS)
- Wipro Ltd
- HCL Technologies Ltd
- Cognizant Technology Solutions
- NTT DATA Corporation
- Capgemini SE
- Kyndryl Holdings Inc.
- Orange Business Services
第7章 市場機會與未來展望
According to Mordor Intelligence, managed information services market size in 2026 is estimated at USD 325.65 billion, growing from 2025 value of USD 303.16 billion with 2031 projections showing USD 465.74 billion, growing at 7.42% CAGR over 2026-2031.
This report is Segmented by Deployment (Cloud and On-Premise), Service Type (Managed Data Centre, Managed Security, Managed Communications (UC and VoIP) and More), End-User Enterprise Size (Small and Medium-Sized Enterprises and Large Enterprises), End-User Vertical (IT and Telecom, BFSI, Healthcare, and More) and by Geography. The Market Forecasts are Provided in Terms of Value (USD).
Global Managed Information Services Market Trends and Insights
Shift to Hybrid / Multi-Cloud Architectures
Hybrid and multi-cloud have become a board-level imperative rather than a tooling preference, with 90% of enterprises projected to adopt the approach by 2027. Workload portability, data residency rules, and vendor diversification multiply operational complexity, prompting organisations to source unified management from third-party specialists. Cisco reports that 53% of firms move workloads between on-premise and cloud environments each week, creating sustained demand for orchestration platforms and cross-domain governance services. Providers that supply consistent policy enforcement, integrated observability, and automated workload placement across dissimilar platforms currently command premium pricing. Adoption is most visible in highly regulated sectors that must simultaneously satisfy compliance and innovation goals, reinforcing the value proposition of managed services that can blend local control with cloud agility.
Cost-Optimization and OPEX Preference
Economic uncertainty and rapid technology churn are driving finance leaders toward predictable subscription spending. Managed services convert capital outlays into operating expenses while transferring hardware obsolescence, licence management, and talent retention risks to the vendor. Small and medium enterprises are embracing the model fastest because it unlocks enterprise-grade security and analytics without heavy up-front investment. Providers also assume compliance reporting and incident response responsibilities, allowing internal teams to redirect scarce skills toward customer-facing innovation. As a result, OPEX-driven contracts increasingly include outcome guarantees tied to service levels, user experience, and business metrics rather than infrastructure availability alone.
Legacy Integration and Regulatory Complexity
Many enterprises run core applications on decades-old systems that cannot easily interface with modern managed platforms. Banking, utilities, and public-sector agencies face stringent audit requirements that demand bespoke controls, specialised adapters, and extended validation cycles. Custom integration inflates project costs and erodes the economies of scale that make managed services attractive. Compliance frameworks such as SOX and GDPR often mandate on-premise audit logging and data segregation, forcing providers to deploy dedicated environments that increase delivery effort. These factors lengthen sales cycles and delay time-to-value, especially for global organisations with diverse regulatory obligations.
Other drivers and restraints analyzed in the detailed report include:
- Escalating Cyber-Threat and Compliance Pressure
- Edge-Computing Roll-Outs Requiring Local MSP Nodes
- Serverless / No-Ops Architectures Reducing MSP Scope
For complete list of drivers and restraints, kindly check the Table Of Contents.
Segment Analysis
On-premise environments retained 53.42% of managed information services market share in 2025 because many highly regulated firms continue to demand direct infrastructure custody. Heavy investments in private data centres and latency-sensitive workloads further anchor this preference. Yet cloud-based managed services are on track for a 13.25% CAGR through 2031, underscoring that workload migration is gathering pace across industries that prize agility and elastic consumption. Hybrid estates now prevail, compelling service providers to offer single-pane visibility, automated configuration drift remediation, and uniform security controls across both venues.
Cloud acceleration also reflects growing trust in hyperscale platforms that now provide sector-specific compliance blueprints, sovereign cloud zones, and granular encryption options. Enterprises moreover recognise that cloud modernisation is inseparable from application transformation, driving demand for refactoring, DevSecOps pipelines, and continuous compliance monitoring. Managed services partners that demonstrate certified cloud expertise, proprietary migration accelerators, and robust financial optimisation tooling are winning larger contract scopes. Conversely, providers limited to data-centre outsourcing risk contract attrition as clients adopt cloud-native design patterns and expect proactive guidance on workload placement economics.
Managed security services controlled 28.92% of the total revenue pool in 2025 and are expanding at 14.18% CAGR, reflecting cyber risk's elevation to an enterprise-wide priority. Advanced services now blend threat intelligence, behaviour analytics, and automated response executed through unified platforms, reducing manual triage workloads.
Demand also rises for zero-trust network access, cloud workload protection, and supply-chain risk assessments. In parallel, managed data-centre and network services continue to deliver predictable annuity streams, but their growth trails security because infrastructure automation compresses traditional ticket volumes. Service portfolios are therefore converging around secure multi-cloud enablement, with providers integrating identity governance, data loss prevention, and compliance dashboards. Canalys highlights that combined security and cloud optimisation offerings generate 1.6 times higher cross-sell revenue relative to siloed propositions. Vendors investing in MDR platforms, security analytics, and specialist incident-response teams consequently command differentiated margins.
Complete Report Scope:
- By Deployment
- On-premise
- Cloud
- By Service Type
- Managed Data Centre
- Managed Security
- Managed Communications (UC and VoIP)
- Managed Network (LAN/WAN/SASE)
- Managed Infrastructure (Server / Storage)
- Managed Mobility and Device
- Managed Application and DevOps
- By End-user Enterprise Size
- Small and Medium Enterprises (SME)
- Large Enterprises
- By End-user Vertical
- BFSI
- IT and Telecom
- Healthcare
- Media and Entertainment
- Retail and E-commerce
- Manufacturing
- Government and Public Sector
- Other Verticals
- By Geography
- North America
- United States
- Canada
- Mexico
- South America
- Brazil
- Argentina
- Rest of South America
- Europe
- Germany
- United Kingdom
- France
- Italy
- Russia
- Spain
- Switzerland
- Rest of Europe
- Asia-Pacific
- China
- India
- Japan
- South Korea
- Malaysia
- Singapore
- Vietnam
- Indonesia
- Rest of Asia-Pacific
- Middle East and Africa
- Middle East
- Saudi Arabia
- United Arab Emirates
- Turkey
- Rest of Middle East
- Africa
- Nigeria
- South Africa
- Rest of Africa
- Middle East
- North America
Geography Analysis
North America retained 34.87% of 2025 revenue due to early cloud adoption, sophisticated cybersecurity regulations, and a deep ecosystem of tier-one providers. Enterprises in the United States routinely demand predictive analytics, AI-assisted operations, and outcome-based contracts that tie fees to business KPIs. Canada adds momentum through federal digital-government programmes and modern banking initiatives that depend on secure multi-cloud elasticity. Many providers deploy regional delivery hubs and sovereign cloud zones to comply with evolving state-level privacy laws while sustaining low-latency service levels.
Asia-Pacific is the fastest-growing theatre at 12.45% CAGR and is closing the gap on incumbent regions. China scales managed information services through smart-city investments and manufacturing upgrade policies that require edge orchestration and secure connectivity. Southeast Asian nations are leapfrogging legacy infrastructure by adopting cloud-hosted applications and mobile-first commerce, necessitating partner support for network optimisation and regulatory compliance. Providers that establish joint ventures, multilingual service desks, and region-specific vertical solutions are well positioned to capture wallet share.
Europe shows mature yet resilient demand anchored in GDPR, the Digital Operational Resilience Act, and sustainability reporting obligations. Germany and the United Kingdom remain top spenders, but southern Europe is accelerating as EU recovery funds support digitisation projects. Providers differentiate by offering measurable carbon-reduction initiatives, EU-only data residency, and audit-ready compliance artefacts. Over time, tighter environmental rules will shift procurement criteria toward partners that demonstrate verifiable progress on renewable energy sourcing and circular-economy hardware practices
- IBM Corporation
- Accenture plc
- Cisco Systems Inc.
- Microsoft Corporation
- AT&T Inc.
- Fujitsu Ltd
- Hewlett Packard Enterprise (HPE)
- Dell Technologies Inc.
- Verizon Communications Inc.
- Rackspace Technology
- Deutsche Telekom AG (T-Systems)
- Nokia Solutions and Networks
- Telefonaktiebolaget LM Ericsson
- Tata Consultancy Services (TCS)
- Wipro Ltd
- HCL Technologies Ltd
- Cognizant Technology Solutions
- NTT DATA Corporation
- Capgemini SE
- Kyndryl Holdings Inc.
- Orange Business Services
Additional Benefits:
- The market estimate (ME) sheet in Excel format
- 3 months of analyst support
TABLE OF CONTENTS
1 INTRODUCTION
- 1.1 Study Assumptions and Market Definition
- 1.2 Scope of the Study
2 RESEARCH METHODOLOGY
3 EXECUTIVE SUMMARY
4 MARKET LANDSCAPE
- 4.1 Market Overview
- 4.2 Market Drivers
- 4.2.1 Shift to hybrid / multi-cloud architectures
- 4.2.2 Cost-optimisation and OPEX preference
- 4.2.3 Escalating cyber-threat and compliance pressure
- 4.2.4 Edge-computing roll-outs needing local MSP nodes
- 4.2.5 Sustainability mandates for green managed services
- 4.2.6 AI-driven autonomous operations (AIOps) maturity
- 4.3 Market Restraints
- 4.3.1 Legacy integration and regulatory complexity
- 4.3.2 Data-sovereignty / privacy concerns
- 4.3.3 Skilled-talent crunch inflating MSP costs
- 4.3.4 Serverless / No-Ops architectures reducing MSP scope
- 4.4 Value Chain Analysis
- 4.5 Regulatory Landscape
- 4.6 Technological Outlook
- 4.7 Porter's Five Forces Analysis
- 4.7.1 Threat of New Entrants
- 4.7.2 Bargaining Power of Buyers
- 4.7.3 Bargaining Power of Suppliers
- 4.7.4 Threat of Substitutes
- 4.7.5 Intensity of Competitive Rivalry
- 4.8 Investment Analysis
5 MARKET SIZE AND GROWTH FORECASTS (VALUE)
- 5.1 By Deployment
- 5.1.1 On-premise
- 5.1.2 Cloud
- 5.2 By Service Type
- 5.2.1 Managed Data Centre
- 5.2.2 Managed Security
- 5.2.3 Managed Communications (UC and VoIP)
- 5.2.4 Managed Network (LAN/WAN/SASE)
- 5.2.5 Managed Infrastructure (Server / Storage)
- 5.2.6 Managed Mobility and Device
- 5.2.7 Managed Application and DevOps
- 5.3 By End-user Enterprise Size
- 5.3.1 Small and Medium Enterprises (SME)
- 5.3.2 Large Enterprises
- 5.4 By End-user Vertical
- 5.4.1 BFSI
- 5.4.2 IT and Telecom
- 5.4.3 Healthcare
- 5.4.4 Media and Entertainment
- 5.4.5 Retail and E-commerce
- 5.4.6 Manufacturing
- 5.4.7 Government and Public Sector
- 5.4.8 Other Verticals
- 5.5 By Geography
- 5.5.1 North America
- 5.5.1.1 United States
- 5.5.1.2 Canada
- 5.5.1.3 Mexico
- 5.5.2 South America
- 5.5.2.1 Brazil
- 5.5.2.2 Argentina
- 5.5.2.3 Rest of South America
- 5.5.3 Europe
- 5.5.3.1 Germany
- 5.5.3.2 United Kingdom
- 5.5.3.3 France
- 5.5.3.4 Italy
- 5.5.3.5 Russia
- 5.5.3.6 Spain
- 5.5.3.7 Switzerland
- 5.5.3.8 Rest of Europe
- 5.5.4 Asia-Pacific
- 5.5.4.1 China
- 5.5.4.2 India
- 5.5.4.3 Japan
- 5.5.4.4 South Korea
- 5.5.4.5 Malaysia
- 5.5.4.6 Singapore
- 5.5.4.7 Vietnam
- 5.5.4.8 Indonesia
- 5.5.4.9 Rest of Asia-Pacific
- 5.5.5 Middle East and Africa
- 5.5.5.1 Middle East
- 5.5.5.1.1 Saudi Arabia
- 5.5.5.1.2 United Arab Emirates
- 5.5.5.1.3 Turkey
- 5.5.5.1.4 Rest of Middle East
- 5.5.5.2 Africa
- 5.5.5.2.1 Nigeria
- 5.5.5.2.2 South Africa
- 5.5.5.2.3 Rest of Africa
- 5.5.5.1 Middle East
- 5.5.1 North America
6 COMPETITIVE LANDSCAPE
- 6.1 Market Concentration
- 6.2 Strategic Moves
- 6.3 Market Share Analysis
- 6.4 Company Profiles (includes Global level Overview, Market level overview, Core Segments, Financials as available, Strategic Information, Market Rank/Share, Products and Services, Recent Developments)
- 6.4.1 IBM Corporation
- 6.4.2 Accenture plc
- 6.4.3 Cisco Systems Inc.
- 6.4.4 Microsoft Corporation
- 6.4.5 AT&T Inc.
- 6.4.6 Fujitsu Ltd
- 6.4.7 Hewlett Packard Enterprise (HPE)
- 6.4.8 Dell Technologies Inc.
- 6.4.9 Verizon Communications Inc.
- 6.4.10 Rackspace Technology
- 6.4.11 Deutsche Telekom AG (T-Systems)
- 6.4.12 Nokia Solutions and Networks
- 6.4.13 Telefonaktiebolaget LM Ericsson
- 6.4.14 Tata Consultancy Services (TCS)
- 6.4.15 Wipro Ltd
- 6.4.16 HCL Technologies Ltd
- 6.4.17 Cognizant Technology Solutions
- 6.4.18 NTT DATA Corporation
- 6.4.19 Capgemini SE
- 6.4.20 Kyndryl Holdings Inc.
- 6.4.21 Orange Business Services
7 MARKET OPPORTUNITIES AND FUTURE OUTLOOK
- 7.1 White-space and Unmet-need Assessment

 北美託管服務:市場佔有率分析、產業趨勢與統計及成長預測(2026-2031 年)美國託管服務:市場佔有率分析、行業趨勢和統計數據、成長預測(2026-2031 年)非洲託管服務:市場佔有率分析、產業趨勢與統計及成長預測(2026-2031 年)
 DevOps外包服務市場規模、佔有率和成長分析:按服務類型、部署模式、企業規模、最終用戶和地區分類-2026-2033年產業預測託管服務:市場佔有率分析、行業趨勢和統計數據、成長預測(2026-2031 年)
 託管服務市場-2026-2032年全球市場預測
 全球託管服務市場:按服務類型(資安管理服務、託管網路服務、託管IT基礎設施基礎設施和資料中心服務、託管通訊與協作服務、行動化運營服務、託管資訊服務)、部署類型、組織規模、行業和地區分類-預測至2031年
 2026-2030年全球託管服務市場
 2026年全球託管通訊服務市場報告
 託管服務市場:按服務類型、部署方式、最終用戶和地區分類