


 |
市場調查報告書
商品編碼
2073311
OKR和目標管理軟體:市場佔有率分析、行業趨勢和統計數據以及成長預測(2026-2031年)OKR and Goal Management Software - Market Share Analysis, Industry Trends & Statistics, Growth Forecasts (2026 - 2031) |
||||||

※ 本網頁內容可能與最新版本有所差異。詳細情況請與我們聯繫。
據 Mordor Intelligence 稱,OKR 和目標管理軟體市場預計將從 2025 年的 24 億美元成長到 2026 年的 26.5 億美元,到 2031 年達到 43.8 億美元,預計 2026 年至 2031 年的複合年成長率為 10.59%。
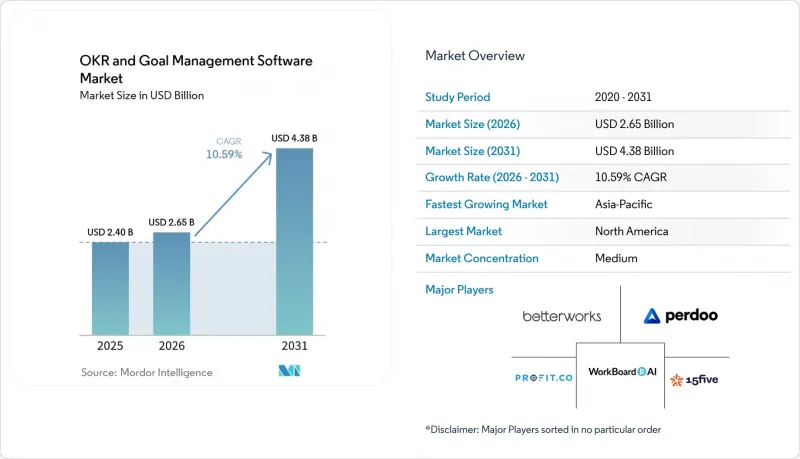
本報告按功能(追蹤與視覺化、整合與協作、效能分析等)、部署類型(雲端、本地部署)、組織規模(中小企業、大型企業)、產業(IT與電信等)和地區進行細分。市場預測以美元計價。
全球 OKR 與目標管理軟體市場趨勢與洞察
敏捷和遠距工作文化的傳播
在北美和歐洲,混合辦公模式的採用率已超過 60%,這暴露出年度目標週期的限制。 2025 年,微軟透過將 Ally.io 的 OKR 追蹤器整合到 Teams 中,加速了 OKR 的大規模普及,使員工能夠在日常協作中心查看自己的目標。 WorkBoard 也緊隨其後,將其平台與 Microsoft Copilot 整合,使用戶能夠以自然語言查詢進展,從而消除了一大痛點。 Betterworks 在 2026 年發布了「NextGen」版本,新增了 400 多個 AI 工作流程,用於自動化簽到。總而言之,這些舉措表明,分散式團隊正在尋求非同步可見性和持續協作,這將推動 OKR 和目標管理軟體市場的中期成長。
對即時效能視覺化的需求日益成長
經營團隊不再容忍每季延遲發布的數據看板。 Betterworks 的人工智慧人才智慧解決方案將於 2026 年 5 月發布,該方案將關鍵成果的進展與技能差距關聯起來,在目標未能達成之前向經營團隊發出警報。其 API 優先架構透過直接從 CRM、專案管理和財務系統傳輸數據,進一步降低了延遲。 Brev 是一家新創公司,於 2026 年 4 月完成了 330 萬美元的資金籌措。此方案可自動更新來自 Slack 討論串、Jira 工單和會議記錄的關鍵成果,從而無需手動輸入,而手動輸入正是 90% 的公司面臨的難題。因此,即時洞察是短期成長的催化劑,尤其是在競爭週期中快速縮短的技術主導產業。
雲端採用中的資料安全和隱私問題
諸如 GDPR、PIPL 和特定產業法規等嚴格框架使得許多買家仍然選擇維護本地部署環境。 Perdoo 的基礎設施位於愛爾蘭,Weekdone 的伺服器位於愛沙尼亞,而 Profit.co 則為金融和醫療產業的客戶提供區域雲端和本地部署版本。然而,隨著平台數量的增加,審計範圍也隨之擴大,IT 部門的阻力也越來越大。 2024 年至 2025 年間發生的多起備受矚目的資料外洩事件加劇了這些擔憂,使得安全性問題成為 OKR 和目標管理軟體市場雲端遷移的短期障礙。
細分市場分析
到 2025 年,「追蹤與視覺化」將成為 OKR 和目標管理軟體市場的主要驅動力,而「整合與自動化」預計到 2031 年將保持 12.01% 的複合年成長率。這種轉變反映了客戶希望減少耗時且會損害資料完整性的手動更新。 Brev 的 AI 代理程式可自動從 Slack、Jira 和 Salesforce 更新關鍵績效資料。這項創新每年可為擁有 500 名員工的公司節省高達 200 萬美元。儘管經營團隊仍然需要清晰地了解進展,儀錶板仍然被廣泛使用,但它們現在已整合到各個整合層中,而不是作為獨立模組出售。
績效分析正逐漸成為連結目標和營運觸發因素的橋樑。 Betterworks 利用預測性標誌在延遲升級為失敗之前提醒管理者。隨著混合團隊需要非同步協調,協作工具也穩定發展。同時,在受監管的行業中,報告和洞察功能對於審計追蹤仍然至關重要。諸如遊戲化之類的細分功能吸引了注重員工參與度的買家,但收入有限。因此,功能集正朝著端到端執行的方向融合,整合功能成為 OKR 和目標管理軟體市場的主要購買動機。
截至2025年,本地部署將佔OKR和目標管理軟體市場佔有率的67.41%,而雲端解決方案的複合年成長率(CAGR)為12.89%。合規性是決定本地部署的主要因素。例如,德國銀行引用德國聯邦金融監理局(BaFin)關於本地託管的指導意見作為其選擇本地部署的原因。供應商正透過提供混合控制功能來應對這項挑戰。 Profit.co已獲得FedRAMP Ready認證,以滿足美國聯邦政府的需求;Quantive則允許企業選擇AWS區域進行資料隔離。儘管如此,中小企業仍然傾向於SaaS模式,因為它能夠降低資本支出(Capex)、加快部署速度並確保自動升級。
未來,隨著基礎設施現代化進程的推進,這種平衡將會改變。微軟將 Ally.io 整合到 Viva Goals 中,使得數百萬 Teams 用戶能夠存取原生雲端 OKR,遠端託管也變得越來越普遍。然而,隨著監管機構完善相關指南,以及現有企業完成遷移藍圖,雲端發展將逐步推進。因此,至少在 2031 年之前,OKR 和目標管理軟體市場中這兩種模式的共存仍將是確定的。
區域分析
預計到2025年,北美將維持37.34%的市場佔有率,這得益於2026年美國軟體支出預計將成長15.2%。產業整合趨勢明顯。微軟收購Ally.io以及WorkBoard收購Quantive表明,產業已進入成熟階段,各套件之間的協同效應比快速獲取用戶更為重要。在加拿大和墨西哥,隨著區域部門與美國平台接軌以實現報告標準化,小眾需求正在湧現。
預計亞太地區將實現最快成長,2026年至2031年間的複合年成長率將達到12.45%。中國中大型企業78.3%的OKR採用率清晰地展現了國家主導的數位化進程,但資料本地化法規更有利於國內供應商。印度的外包中心依賴OKR來確保與全球客戶交付成果的一致性,而日本的管治改革則在成果導向框架下提升透明度。東南亞國家正迅速追趕,區域內的獨角獸企業已率先採用OKR體系。
歐洲市場佔有率適中,其中德國、英國和法國占主導地位。 GDPR 的實施增加了對歐盟境內雲端服務的需求,例如 Weekdone 在愛沙尼亞運營,Perdoo 在愛爾蘭運營。各國不同的法規增加了合規成本,並減緩了跨國部署的速度。南美市場小規模。巴西和阿根廷是主導參與者,但面臨貨幣波動和在地化方面的限制。在數位經濟發展藍圖和多語言平台成長的推動下,中東和非洲的採用率正從較低水準逐步提高。然而,語言障礙和頻寬限制仍然阻礙著 OKR 和目標管理軟體市場的進一步滲透。
其他好處:
- Excel格式的市場預測(ME)表
- 3個月的分析師支持
目錄
第1章:引言
- 研究假設和市場定義
- 調查範圍
第2章:調查方法
第3章執行摘要
第4章 市場狀況
- 市場概覽
- 市場促進因素
- 敏捷和遠距工作文化的日益普及。
- 對即時效能視覺化的需求日益成長
- 加大對數位轉型的投資
- 將 OKR(目標與關鍵成果)工具與現有企業軟體生態系統整合
- 專業服務領域績效合約的擴展
- 創業融資的新創公司在 B 輪融資前階段開始大量採用 OKR 標準。
- 市場限制因素
- 雲端採用中的資料安全和隱私問題
- 傳統公司對文化變遷的抵制
- 由於與現有性能管理套件的功能重疊而導致的「工具疲勞」。
- 對當地語言的支持不足阻礙了其在英語國家以外市場的傳播。
- 產業價值鏈分析
- 監理情勢
- 技術展望
- 宏觀經濟因素對市場的影響
- 波特五力分析
第5章 市場規模與成長預測
- 按功能
- 追蹤和可視化
- 協作與合作
- 績效分析
- 整合與自動化
- 報告與洞察
- 其他功能
- 依部署類型
- 基於雲端的
- 現場
- 按組織規模
- 中小企業
- 大公司
- 按行業
- IT/通訊
- BFSI
- 醫療保健和生命科學
- 製造業
- 零售與電子商務
- 其他行業
- 按地區
- 北美洲
- 美國
- 加拿大
- 墨西哥
- 南美洲
- 巴西
- 阿根廷
- 其他南美國家
- 歐洲
- 德國
- 英國
- 法國
- 義大利
- 西班牙
- 俄羅斯
- 其他歐洲國家
- 亞太地區
- 中國
- 印度
- 日本
- 韓國
- 澳洲和紐西蘭
- 其他亞太國家
- 中東
- 沙烏地阿拉伯
- 阿拉伯聯合大公國
- 土耳其
- 其他中東國家
- 非洲
- 南非
- 奈及利亞
- 其他非洲國家
- 北美洲
第6章 競爭情勢
- 市場集中度
- 策略趨勢
- 市佔率分析
- 公司簡介
- WorkBoard Inc.
- Quantive Technologies Inc.
- Betterworks Systems Inc.
- 15Five Inc.
- Perdoo GmbH
- Profit.co Inc.
- Weekdone OU
- Ally Technologies Inc.
- Koan Inc.
- Atiim Inc.
- Peoplebox Inc.
- Engagedly Inc.
- Fitbots OKRs Consulting and Software Private Limited
- Elate Inc.
- Mooncamp Software GmbH
- Zokri Limited
- Cascade Strategy Pty Ltd
- Huminos Technologies Private Limited
- Rhythm Systems Inc.
- Corvisio LLC
第7章 市場機會與未來展望
According to Mordor Intelligence, the OKR and goal management software market size is expected to increase from USD 2.40 billion in 2025 to USD 2.65 billion in 2026 and reach USD 4.38 billion by 2031, growing at a CAGR of 10.59% over 2026-2031.
This report is Segmented by Functionality (Tracking and Visualization, Alignment and Collaboration, Performance Analytics, and More), Deployment Type (Cloud-Based, and On-Premises), Organization Size (Small and Medium Enterprises, and Large Enterprises), Industry Vertical (IT and Telecommunications, and More), and Geography. The Market Forecasts are Provided in Terms of Value (USD).
Global OKR and Goal Management Software Market Trends and Insights
Rising Adoption of Agile and Remote Work Cultures
Hybrid work now exceeds 60% penetration in North America and Europe, exposing the limits of annual goal cycles. Microsoft embedded Ally.io's Objectives and Key Results (OKR) tracker into Teams in 2025, allowing staff to review objectives inside their everyday collaboration hub and accelerating usage at scale. WorkBoard followed by wiring its platform to Microsoft Copilot, letting users query progress in natural language, which removes a major friction point. Betterworks responded in 2026 with a NextGen release that adds more than 400 AI workflows to automate check-ins. Collectively, these moves prove that distributed teams demand asynchronous visibility and continuous alignment, fuelling medium-term growth for the OKR and goal management software market.
Increasing Need for Real-Time Performance Visibility
Boardrooms no longer accept quarter-lag dashboards. Betterworks' AI-Powered Talent Intelligence, launched in May 2026, correlates key-result health with skill gaps, alerting leaders before misses occur.API-first architectures further shorten latency by streaming data directly from CRM, project-management and finance systems. Start-up Brev, fresh from a USD 3.3 million raise in April 2026, auto-updates key results from Slack threads, Jira tickets and meeting transcripts, eliminating the manual entry that derails 90% of enterprises. Real-time insight is therefore a short-term catalyst, especially in tech-driven verticals where competitive cycles compress quickly.
Data Security and Privacy Concerns in Cloud Deployments
Strict regimes such as GDPR, PIPL and sector-specific rules keep many buyers on-premises. Perdoo places infrastructure in Ireland, Weekdone hosts in Estonia and Profit.co offers regional clouds plus on-premises editions for finance and healthcare clients. Yet each extra platform expands the audit surface, deepening IT resistance. High-profile breaches during 2024-2025 crystallized these fears, so security remains a short-term drag on cloud conversion inside the OKR and goal management software market.
Other drivers and restraints analyzed in the detailed report include:
- Growing Investments in Digital Transformation Initiatives
- Integration of OKR Tools With Existing Enterprise Software Ecosystems
- Resistance to Cultural Change in Traditional Enterprises
For complete list of drivers and restraints, kindly check the Table Of Contents.
Segment Analysis
Tracking and Visualization led the OKR and goal management software market size in 2025, but Integrations and Automation is expected to record a 12.01% CAGR through 2031. The pivot reflects customer demand to cut manual updates that waste hours and skew data integrity. Brev's AI agents refresh key results from Slack, Jira and Salesforce, an advance that could save a 500-person firm up to USD 2 million annually. Executives still want clear progress visuals, so dashboards persist, yet they are now embedded within integration layers rather than sold as standalone modules.
Performance Analytics has emerged as the bridge between goals and operational triggers; Betterworks uses predictive flags to prompt managers before slippage turns into failure. Alignment and Collaboration tools grow steadily as hybrid teams need asynchronous coordination, while Reporting and Insights remain vital in regulated industries for audit trails. Niche features such as gamification attract engagement-oriented buyers but hold modest revenue. The net result is a feature stack converging around end-to-end execution, with integrations as the primary purchase driver for the OKR and goal management software market.
On-Premises installations owned 67.41% of OKR and goal management software market share in 2025, yet Cloud-Based solutions are expanding at a 12.89% CAGR. Compliance dictates many on-premises decisions; German banks, for example, cite BaFin guidance that prefers local hosting. Vendors are reacting with hybrid controls. Profit.co achieved FedRAMP Ready status to unlock U.S. federal demand, and Quantive lets enterprises choose AWS regions to isolate data. Nonetheless, SMEs gravitate to SaaS because it cuts capex, speeds deployment and ensures automatic upgrades.
Over time, broader infrastructure modernisation will tilt the balance. Microsoft's embedding of Ally.io into Viva Goals exposes millions of Teams users to native cloud OKRs, normalising remote hosting. Still, cloud growth will play out gradually as regulators refine guidelines and incumbents complete migration roadmaps. The coexistence of both models is therefore assured through at least 2031 inside the OKR and goal management software market.
Complete Report Scope:
- By Functionality
- Tracking and Visualization
- Alignment and Collaboration
- Performance Analytics
- Integrations and Automation
- Reporting and Insights
- Other Functionalities
- By Deployment Type
- Cloud-Based
- On-Premises
- By Organization Size
- Small and Medium Enterprises (SMEs)
- Large Enterprises
- By Industry Vertical
- IT and Telecommunications
- BFSI
- Healthcare and Life Sciences
- Manufacturing
- Retail and eCommerce
- Other Industry Verticals
- By Geography
- North America
- United States
- Canada
- Mexico
- South America
- Brazil
- Argentina
- Rest of South America
- Europe
- Germany
- United Kingdom
- France
- Italy
- Spain
- Russia
- Rest of Europe
- Asia-Pacific
- China
- India
- Japan
- South Korea
- Australia and New Zealand
- Rest of Asia-Pacific
- Middle East
- Saudi Arabia
- United Arab Emirates
- Turkey
- Rest of Middle East
- Africa
- South Africa
- Nigeria
- Rest of Africa
- North America
Geography Analysis
North America retained 37.34% share in 2025, buoyed by the United States' software spending growth forecast of 15.2% for 2026. Consolidation is evident: Microsoft absorbed Ally.io, and WorkBoard bought Quantive, signalling a maturity phase that prioritises cross-suite synergies over rapid user acquisition. Canada and Mexico add niche demand as regional divisions align with U.S. platforms to standardise reporting.
Asia-Pacific enjoys the fastest expansion at a 12.45% CAGR over 2026-2031. China's 78.3% penetration in mid-to-large enterprises exemplifies state-supported digitalisation, though data-localisation rules favour domestic vendors. India's outsourcing hubs rely on OKRs to keep deliverables aligned with global clients, while Japan's governance reforms promote transparency that resonates with outcome frameworks. Southeast Asian economies are catching up as regional unicorns adopt OKR suites early.
Europe contributes mid-tier share, with Germany, the United Kingdom and France leading. GDPR drives demand for EU-hosted clouds, prompting Weekdone to operate from Estonia and Perdoo from Ireland. Divergent national rules raise compliance costs, slowing multi-country rollouts. South America is modest; Brazil and Argentina dominate but face currency volatility and limited localisation. Adoption in the Middle East and Africa grows from a small base, fueled by digital-economy roadmaps and multilingual platform expansions, yet language gaps and bandwidth constraints still hinder broader penetration of the OKR and goal management software market.
- WorkBoard Inc.
- Quantive Technologies Inc.
- Betterworks Systems Inc.
- 15Five Inc.
- Perdoo GmbH
- Profit.co Inc.
- Weekdone OU
- Ally Technologies Inc.
- Koan Inc.
- Atiim Inc.
- Peoplebox Inc.
- Engagedly Inc.
- Fitbots OKRs Consulting and Software Private Limited
- Elate Inc.
- Mooncamp Software GmbH
- Zokri Limited
- Cascade Strategy Pty Ltd
- Huminos Technologies Private Limited
- Rhythm Systems Inc.
- Corvisio LLC
Additional Benefits:
- The market estimate (ME) sheet in Excel format
- 3 months of analyst support
TABLE OF CONTENTS
1 INTRODUCTION
- 1.1 Study Assumptions and Market Definition
- 1.2 Scope of the Study
2 RESEARCH METHODOLOGY
3 EXECUTIVE SUMMARY
4 MARKET LANDSCAPE
- 4.1 Market Overview
- 4.2 Market Drivers
- 4.2.1 Rising Adoption of Agile and Remote Work Cultures
- 4.2.2 Increasing Need for Real-Time Performance Visibility
- 4.2.3 Growing Investments in Digital Transformation Initiatives
- 4.2.4 Integration of OKR (Objectives and Key Results) Tools with Existing Enterprise Software Ecosystems
- 4.2.5 Expansion of Outcome-Based Contracting in Professional Services
- 4.2.6 Surge in Venture-Funded Startups Standardizing OKRs Pre-Series B
- 4.3 Market Restraints
- 4.3.1 Data Security and Privacy Concerns in Cloud Deployments
- 4.3.2 Resistance to Cultural Change in Traditional Enterprises
- 4.3.3 Overlapping Functionality with Existing Performance Management Suites Leading to Tool Fatigue
- 4.3.4 Limited Local Language Support Hindering Adoption in Non-English-Speaking Markets
- 4.4 Industry Value Chain Analysis
- 4.5 Regulatory Landscape
- 4.6 Technological Outlook
- 4.7 Impact of Macroeconomic Factors on the Market
- 4.8 Porter's Five Forces Analysis
- 4.8.1 Threat of New Entrants
- 4.8.2 Bargaining Power of Buyers
- 4.8.3 Bargaining Power of Suppliers
- 4.8.4 Threat of Substitutes
- 4.8.5 Competitive Rivalry
5 MARKET SIZE AND GROWTH FORECASTS (VALUE)
- 5.1 By Functionality
- 5.1.1 Tracking and Visualization
- 5.1.2 Alignment and Collaboration
- 5.1.3 Performance Analytics
- 5.1.4 Integrations and Automation
- 5.1.5 Reporting and Insights
- 5.1.6 Other Functionalities
- 5.2 By Deployment Type
- 5.2.1 Cloud-Based
- 5.2.2 On-Premises
- 5.3 By Organization Size
- 5.3.1 Small and Medium Enterprises (SMEs)
- 5.3.2 Large Enterprises
- 5.4 By Industry Vertical
- 5.4.1 IT and Telecommunications
- 5.4.2 BFSI
- 5.4.3 Healthcare and Life Sciences
- 5.4.4 Manufacturing
- 5.4.5 Retail and eCommerce
- 5.4.6 Other Industry Verticals
- 5.5 By Geography
- 5.5.1 North America
- 5.5.1.1 United States
- 5.5.1.2 Canada
- 5.5.1.3 Mexico
- 5.5.2 South America
- 5.5.2.1 Brazil
- 5.5.2.2 Argentina
- 5.5.2.3 Rest of South America
- 5.5.3 Europe
- 5.5.3.1 Germany
- 5.5.3.2 United Kingdom
- 5.5.3.3 France
- 5.5.3.4 Italy
- 5.5.3.5 Spain
- 5.5.3.6 Russia
- 5.5.3.7 Rest of Europe
- 5.5.4 Asia-Pacific
- 5.5.4.1 China
- 5.5.4.2 India
- 5.5.4.3 Japan
- 5.5.4.4 South Korea
- 5.5.4.5 Australia and New Zealand
- 5.5.4.6 Rest of Asia-Pacific
- 5.5.5 Middle East
- 5.5.5.1 Saudi Arabia
- 5.5.5.2 United Arab Emirates
- 5.5.5.3 Turkey
- 5.5.5.4 Rest of Middle East
- 5.5.6 Africa
- 5.5.6.1 South Africa
- 5.5.6.2 Nigeria
- 5.5.6.3 Rest of Africa
- 5.5.1 North America
6 COMPETITIVE LANDSCAPE
- 6.1 Market Concentration
- 6.2 Strategic Moves
- 6.3 Market Share Analysis
- 6.4 Company Profiles (includes Global Level Overview, Market Level Overview, Core Segments, Financials as available, Strategic Information, Market Rank/Share, Products and Services, Recent Developments)
- 6.4.1 WorkBoard Inc.
- 6.4.2 Quantive Technologies Inc.
- 6.4.3 Betterworks Systems Inc.
- 6.4.4 15Five Inc.
- 6.4.5 Perdoo GmbH
- 6.4.6 Profit.co Inc.
- 6.4.7 Weekdone OU
- 6.4.8 Ally Technologies Inc.
- 6.4.9 Koan Inc.
- 6.4.10 Atiim Inc.
- 6.4.11 Peoplebox Inc.
- 6.4.12 Engagedly Inc.
- 6.4.13 Fitbots OKRs Consulting and Software Private Limited
- 6.4.14 Elate Inc.
- 6.4.15 Mooncamp Software GmbH
- 6.4.16 Zokri Limited
- 6.4.17 Cascade Strategy Pty Ltd
- 6.4.18 Huminos Technologies Private Limited
- 6.4.19 Rhythm Systems Inc.
- 6.4.20 Corvisio LLC
7 MARKET OPPORTUNITIES AND FUTURE OUTLOOK
- 7.1 White-Space and Unmet-Need Assessment

 核心人力資源軟體市場:依模組、定價模式、人力資源營運模式、部署模式、企業規模和產業分類-2026-2032年全球市場預測
 人力資源合規軟體:市場佔有率分析、產業趨勢與統計及成長預測(2026-2031 年)缺勤管理軟體:市佔率分析、產業趨勢與統計及成長預測(2026-2031 年)北美人力資源合規軟體:市場佔有率分析、產業趨勢與統計及成長預測(2026-2031 年)員工入職前跟進和新員工入職自動化平台:市場佔有率分析、行業趨勢和統計數據以及成長預測(2026-2031 年)歐洲員工入職:市場佔有率分析、產業趨勢與統計及成長預測(2026-2031 年)核心人力資源軟體:市場佔有率分析、產業趨勢與統計、成長預測(2026-2031)
 人力資源管理軟體市場 - 全球產業規模、佔有率、趨勢、機會、預測:按部署類型、組織規模、類型、最終用戶、地區和競爭對手分類,2021-2031 年
 員工績效管理軟體市場規模、佔有率和趨勢分析報告:按組件、部署類型、企業規模、最終用途、地區和細分市場預測(2026-2033 年)
 2026年全球人力資源軟體市場報告