

 |
市場調查報告書
商品編碼
2066651
北美暖通空調市場:市佔率分析、產業趨勢與統計及成長預測(2026-2031 年)North America Air Conditioning Equipment - Market Share Analysis, Industry Trends & Statistics, Growth Forecasts (2026 - 2031) |
||||||
※ 本網頁內容可能與最新版本有所差異。詳細情況請與我們聯繫。
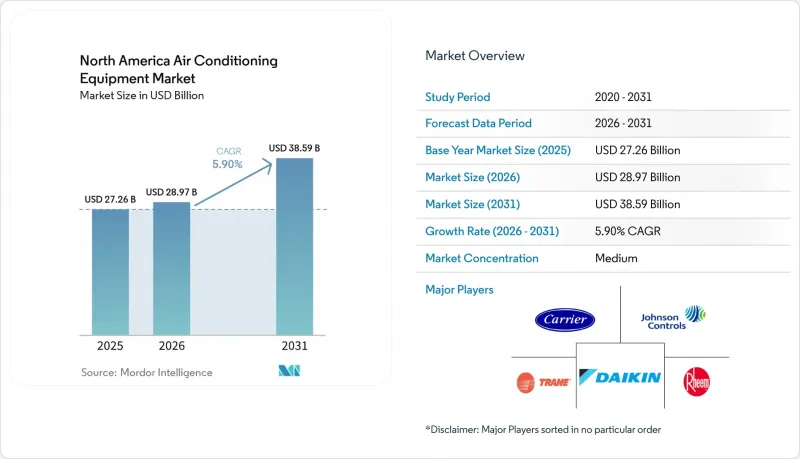
根據 Mordor Intelligence 預測,北美空調設備市場規模將從 2025 年的 272.6 億美元成長到 2026 年的 289.7 億美元,然後在 2031 年達到 385.9 億美元,2026 年至 2031 年的複合年成長率為 5.9%。
本報告按設備類型(例如,單元式空調)、冷媒類型(例如,R-410A)、製冷量(例如,低於12,000 BTU/小時)、能源效率(例如,低效率)、最終用戶(例如,住宅)、安裝類型(例如,新建建築)、銷售管道(例如,直銷)和地區進行細分。市場預測以美元計價。
北美暖通空調市場趨勢與洞察
恢復稅額扣抵和州級退稅計劃
根據《通貨膨脹控制法案》擴大的2000美元聯邦稅額扣抵,已將「能源之星」最高效認證系統的投資回收期縮短了一半,使提前更換更具經濟吸引力。加州和紐約州推出了銷售點返利,可將總安裝成本降低高達三分之一。這些獎勵共同將住宅的平均更換週期從10年縮短至7年,提升了暖通空調市場的基準需求。電力公司目前正將激勵資格與參與獎勵需量反應掛鉤,將數千台連網電器整合到自動抑低尖峰負載計畫中,這也有助於檢驗製造商的效能數據。
商業建築老舊屋頂機組的更換需求
在2005年至2010年建築熱潮期間安裝的屋頂空調機組故障率高達兩位數。業主們正在比較更換同等配置但經過升級的機型,這些升級機型配備了變速壓縮機和節熱器控制裝置,可降低高達30%的能耗。不斷上漲的電價和企業範圍2排放目標促使業主們選擇更有效率的維修,從而帶動了中噸位空調機組的出貨量和服務合約收入的成長。鳳凰城、亞特蘭大和達拉斯等次市場佔據了此次更換熱潮的很大一部分,也帶動了經銷商網路對零件和維修服務的需求。
由於SEER2和AWEF合規性要求,OEM廠商的利潤率面臨成本壓力。
更嚴格的SEER2測試程序導致公佈的能源效率等級下降了高達8%,迫使製造商重新設計盤管、風扇和閥門。這些零件升級將使零件成本增加150至300美元,導致2024年至2025年間毛利率下降1.2個百分點。規模較小的區域品牌已退出競爭激烈的產品線,縮小了供應商規模,而大型製造商則集中了議價能力。
細分市場分析
2025年,單元式空調系統在暖通空調市場佔據46.19%的佔有率,這主要得益於住宅維修需求的成長以及建築商對其的熟悉程度。然而,預計到2031年,變冷媒流量(VRF)平台將以6.78%的複合年成長率推動市場成長。隨著製造商實現在地化生產,初始成本溢價正在降低,開發商也越來越關注區域性舒適度,這可以將尖峰負載降低高達三分之一。無管道迷你分離式空調在難以安裝管道的住宅和都市區維修項目中正逐漸成為主流。屋頂式機組仍然是倉庫和大型零售商店的基礎,但模組化VRF設計在需要運行柔軟性的混合用途開發項目的規格選擇中正逐漸佔據優勢。
專案開發商越來越重視的不僅是初始成本,還有整個生命週期的營運成本。因此,在計算十年期的年度節能效益時,VRF系統的競標通常優於定風量系統。冷卻器和PTAC機組雖然仍佔據一定的市場佔有率,但在核心用途之外的應用領域正逐漸被取代。整體競爭格局正朝著「舒適控制生態系統」的方向發展,該系統將暖通空調、暖氣和通風整合到一個統一的服務模式下,從而鞏固了VRF系統在暖通空調設備市場的領先地位。
預計到2025年,R-410A將佔已安裝冷媒總量的57.25%,但隨著分階段減排配額的日益嚴格,其佔有率正在下降。 R-32的全球暖化潛勢值比R-410A低68%,其年複合成長率(CAGR)為6.55%,主要得益於其作為單一成分的簡易性,便於維護和回收。 R-454B由於與傳統的R-410A設計幾乎完全相容,能夠最大程度地減少模具更換,因此吸引了希望減少模具更換的製造商的關注,但供應瓶頸阻礙了其在2025年的推廣應用。由於R-454B被歸類為A2L級輕度易燃材料,承包商不得不投資新的洩漏檢測和硬焊工藝,導致培訓成本增加,而認證技術人員的業務收益卻在增加。
冷媒轉型導致產品藍圖出現分歧,一些品牌正轉向為其設備申請雙重認證。終端用戶推遲更換,直到供應波動穩定,大規模商業項目的決策週期也延長。同時,冷媒回收再利用市場正逐漸成為一項輔助收入來源,冷媒回收公司銷售的閉合迴路服務合約與企業的永續發展目標相契合。預計這一轉型期將持續到2029年,冷媒供應仍將是整個暖通空調市場採購決策中的首要風險因素。
到2025年,製冷量在12,001至60,000 BTU之間的空調機組將佔暖通空調市場規模的41.68%,滿足大多數獨棟住宅和小規模商業場所的安裝需求。冷凍量低於12,000 BTU的產品(幾乎全部為無管道迷你分離式空調)預計將以6.72%的複合年成長率成長,這主要得益於都市區空地再開發、配套住宅法規以及老舊公寓的維修。採用標準120伏電路的緊湊型壓縮機簡化了住宅的安裝核准流程,並減少了電氣設備升級的需求。
光是加州的區域規劃改革預計到2025年就將導致18,000個住宅的發放,這些許可證通常規定每個單元安裝一到兩台小型分離式空調。為此,經銷商正在擴大其產品種類,這將增加庫存持有成本,但也為交叉銷售控制設備和安裝配件創造了更多機會。在高階市場,冷氣量超過60,000 BTU的系統在物流中心和資料中心仍發揮至關重要的作用,但由於銷售週期較長,單價居高不下,而整體銷售量成長緩慢。
其他好處:
- Excel格式的市場預測(ME)表
- 3個月的分析師支持
目錄
第1章:引言
- 研究假設和市場定義
- 調查範圍
第2章:調查方法
第3章執行摘要
第4章 市場狀況
- 市場概覽
- 市場促進因素
- 恢復稅額扣抵和州級退稅計劃
- 商業建築中老舊屋頂空調機組的更換需求。
- 智慧恆溫器和家庭自動化生態系統的快速發展
- 在寒冷氣候下,對熱泵的獎勵正在推動可逆系統的轉變。
- 提升資料中心冷卻能力(邊緣和超大規模)
- 極端高溫導致需要空調的天數增加
- 市場限制因素
- SEER2和AWEF監理合規成本對OEM利潤率帶來的壓力
- 根據《基加利修正案》逐步減少氫氟碳化合物冷媒的使用
- 電網擁塞及需量反應處罰
- 暖通空調安裝和性能驗證方面技術純熟勞工短缺。
- 產業價值鏈分析
- 監理情勢
- 技術展望
- 宏觀經濟因素對市場的影響
- 波特五力分析
- 分銷通路分析
第5章 市場規模與成長預測
- 依設備類型
- 單元空調
- 風管分離系統
- 無管道迷你分離式空調
- 室內整合式和屋頂安裝式
- 室內空調
- 包裝式終端空調
- 冷卻器
- 可變冷媒流量(VRF)系統
- 單元空調
- 依冷媒類型
- R-410A
- R-32
- R-454B 和 R-466A(下一代低全球暖化潛勢值冷媒)
- 依處理能力(BTU/小時)
- 不足12000(不到1噸)
- 12,001–60,000(1–5噸)
- 超過 60,000(超過 5 噸)
- 基於效率的評估(SEER 評級)
- 低效率(SEER 13-15)
- 中等效率(16-19 SEER)
- 高效率(SEER 20 或更高 / 相當於 SEER 2)
- 最終用戶
- 住宅
- 商業的
- 產業
- 按安裝類型
- 新建工程
- 更換/維修
- 按銷售管道
- 直接銷售(從原始設備製造商到承包商)
- 零售/電子商務
- 批發商/分銷商
- 國家
- 美國
- 加拿大
- 墨西哥
第6章 競爭情勢
- 市場集中度
- 策略趨勢
- 市佔率分析
- 公司簡介
- Daikin Industries Ltd.
- Carrier Global Corp.
- Trane Technologies plc
- Johnson Controls International plc
- Rheem Manufacturing Co.
- Lennox International Inc.
- Mitsubishi Electric Corp.
- LG Electronics Inc.
- Midea Group Co., Ltd.
- Electrolux AB
- Systemair AB
- Robert Bosch GmbH
- Whirlpool Corp.
- GE Appliances
- Fujitsu General Ltd.
- Panasonic Corp.
- Samsung Electronics Co., Ltd.
- Haier Smart Home Co., Ltd.
- Danby Products Ltd.
- Schneider Electric SE
第7章 市場機會與未來展望
According to Mordor Intelligence, the north america air conditioning equipment market size is expected to grow from USD 27.26 billion in 2025 to USD 28.97 billion in 2026 and is forecast to reach USD 38.59 billion by 2031 at 5.9% CAGR over 2026-2031.
This report is Segmented by Equipment Type (Unitary Air Conditioners, and More), Refrigerant Type (R-410A, and More), Capacity (Less Than 12, 000 BTU Per Hr, and More), Efficiency (Low, and More), End User (Residential, and More), Installation Type (New Construction, and More), Sales Channel (Direct, and More), and Geography. The Market Forecasts are Provided in Terms of Value (USD).
North America Air Conditioning Equipment Market Trends and Insights
Tax-Credit Reinstatement and State-Level Rebate Programs
Expanded USD 2,000 federal credits under the Inflation Reduction Act halve payback periods for ENERGY STAR Most Efficient systems, making early replacement financially attractive. California and New York add point-of-sale rebates that trim total installed cost by up to one-third. Combined incentives shorten the average residential replacement cycle from ten to seven years, elevating baseline demand within the air conditioning equipment market. Utilities now tie eligibility to demand-response enrolment, channelling thousands of connected units into automated peak-shaving programs that in turn validate performance data for manufacturers.
Replacement Demand for Aging Rooftop Units in Commercial Buildings
Rooftop units installed during the 2005-2010 building surge are failing at double-digit rates. Building owners weigh like-for-like swaps against upgrades featuring variable-speed compressors and economizer controls that trim energy use by up to 30%. Rising utility prices and corporate Scope 2 reduction targets are tipping decisions toward high-efficiency retrofits, boosting mid-tonnage shipments and service contract revenue. Secondary markets such as Phoenix, Atlanta, and Dallas account for a sizable share of this replacement wave, which sustains parts and maintenance demand in distributor networks.
SEER2 and AWEF Compliance Cost Pressures on OEM Margins
Stricter SEER2 test procedures reduced published ratings by up to 8%, pushing manufacturers to redesign coils, blowers, and valves. Component upgrades added USD 150-300 to bill-of-materials costs, shaving 1.2 percentage points off gross margins in 2024-2025. Smaller regional brands lacking scale exited price-sensitive product lines, tightening the supply base but also concentrating negotiating power among the top manufacturers.
Other drivers and restraints analyzed in the detailed report include:
- Rapid Growth of Smart-Thermostat and Home-Automation Ecosystems
- Heat-Pump Incentives Shifting Mix Toward Reversible Systems
- Kigali Amendment Phasedown of HFC Refrigerants
For complete list of drivers and restraints, kindly check the Table Of Contents.
Segment Analysis
Unitary systems delivered 46.19% air conditioning equipment market share in 2025, anchored by residential retrofits and builder familiarity. Variable refrigerant flow platforms, however, are pacing the field at 6.78% CAGR through 2031. First-cost premiums are narrowing as manufacturers localize production and as developers value zoned comfort that lowers peak load by up to one-third. Ductless mini-splits dominate accessory-dwelling-unit and urban retrofit projects where ductwork is impractical. Packaged rooftops remain the backbone of warehousing and big-box retail, but modular VRF designs are winning specifications in mixed-use developments seeking operational flexibility.
Project developers increasingly evaluate lifecycle operating expense instead of upfront cost alone. Consequently, VRF bids frequently overtake constant-volume alternatives when energy savings are annualized over ten years. Chillers and PTACs hold niche positions yet face gradual displacement outside their core applications. The broader competitive landscape is shifting toward integrated comfort-control ecosystems that combine air conditioning, heating, and ventilation under a unified service model, reinforcing premium positioning within the air conditioning equipment market.
R-410A retained 57.25% of the installed base in 2025, but its share is eroding as phasedown quotas tighten. R-32, with a 68% lower global-warming potential, is expanding at 6.55% CAGR, propelled by single-component simplicity that eases service and reclamation. R-454B offers near drop-in compatibility for legacy R-410A designs, drawing interest from manufacturers seeking minimal tooling changes, yet supply bottlenecks hampered 2025 rollouts. Mildly flammable A2L classifications oblige contractors to invest in new leak-detection and brazing protocols, increasing training expenses while lifting service revenue for certified technicians.
The refrigerant transition splinters product roadmaps, encouraging some brands to dual-certify equipment. End users delay replacements until supply volatility subsides, lengthening decision cycles for large commercial projects. Meanwhile, reclaim and reuse markets are forming secondary profit streams, with refrigerant recovery firms marketing closed-loop service contracts that align with corporate sustainability goals. This transition period is likely to persist through 2029, keeping refrigerant availability a top-of-mind risk factor in procurement decisions across the air conditioning equipment market.
Units rated 12,001-60,000 BTU accounted for 41.68% of the air conditioning equipment market size in 2025, underpinning most single-family and small-commercial installations. Sub-12,000 BTU products, almost all ductless mini splits, are charting a 6.72% CAGR on the back of urban infill housing, accessory dwelling ordinances, and aging apartment retrofits. Compact compressors running on standard 120-volt circuits simplify homeowner installation approvals and reduce electrical upgrades.
California's zoning reforms alone drove 18,000 accessory dwelling permits in 2025, typically specifying one or two mini-split heads per structure. Distributors respond by broadening SKU assortments, which raises inventory carrying costs but increases cross-sell opportunities for controls and mounting accessories. At the top end, systems above 60,000 BTU maintain relevance in logistics hubs and data centers, yet their longer sales cycles moderate overall volume growth even as per-unit revenue remains elevated.
List of Companies Covered in this Report:
- Daikin Industries Ltd.
- Carrier Global Corp.
- Trane Technologies plc
- Johnson Controls International plc
- Rheem Manufacturing Co.
- Lennox International Inc.
- Mitsubishi Electric Corp.
- LG Electronics Inc.
- Midea Group Co., Ltd.
- Electrolux AB
- Systemair AB
- Robert Bosch GmbH
- Whirlpool Corp.
- GE Appliances
- Fujitsu General Ltd.
- Panasonic Corp.
- Samsung Electronics Co., Ltd.
- Haier Smart Home Co., Ltd.
- Danby Products Ltd.
- Schneider Electric SE
Additional Benefits:
- The market estimate (ME) sheet in Excel format
- 3 months of analyst support
TABLE OF CONTENTS
1 INTRODUCTION
- 1.1 Study Assumptions and Market Definition
- 1.2 Scope of the Study
2 RESEARCH METHODOLOGY
3 EXECUTIVE SUMMARY
4 MARKET LANDSCAPE
- 4.1 Market Overview
- 4.2 Market Drivers
- 4.2.1 Tax-Credit Reinstatement and State-Level Rebate Programs
- 4.2.2 Replacement Demand for Aging Rooftop Units in Commercial Buildings
- 4.2.3 Rapid Growth of Smart-Thermostat and Home-Automation Ecosystems
- 4.2.4 Heat-Pump Incentives Shifting Mix Toward Reversible Systems (Cold-Climate)
- 4.2.5 Data-Center Cooling Capacity Additions (Edge and Hyperscale)
- 4.2.6 Extreme-Heat Events Increasing Cooling-Degree Days
- 4.3 Market Restraints
- 4.3.1 SEER2 and AWEF Compliance Cost Pressures on OEM Margins
- 4.3.2 Kigali Amendment Phasedown of HFC Refrigerants
- 4.3.3 Electrical-Grid Congestion and Demand-Response Penalties
- 4.3.4 Skilled-Labor Shortages for HVAC Installation and Retro-Commissioning
- 4.4 Industry Value-Chain Analysis
- 4.5 Regulatory Landscape
- 4.6 Technological Outlook
- 4.7 Impact of Macroeconomic Factors on the Market
- 4.8 Porter's Five Forces Analysis
- 4.8.1 Bargaining Power of Suppliers
- 4.8.2 Bargaining Power of Buyers/Consumers
- 4.8.3 Threat of New Entrants
- 4.8.4 Threat of Substitutes
- 4.8.5 Intensity of Competitive Rivalry
- 4.9 Distribution Channel Analysis
5 MARKET SIZE AND GROWTH FORECASTS (VALUE)
- 5.1 By Equipment Type
- 5.1.1 Unitary Air Conditioners
- 5.1.1.1 Ducted Split Systems
- 5.1.1.2 Ductless Mini-Splits
- 5.1.1.3 Indoor Packaged and Rooftops
- 5.1.2 Room Air Conditioners
- 5.1.3 Packaged Terminal Air Conditioners
- 5.1.4 Chillers
- 5.1.5 Variable Refrigerant Flow (VRF) Systems
- 5.1.1 Unitary Air Conditioners
- 5.2 By Refrigerant Type
- 5.2.1 R-410A
- 5.2.2 R-32
- 5.2.3 R-454B and R-466A (Next-Gen Low-GWP)
- 5.3 By Capacity (BTU/hr)
- 5.3.1 Less than 12,000 (Less Than 1 Ton)
- 5.3.2 12,001-60,000 (1-5 Tons)
- 5.3.3 More than 60,000 (More than 5 Tons)
- 5.4 By Efficiency (SEER Rating)
- 5.4.1 Low Efficiency (13-15 SEER)
- 5.4.2 Medium Efficiency (16-19 SEER)
- 5.4.3 High Efficiency (More than 20 SEER/SEER2 Equivalent)
- 5.5 By End User
- 5.5.1 Residential
- 5.5.2 Commercial
- 5.5.3 Industrial
- 5.6 By Installation Type
- 5.6.1 New Construction
- 5.6.2 Replacement / Retrofit
- 5.7 By Sales Channel
- 5.7.1 Direct (OEM-to-Contractor)
- 5.7.2 Retail / E-Commerce
- 5.7.3 Wholesalers / Distributors
- 5.8 By Country
- 5.8.1 United States
- 5.8.2 Canada
- 5.8.3 Mexico
6 COMPETITIVE LANDSCAPE
- 6.1 Market Concentration
- 6.2 Strategic Moves
- 6.3 Market Share Analysis
- 6.4 Company Profiles (includes Global Level Overview, Market Level Overview, Core Segments, Financials as available, Strategic Information, Market Rank/Share, Products and Services, Recent Developments)
- 6.4.1 Daikin Industries Ltd.
- 6.4.2 Carrier Global Corp.
- 6.4.3 Trane Technologies plc
- 6.4.4 Johnson Controls International plc
- 6.4.5 Rheem Manufacturing Co.
- 6.4.6 Lennox International Inc.
- 6.4.7 Mitsubishi Electric Corp.
- 6.4.8 LG Electronics Inc.
- 6.4.9 Midea Group Co., Ltd.
- 6.4.10 Electrolux AB
- 6.4.11 Systemair AB
- 6.4.12 Robert Bosch GmbH
- 6.4.13 Whirlpool Corp.
- 6.4.14 GE Appliances
- 6.4.15 Fujitsu General Ltd.
- 6.4.16 Panasonic Corp.
- 6.4.17 Samsung Electronics Co., Ltd.
- 6.4.18 Haier Smart Home Co., Ltd.
- 6.4.19 Danby Products Ltd.
- 6.4.20 Schneider Electric SE
7 MARKET OPPORTUNITIES AND FUTURE OUTLOOK
- 7.1 White-Space and Unmet-Need Assessment
 空調系統市場:2026-2032年全球市場預測(依產品類型、技術、冷氣、組件、冷媒類型、能源效率、應用和銷售管道)
 空調系統市場規模、佔有率和趨勢分析報告:按類型、技術、應用、地區和細分市場預測(2026-2033 年)
 空調系統市場機會、成長要素、產業趨勢分析及2026-2035年預測。空調市場:2026-2032年全球市場預測(依銷售管道、技術、冷氣量、產品類型及最終用戶分類)
 全球空調系統市場規模、佔有率、趨勢和成長分析報告(2026-2034年)
 空調系統市場:按類型、技術、最終用戶和地區分類空調設備市場:2026年至2032年全球預測(依產品類型、技術、容量、組件、最終用戶及通路分類)
 2026年全球蒸氣和空調供應市場報告氟泵空調市場:按類型、容量、技術、應用、最終用途和分銷管道分類,全球預測,2026-2032年
 住宅風管設計軟體市場分析及預測(至2035年):依類型、產品類型、服務、技術、組件、應用、部署類型、最終用戶、模組及功能分類