


 |
市場調查報告書
商品編碼
2073582
空調設備:市場佔有率分析、產業趨勢與統計、成長預測(2026-2031)Air Conditioning Equipment - Market Share Analysis, Industry Trends & Statistics, Growth Forecasts (2026 - 2031) |
||||||

※ 本網頁內容可能與最新版本有所差異。詳細情況請與我們聯繫。
據 Mordor Intelligence 稱,2026 年空調設備市場價值為 1,314.5 億美元,預計到 2031 年將達到 1,707.4 億美元,複合年成長率為 5.37%。
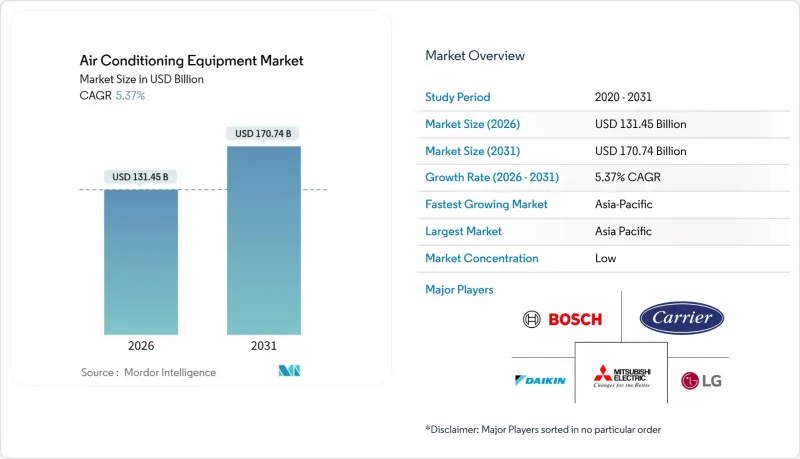
本報告按產品類型(分離式和多聯式空調系統、變冷劑流量(VRF)系統等)、技術(變頻系統和非變頻系統)、最終用戶(住宅、商業、工業)、製冷量(10噸以下、11-18噸及其他)、配銷通路(直銷及其他)和地區進行細分。市場預測以美元(USD)為單位。
全球暖通空調市場趨勢與洞察
全球氣溫上升和頻繁的熱浪
氣候記錄顯示,2024年將是有紀錄以來最熱的一年,南亞和中東地區超過攝氏40度C的日數將急劇增加。印度二線城市正在加快住宅冷水機組的安裝,沿岸地區的醫院也正在部署冗餘冷水機組,以避免暖氣系統停機。冷卻度日數的增加推動了設備的持續升級和容量的提升,使暖通空調市場保持上升趨勢。受熱地區的電力公司也在重新評估尖峰時段電價,促使建築業主採用高效率的VRF和變頻系統。長期氣候預測顯示,到2040年,冷氣度日數將增加20%至30%,這將導致結構性需求的成長,而非週期性升級。
政府制定的空調設備能源效率標準和補貼
美國SEER2標準、歐盟生態設計法規以及中國的GB 21455-2024標準都在不斷提高最低能源效率標準。在印度,政府正在推行津貼計劃,以覆蓋變頻設備額外成本的20%至30%;而在新興亞洲國家,政府正在實施與季節能效比(SEER)掛鉤的補貼計劃,從而縮小變頻機型與恆速機型之間的價格差距。製造商正迅速將產品線轉向變頻壓縮機,零件供應商也正在擴大變速驅動裝置的生產,加速了暖通空調市場的技術轉型。更嚴格的標準有效地縮短了非變頻設備的淘汰週期,推動了市場向高利潤產品的轉變。
銅和半導體價格的波動對OEM廠商的利潤率帶來了壓力。
2024年,銅價在每噸9100美元至10,200美元之間波動,導致單位組件成本上漲3至8美元,毛利率下降高達180個基點。功率模組的半導體前置作業時間長達26週,延緩了逆變器產品的上市。大型企業透過垂直整合(例如投資越南的銅管工廠)來規避風險,而缺乏規避能力的小型品牌則面臨負營運利潤的風險。持續的價格波動可能會抑制新興市場對價格敏感的需求,從而限制空調設備市場的短期成長。
細分市場分析
預計變冷劑流量(VRF)平台將以6.73%的複合年成長率成長,高於整體市場(5.37%),使其成為2026年至2031年間暖通空調市場成長最快的細分市場。在新興市場,分離式和多聯式空調系統仍然佔據住宅市場的銷售主導地位,因為這些市場普遍採用單間製冷。 30層樓以上的高層建築傾向於選擇VRF系統,以實現區域控制、能源回收和提高占地面積利用率,這正在加強與直銷商的合作關係。
公共產業擴大補貼計畫、更嚴格的能源法規以及逆變器成本的降低,正在縮小傳統分離式空調機組和VRF微型模組之間的價格差距。一台室外機最多可連接64個室內風扇盤管,從而滿足多功能樓層平面圖中不同的負載需求。同時,在北美小規模商業領域,屋頂式機組的穩定更新需求正在推動市場成長;而離心式和螺桿式冷卻器(500噸以上)則透過滿足製藥倉庫和半導體製造廠等對溫度穩定性要求極高(低於1攝氏度)的場所的需求,豐富了暖通空調市場。
預計到 2025 年,變頻壓縮機的出貨量將佔 68.86%,年成長率為 6.53%,預計到 2031 年,其在整體空調設備市場的佔有率將進一步擴大。非變頻機型仍在農村地區和出租物業中使用,但隨著補貼計劃縮小額外成本差距,其佔有率正在逐年下降。
人工智慧控制器現在可以即時分析天氣狀況、電價時段和用電量,進一步降低8%至12%的公用事業成本。需量反應整合使建築業主能夠將減少的負載變現。雖然在非洲和拉丁美洲電壓不穩定的地區,固定速度系統仍然可行,但在規模經濟和政策壓力的推動下,預計到2030年,全球逆變器普及率將超過80%。
區域分析
預計到2025年,亞太地區將佔全球空調設備銷售額的40.32%,複合年成長率達8.43%,在空調設備市場中表現優於其他所有地區。儘管中國市場成長放緩,主要城市市場飽和度上升,但在印度、印尼和越南,受熱浪和電網接入改善的推動,空調安裝量仍保持兩位數成長。大型VRF系統在雅加達和馬尼拉等高層高層建築林立的城市佔據主導地位,而成熟的日本市場則專注於高階空氣清淨功能。在澳洲商業領域,屋頂機組正在進行維修,以符合2022年修訂的能源效率標準。
受設備更新換代、熱泵普及以及企業淨零排放目標等因素的推動,北美和歐洲的暖通空調市場正以每年4%至5%的速度成長。預計到2024年,美國住宅空調系統的出貨量將超過820萬台,而《通膨控制法案》也持續鼓勵用戶維修到熱泵系統。歐盟法規要求在2030年非住宅建築實現近零能耗,這正在推動德國、法國和英國的VRF(變頻多聯機)系統升級。
預計中東和非洲市場將成長6-7%。杜拜和利雅德的區域供冷網路正在推動對大容量冷卻器的需求,而在撒哈拉以南非洲,離網式太陽能分離式空調系統在電力短缺的社區正日益普及。南美市場預計將成長5-6%,主要受巴西住宅需求以及阿根廷在電力補貼取消後商業設施維修。總體而言,這些區域趨勢正在推動暖通空調市場呈現多元化的成長模式。
其他好處:
- Excel格式的市場預測(ME)表
- 3個月的分析師支持
目錄
第1章:引言
- 研究假設和市場定義
- 調查範圍
第2章:調查方法
第3章執行摘要
第4章 市場狀況
- 市場概覽
- 市場促進因素
- 全球氣溫上升和熱浪發生頻率增加
- 政府制定的空調設備能源效率標準和補貼
- 新興特大城市中都市區高層建築的快速成長
- 邊緣和超大規模資料中心的擴張正在推動精密冷卻的需求。
- 透過人工智慧驅動的預測性維護合約降低生命週期成本。
- 在電力短缺地區,對離網式太陽能分離式空調的需求正在成長。
- 市場限制因素
- 銅和半導體價格的波動對OEM廠商的利潤率帶來了壓力。
- 根據《基加利修正案》加速分階段減少氫氟碳化合物的相關合規成本
- 變頻和VRF系統認證的暖通空調技術人員長期短缺
- 電網脫碳政策支持被動冷卻和區域冷卻以外的替代方案。
- 產業供應鏈分析
- 監理情勢
- 技術展望
- 波特五力分析
- 宏觀經濟因素對市場的影響
第5章 市場規模與成長預測
- 依產品類型
- 分離式和多聯式系統
- 可變冷媒流量(VRF)系統
- 包裝式和屋頂式機組
- 冷卻器
- 透過技術
- 逆變器系統
- 非變頻系統
- 最終用戶
- 住宅
- 商業
- 產業
- 按體積(冷凍噸)
- 10噸或以下
- 11-18噸
- 19-26噸
- 超過26噸
- 透過分銷管道
- 直銷
- 經銷商/零售商
- 線上
- 按地區
- 北美洲
- 美國
- 加拿大
- 墨西哥
- 南美洲
- 巴西
- 阿根廷
- 其他南美國家
- 歐洲
- 德國
- 法國
- 英國
- 義大利
- 西班牙
- 其他歐洲國家
- 亞太地區
- 中國
- 日本
- 印度
- 韓國
- 澳洲
- 其他亞太國家
- 中東和非洲
- 中東
- 沙烏地阿拉伯
- 阿拉伯聯合大公國
- 土耳其
- 其他中東國家
- 非洲
- 南非
- 埃及
- 奈及利亞
- 其他非洲國家
- 中東
- 北美洲
第6章 競爭情勢
- 市場集中度
- 策略趨勢
- 市佔率分析
- 公司簡介
- Daikin Industries Ltd.
- Gree Electric Appliances Inc. of Zhuhai
- Midea Group Co., Ltd.
- Carrier Global Corporation
- Trane Technologies plc
- Johnson Controls International plc
- Mitsubishi Electric Corporation
- LG Electronics Inc.
- Samsung Electronics Co., Ltd.
- Haier Smart Home Co., Ltd.
- Panasonic Holdings Corporation
- Lennox International Inc.
- Fujitsu General Ltd.
- Toshiba Carrier Corporation
- Hitachi-Johnson Controls Air Conditioning, Inc.
- Rheem Manufacturing Company
- Bosch Thermotechnology GmbH
- Hisense International Co., Ltd.
- AUX Group Co., Ltd.
第7章 市場機會與未來展望
According to Mordor Intelligence, the air conditioning equipment market size is valued at USD 131.45 billion in 2026 and is projected to reach USD 170.74 billion by 2031, reflecting a 5.37% CAGR.
This report is Segmented by Product Type (Split and Multi-Split Systems, Variable Refrigerant Flow Systems, and More), Technology (Inverter Systems, and Non-Inverter Systems), End-User (Residential, Commercial, and Industrial), Capacity (Up To 10 Tons, 11-18 Tons, and More), Distribution Channel (Direct Sales, and More), and Geography. The Market Forecasts are Provided in Terms of Value (USD).
Global Air Conditioning Equipment Market Trends and Insights
Escalating Global Temperatures and Extreme-Heat Frequency
Climate records show 2024 as the hottest year to date, and the frequency of heat days above 40 °C is rising sharply in South Asia and the Middle East. Residential penetration is accelerating in tier-2 Indian cities, and hospitals in the Gulf are adding redundant chiller arrays to avert thermal shutdowns. Higher cooling-degree days ensure sustained equipment replacement and capacity additions, keeping the air conditioning equipment market on an upward trajectory. Utilities in heat-stressed regions are also revising peak tariffs, incentivizing building owners to adopt high-efficiency VRF and inverter systems. Long-term climate projections pointing to 20-30% more cooling-degree days by 2040 translate into structural demand rather than cyclical replacement.
Government Energy-Efficiency Standards and Cooling-Appliance Subsidies
SEER2 thresholds in the United States, Ecodesign rules in the European Union, and upgraded GB 21455-2024 requirements in China collectively tighten minimum efficiency baselines. Subsidy programs covering 20-30% of the incremental inverter cost in India and rebate schemes tied to seasonal energy-efficiency ratios in emerging Asia are closing the price gap with fixed-speed models. Manufacturers are rapidly shifting portfolios to inverter compressors, and component suppliers are scaling variable-speed drives, reinforcing the air conditioning equipment market's technology transition. Tightened standards effectively shorten the obsolescence cycle for non-inverter units, creating a pull-through effect for higher-margin products.
Volatile Copper and Semiconductor Prices Squeezing OEM Margins
Copper prices swung between USD 10,200 and USD 9,100 per metric ton in 2024, adding USD 3-8 to component costs per unit and compressing gross margins by up to 180 basis points. Semiconductor lead times for power modules reached 26 weeks, delaying inverter launches. Large players are hedging through vertical integration, exemplified by a Vietnamese copper-tube mill investment, whereas smaller brands without hedging capacity risk negative operating margins. Persistent volatility could dampen price-sensitive demand in emerging markets, limiting near-term growth in the air conditioning equipment market.
Other drivers and restraints analyzed in the detailed report include:
- Urban High-Rise Construction Surge in Emerging Megacities
- Edge and Hyperscale Data-Center Expansion Boosting Precision Cooling Demand
- Kigali Amendment-Driven Accelerated HFC Phase-Down Compliance Costs
For complete list of drivers and restraints, kindly check the Table Of Contents.
Segment Analysis
Variable refrigerant flow platforms generated a 6.73% CAGR outlook versus the overall 5.37%, making them the fastest-rising segment within the air conditioning equipment market size for the 2026-2031 window. Split and multi-split units still dominate revenue because single-room cooling prevails in emerging residential settings. Developers of 30-plus-story towers prefer VRF for zone control, energy recovery, and floor-space gains, reinforcing direct-sales relationships.
Expanded utility rebates, heightened energy codes, and falling inverter costs are compressing the price delta between traditional split units and VRF mini-modules. The ability to link up to 64 indoor fan-coils to a single outdoor unit supports high diversity loads in mixed-use floorplates. In parallel, packaged rooftop units advance steady replacement demand in North America's light-commercial sector, while centrifugal and screw chillers (>500 tons) address pharmaceutical warehouses and semiconductor fabs that need sub-degree stability, adding diversity to the air conditioning equipment market.
Inverter compressors secured 68.86% of 2025 shipments and are forecast to rise at a 6.53% clip, further raising their share of the overall air conditioning equipment market share by 2031. Non-inverter models linger in rural and rental stock but shrink annually as subsidy programs shrink incremental cost gaps.
Artificial-intelligence-enabled controllers now analyze weather, tariff windows, and occupancy in real time, trimming bills by another 8-12%. Demand-response integration allows building owners to monetize curtailed load. Fixed-speed systems remain viable in voltage-unstable zones of Africa and Latin America, yet global inverter penetration is projected above 80% by 2030, underpinned by scale economics and policy pressure.
Complete Report Scope:
- By Product Type
- Split and Multi-Split Systems
- Variable Refrigerant Flow (VRF) Systems
- Packaged and Rooftop Units
- Chillers
- By Technology
- Inverter Systems
- Non-Inverter Systems
- By End-User
- Residential
- Commercial
- Industrial
- By Capacity (Tons of Refrigeration)
- Up to 10 Tons
- 11 - 18 Tons
- 19 - 26 Tons
- Above 26 Tons
- By Distribution Channel
- Direct Sales
- Dealer / Retail Stores
- Online
- By Geography
- North America
- United States
- Canada
- Mexico
- South America
- Brazil
- Argentina
- Rest of South America
- Europe
- Germany
- France
- United Kingdom
- Italy
- Spain
- Rest of Europe
- Asia-Pacific
- China
- Japan
- India
- South Korea
- Australia
- Rest of Asia-Pacific
- Middle East and Africa
- Middle East
- Saudi Arabia
- United Arab Emirates
- Turkey
- Rest of Middle East
- Africa
- South Africa
- Egypt
- Nigeria
- Rest of Africa
- Middle East
- North America
Geography Analysis
Asia-Pacific delivered 40.32% of 2025 revenue and is on pace for an 8.43% CAGR, outstripping every other region across the air conditioning equipment market. China's growth moderates as tier-1 saturation rises, but India, Indonesia, and Vietnam continue double-digit installation growth driven by extreme heat and improved grid access. High-rise boom towns in Jakarta and Manila specify large VRF backbones, and Japan's mature stock focuses on premium air-purification features. Australia's commercial sector is retrofitting rooftop units to satisfy 2022 energy-efficiency code updates.
North America and Europe air conditioning equipment market expand 4-5% annually on replacement cycles, heat-pump adoption, and corporate net-zero targets. U.S. residential split-system shipments topped 8.2 million in 2024, while the Inflation Reduction Act continues to underwrite heat-pump retrofits. The European Union's near-zero-energy mandate for non-residential buildings by 2030 pushes VRF upgrades in Germany, France, and the United Kingdom.
The Middle East and Africa register 6-7% growth. District-cooling networks in Dubai and Riyadh anchor large-capacity chiller demand, while off-grid solar splits penetrate power-deficient communities in Sub-Saharan Africa. South American markets grow 5-6%, led by Brazilian residential demand and Argentine commercial retrofits following electricity-subsidy phaseouts. Altogether, regional dynamics reinforce the diversified growth profile of the air conditioning equipment market.
- Daikin Industries Ltd.
- Gree Electric Appliances Inc. of Zhuhai
- Midea Group Co., Ltd.
- Carrier Global Corporation
- Trane Technologies plc
- Johnson Controls International plc
- Mitsubishi Electric Corporation
- LG Electronics Inc.
- Samsung Electronics Co., Ltd.
- Haier Smart Home Co., Ltd.
- Panasonic Holdings Corporation
- Lennox International Inc.
- Fujitsu General Ltd.
- Toshiba Carrier Corporation
- Hitachi-Johnson Controls Air Conditioning, Inc.
- Rheem Manufacturing Company
- Bosch Thermotechnology GmbH
- Hisense International Co., Ltd.
- AUX Group Co., Ltd.
Additional Benefits:
- The market estimate (ME) sheet in Excel format
- 3 months of analyst support
TABLE OF CONTENTS
1 INTRODUCTION
- 1.1 Study Assumptions and Market Definition
- 1.2 Scope of the Study
2 RESEARCH METHODOLOGY
3 EXECUTIVE SUMMARY
4 MARKET LANDSCAPE
- 4.1 Market Overview
- 4.2 Market Drivers
- 4.2.1 Escalating Global Temperatures and Extreme-Heat Frequency
- 4.2.2 Government Energy-Efficiency Standards and Cooling-Appliance Subsidies
- 4.2.3 Urban High-Rise Construction Surge in Emerging Megacities
- 4.2.4 Edge and Hyperscale Data-Center Expansion Boosting Precision Cooling Demand
- 4.2.5 AI-Enabled Predictive-Maintenance Contracts Lowering Lifecycle Costs
- 4.2.6 Growing Demand for Off-Grid Solar-Powered Split AC Units in Power-Deficit Regions
- 4.3 Market Restraints
- 4.3.1 Volatile Copper and Semiconductor Prices Squeezing OEM Margins
- 4.3.2 Kigali Amendment-Driven Accelerated HFC Phase-Down Compliance Costs
- 4.3.3 Chronic Shortage of Certified HVAC Technicians for Inverter and VRF Systems
- 4.3.4 Grid Decarbonization Policies Favoring Passive and District-Cooling Alternatives
- 4.4 Industry Supply-Chain Analysis
- 4.5 Regulatory Landscape
- 4.6 Technological Outlook
- 4.7 Porter's Five Forces Analysis
- 4.7.1 Bargaining Power of Suppliers
- 4.7.2 Bargaining Power of Buyers
- 4.7.3 Threat of New Entrants
- 4.7.4 Threat of Substitutes
- 4.7.5 Intensity of Competitive Rivalry
- 4.8 Impact of Macroeconomic Factors on the Market
5 MARKET SIZE AND GROWTH FORECASTS (VALUE)
- 5.1 By Product Type
- 5.1.1 Split and Multi-Split Systems
- 5.1.2 Variable Refrigerant Flow (VRF) Systems
- 5.1.3 Packaged and Rooftop Units
- 5.1.4 Chillers
- 5.2 By Technology
- 5.2.1 Inverter Systems
- 5.2.2 Non-Inverter Systems
- 5.3 By End-User
- 5.3.1 Residential
- 5.3.2 Commercial
- 5.3.3 Industrial
- 5.4 By Capacity (Tons of Refrigeration)
- 5.4.1 Up to 10 Tons
- 5.4.2 11 - 18 Tons
- 5.4.3 19 - 26 Tons
- 5.4.4 Above 26 Tons
- 5.5 By Distribution Channel
- 5.5.1 Direct Sales
- 5.5.2 Dealer / Retail Stores
- 5.5.3 Online
- 5.6 By Geography
- 5.6.1 North America
- 5.6.1.1 United States
- 5.6.1.2 Canada
- 5.6.1.3 Mexico
- 5.6.2 South America
- 5.6.2.1 Brazil
- 5.6.2.2 Argentina
- 5.6.2.3 Rest of South America
- 5.6.3 Europe
- 5.6.3.1 Germany
- 5.6.3.2 France
- 5.6.3.3 United Kingdom
- 5.6.3.4 Italy
- 5.6.3.5 Spain
- 5.6.3.6 Rest of Europe
- 5.6.4 Asia-Pacific
- 5.6.4.1 China
- 5.6.4.2 Japan
- 5.6.4.3 India
- 5.6.4.4 South Korea
- 5.6.4.5 Australia
- 5.6.4.6 Rest of Asia-Pacific
- 5.6.5 Middle East and Africa
- 5.6.5.1 Middle East
- 5.6.5.1.1 Saudi Arabia
- 5.6.5.1.2 United Arab Emirates
- 5.6.5.1.3 Turkey
- 5.6.5.1.4 Rest of Middle East
- 5.6.5.2 Africa
- 5.6.5.2.1 South Africa
- 5.6.5.2.2 Egypt
- 5.6.5.2.3 Nigeria
- 5.6.5.2.4 Rest of Africa
- 5.6.5.1 Middle East
- 5.6.1 North America
6 COMPETITIVE LANDSCAPE
- 6.1 Market Concentration
- 6.2 Strategic Moves
- 6.3 Market Share Analysis
- 6.4 Company Profiles (includes Global Level Overview, Market Level Overview, Core Segments, Financials as Available, Strategic Information, Market Rank/Share for Key Companies, Products and Services, and Recent Developments)
- 6.4.1 Daikin Industries Ltd.
- 6.4.2 Gree Electric Appliances Inc. of Zhuhai
- 6.4.3 Midea Group Co., Ltd.
- 6.4.4 Carrier Global Corporation
- 6.4.5 Trane Technologies plc
- 6.4.6 Johnson Controls International plc
- 6.4.7 Mitsubishi Electric Corporation
- 6.4.8 LG Electronics Inc.
- 6.4.9 Samsung Electronics Co., Ltd.
- 6.4.10 Haier Smart Home Co., Ltd.
- 6.4.11 Panasonic Holdings Corporation
- 6.4.12 Lennox International Inc.
- 6.4.13 Fujitsu General Ltd.
- 6.4.14 Toshiba Carrier Corporation
- 6.4.15 Hitachi-Johnson Controls Air Conditioning, Inc.
- 6.4.16 Rheem Manufacturing Company
- 6.4.17 Bosch Thermotechnology GmbH
- 6.4.18 Hisense International Co., Ltd.
- 6.4.19 AUX Group Co., Ltd.
7 MARKET OPPORTUNITIES AND FUTURE OUTLOOK
- 7.1 White-Space and Unmet-Need Assessment

 空調系統市場:2026-2032年全球市場預測(依產品類型、技術、冷氣、組件、冷媒類型、能源效率、應用和銷售管道)
 北美暖通空調市場:市佔率分析、產業趨勢與統計及成長預測(2026-2031 年)
 空調系統市場規模、佔有率和趨勢分析報告:按類型、技術、應用、地區和細分市場預測(2026-2033 年)
 立式空調市場:按類型、應用、最終用戶和地區分類
 空調系統市場機會、成長要素、產業趨勢分析及2026-2035年預測。空調市場:2026-2032年全球市場預測(依銷售管道、技術、冷氣量、產品類型及最終用戶分類)
 全球空調系統市場規模、佔有率、趨勢和成長分析報告(2026-2034年)空調系統市場:按類型、技術、最終用戶和地區分類空調設備市場:2026年至2032年全球預測(依產品類型、技術、容量、組件、最終用戶及通路分類)
 2026年全球蒸氣和空調供應市場報告