

 |
市場調查報告書
商品編碼
2066415
印度貨運與物流:市場佔有率分析、產業趨勢與統計及成長預測(2026-2031)India Freight And Logistics - Market Share Analysis, Industry Trends & Statistics, Growth Forecasts (2026 - 2031) |
||||||
※ 本網頁內容可能與最新版本有所差異。詳細情況請與我們聯繫。
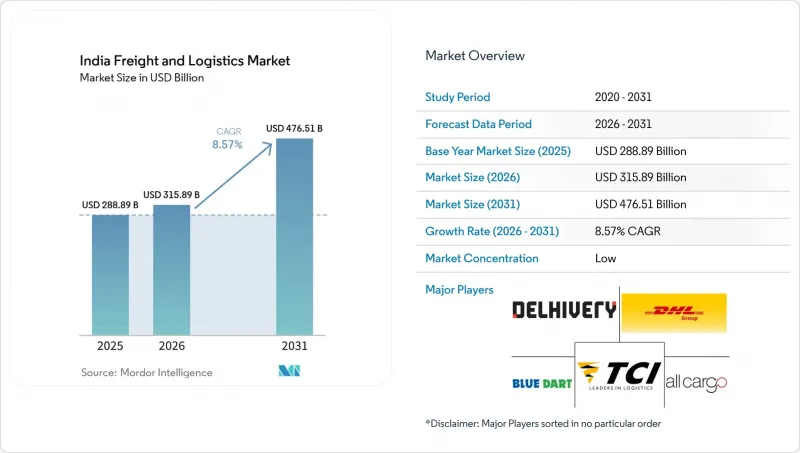
根據 Mordor Intelligence 預測,印度貨運和物流市場規模預計將從 2025 年的 2888.9 億美元成長到 2026 年的 3158.9 億美元,然後從 2026 年到 2031 年以 8.57% 的複合年成長率,到 2031 年達到 4765.1 年達到 4765.1 億美元。
本報告按最終用戶行業(農業、漁業和林業、建築業、製造業、石油和天然氣、採礦和採石業、批發和零售貿易等)以及物流功能(宅配、快遞和小包裹遞送 (CEP)、貨運代理、貨運、倉儲和其他服務)進行細分。市場預測以美元 (USD) 為單位。
印度貨運和物流市場的趨勢和洞察。
全通路和D2C履約的激增
D2C(直接面對消費者)品牌正在將出貨規模細分化,從而推動了對位於消費者熱點區域15公里範圍內的微型倉配中心的需求。 Flipkart計劃在2024年將其履約和分類中心網路擴展至1400多個,保證在19,000個郵遞區號區域內提供隔日服務。亞馬遜印度的「我有空間」(I Have Space)計畫已將28,000家雜貨店註冊為最後一公里配送點,使每筆訂單的成本降低了高達22%。規模小規模的D2C品牌傾向於選擇六個月的倉庫租賃,而不是多年租賃,這要求第三方物流供應商建立靈活的倉儲能力。像Blinkit這樣的快電商營運商需要在需求旺盛區域2公里範圍內建造都市區暗店,這推動了區域規劃改革和最後一公里自動化。總體而言,D2C銷售的成長正在促進印度貨運和物流市場的發展,並帶動了諸如套件組裝和當日退貨等附加價值服務的擴展。
即時視覺化和預測預計到達時間正變得越來越重要。
如今,企業貨主期望獲得更詳細的GPS資料和基於機器學習的預計到達時間(ETA)更新,而不僅僅是籠統的「運輸中」狀態。 2024年,Blue Dart在其18,000輛車的車隊中部署了物聯網追蹤器,客戶諮詢量減少了31%。印度貨櫃公司(CCI)將鐵路運輸與其FOIS系統整合,為出口商提供60個內陸堆場的即時貨櫃位置資訊。 FASTag強制收費系統每月產生12億個路線資料點,使貨物匹配引擎能夠減少空駛里程。在溫控車隊中,遠端資訊處理技術正被用於將低溫運輸損耗率降低至近4%。這些對可視性的投入正在提高資產利用率,並增強印度貨運和物流市場的貨主忠誠度。
司機短缺和高離職率
2024年,商業司機需求量與實際供應量之間出現22%的缺口,加劇了貨物運輸延誤和薪資上漲。由於工作安排繁重且路邊設施不足,長途司機的離職率上升至38%。疲勞駕駛佔卡車相關事故的12%,保險公司因此提高了保費。由於雙人駕駛模式可能導致人事費用增加高達50%,因此目前僅限於高價值貨物的運輸。 2024年,政府培訓計畫僅認證了4.7萬名新司機,遠低於10萬的目標。如果沒有強力的技能發展獎勵,勞動力短缺將繼續阻礙印度貨運和物流市場的成長動能。
細分市場分析
到2025年,批發和零售額將佔總銷售額的33.52%,預計在2026年至2031年間將以9.20%的複合年成長率成長,這主要得益於其有組織的零售網路的擴張。 Reliance Retail旗下八個物流中心的自動化分類系統已將門市補貨週期縮短至48小時。
製造業物流依賴準時制(JIT)生產,塔塔汽車透過其供應商管理庫存(VMI)計劃,已將庫存週轉天數縮短至2.8天。由於農村道路網路不發達,農產品貨物每年仍面臨高達140億美元的收穫後損失。多元化的產業需求不斷推動印度貨運和物流市場收入來源的多元化。
儘管貨運在 2025 年仍佔據主導地位,市佔率高達 62.96%,但隨著 2024 年電子商務貨運量成長 29%,快遞物流 (CEP) 領域正以 9.92% 的複合年成長率 (2026-2031) 不斷擴張。 Delhivery 的 100 個分揀中心,每個中心每天可處理多達 10 萬個小包裹,清楚地表明了自動化浪潮正在席捲快遞物流 (CEP) 行業。
資產密集型貨運公司正在部署電動貨車以符合低排放氣體法規。 Blue Dart公司在2024年部署了320輛貨車,使每次配送的排放減少了18%。印度郵政的「特快專遞」(Speed Post Express)利用15.5萬個郵局向三線城市提供配送服務,凸顯了該市場長尾部分蘊藏的商機。隨著小包裹密度的增加,一體化倉儲管理和最後一公里配送最佳化正成為印度貨運和物流市場競爭優勢的基礎。
其他好處:
- Excel格式的市場預測(ME)表
- 3個月的分析師支持
目錄
第1章:引言
- 研究假設和市場定義
- 調查範圍
第2章:調查方法
第3章執行摘要
第4章 市場狀況
- 市場概覽
- 人口統計數據
- 按經濟活動分類的GDP構成
- 按經濟活動分類的GDP成長率
- 通貨膨脹
- 經濟表現及概覽
- 電子商務產業的趨勢
- 製造業的發展趨勢
- 運輸和倉儲部門的GDP
- 出口趨勢
- 進口趨勢
- 燃油價格
- 卡車運輸營運成本
- 按車輛類型分類的卡車擁有數量
- 物流績效
- 按交通途徑分享
- 船隊的裝載能力
- 渡輪連接
- 港口訪問及成就
- 票價趨勢
- 貨物噸位趨勢
- 基礎設施
- 法律規範(公路和鐵路)
- 法律規範(海事和航空)
- 價值鍊和通路分析
- 市場促進因素
- 全通路和D2C履約的激增
- 強制性即時視覺化和預測到達時間(ETA)
- 靈活的交貨時間和“隨時退貨”
- 藥品低溫運輸完整性要求
- 國防和航太領域的物流外包激增。
- 工業OEM廠商的超高水準服務等級協定(SLA)
- 市場限制因素
- 促進要素短缺和高離職率
- 卡車所有權高度分散
- 柴油和液化天然氣之間的價格差異波動很大。
- 地緣政治因素導致航運路線改變(紅海/巴拿馬)
- 技術展望
- 波特五力分析
第5章 市場規模與成長預測
- 按最終用戶行業分類
- 農業、漁業、林業
- 建造
- 製造業
- 石油和天然氣、採礦和採石
- 批發和零售
- 其他
- 透過物流功能
- 宅配、快遞和小包裹(CEP)
- 依外送目的地類型
- 國內的
- 國際的
- 依外送目的地類型
- 轉發
- 透過運輸方式
- 航空
- 海路和內河航道
- 其他
- 透過運輸方式
- 貨物運輸
- 透過運輸方式
- 航空
- 管道
- 鐵路
- 路
- 海路和內河航道
- 透過運輸方式
- 倉庫/存儲
- 透過溫度控制
- 非溫控型
- 溫控型
- 透過溫度控制
- 其他服務
- 宅配、快遞和小包裹(CEP)
第6章 競爭情勢
- 市場集中度
- 策略趨勢
- 市佔率分析
- 公司簡介
- Adani Ports and SEZ
- Allcargo Logistics, Ltd.(Including Gati Express)
- Amazon
- Blue Dart Express, Ltd.
- Busybees Logistics Solutions Pvt. Ltd.
- Container Corporation of India, Ltd.
- Delhivery, Ltd.
- DHL Group
- DSV A/S(Including DB Schenker)
- DTDC Express, Ltd.
- Ecom Express, Ltd.
- FedEx
- Flipkart Logistics
- Kuehne+Nagel
- LEAP India Pvt. Ltd.
- Mahindra Logistics, Ltd
- Redington, Ltd.
- Safexpress Pvt. Ltd.
- Shadowfax
- Snowman Logistics Ltd.
- TCI(Transport Corporation of India Ltd.)
- TVS Supply Chain Solutions Ltd.
- United Parcel Service of America, Inc.(UPS)
- VRL Logistics Ltd.
第7章 市場機會與未來展望
According to Mordor Intelligence, the india freight and logistics market size is expected to grow from USD 288.89 billion in 2025 to USD 315.89 billion in 2026 and is forecast to reach USD 476.51 billion by 2031 at 8.57% CAGR over 2026-2031.
This report is Segmented by End-User Industry (Agriculture, Fishing and Forestry, Construction, Manufacturing, Oil and Gas, Mining and Quarrying, Wholesale and Retail Trade, and Others) and by Logistics Function (Courier, Express, and Parcel (CEP), Freight Forwarding, Freight Transport, Warehousing and Storage, and Other Services). The Market Forecasts are Provided in Terms of Value (USD).
India Freight And Logistics Market Trends and Insights
Omnichannel and D2C Fulfilment Surge
Direct-to-consumer brands are fragmenting shipment sizes and driving demand for micro-fulfilment centers located within 15 kilometers of consumption clusters. Flipkart lifted its network to more than 1,400 fulfilment and sortation sites by 2024 to promise next-day delivery across 19,000 pin codes. Amazon India's "I Have Space" enlisted 28,000 kirana stores as last-mile nodes, lowering per-order costs up to 22%. Small D2C brands negotiate six-month warehousing contracts rather than multiyear leases, forcing 3PLs to build flexible capacity. Quick-commerce players such as Blinkit require urban dark stores within two kilometers of demand pockets, spurring zoning reforms and last-mile automation. Overall, rising D2C sales are propelling value-added services like kitting and same-day returns inside the India freight and logistics market .
Real-Time Visibility and Predictive ETA Mandate
Enterprise shippers now expect granular GPS feeds and machine-learning ETA updates instead of generic "in transit" statuses. Blue Dart connected IoT trackers across its 18,000-vehicle fleet in 2024, cutting customer queries by 31%. Container Corporation of India integrated its rail moves with the FOIS system, giving exporters real-time box locations at 60 inland depots. Mandatory FASTag tolling now produces 1.2 billion route data points each month, enabling load-matching engines to curb empty miles. Temperature-controlled fleets employ telematics to reduce cold-chain spoilage to near 4%. These visibility investments improve asset utilization and boost shipper loyalty within the India freight and logistics market .
Driver Shortage and High Attrition
A 22% gap between required and available commercial drivers in 2024 exacerbated delivery delays and wage inflation. Attrition among long-haul drivers rose to 38% because of arduous schedules and poor roadside amenities. Fatigue contributed to 12% of truck-related accidents, prompting insurers to raise premiums. Team-driving models lift labor costs by up to 50%, limiting viability to high-value cargo. Government training programs certified only 47,000 new drivers in 2024 against a target of 100,000. Without robust skilling incentives, personnel shortages will continue to suppress growth momentum in the India freight and logistics market .
Other drivers and restraints analyzed in the detailed report include:
- Flexible Delivery Windows and Anytime Returns
- Pharmaceutical Cold-Chain Integrity Demands
- Highly Fragmented Truck Ownership
For complete list of drivers and restraints, kindly check the Table Of Contents.
Segment Analysis
Wholesale and retail trade contributed 33.52% of revenue in 2025 and is forecast to grow at a 9.20% CAGR (2026-2031) as organized retail footprints broaden. Reliance Retail's automated sortation in eight distribution centers cut store replenishment cycles to 48 hours.
Manufacturing logistics hinges on just-in-time sequencing; Tata Motors reduced inventory to 2.8 days via a vendor-managed inventory program. Agricultural freight remains challenged by post-harvest losses of up to USD 14 billion annually due to weak rural road connectivity. Diverse sectoral needs continue to diversify revenue streams inside the India freight and logistics market.
Freight transport dominated with a 62.96% share in 2025; however, the CEP segment is scaling at a 9.92% CAGR (2026-2031) as e-commerce shipments climbed 29% in 2024. Delhivery's 100 sortation centers, each processing up to 100,000 parcels daily, illustrate the automation wave gripping CEP.
Asset-heavy freight carriers are deploying electric delivery vans to meet low-emission mandates; Blue Dart introduced 320 units in 2024 and cut per-drop emissions by 18%. India Post's Speed Post Express leverages 155,000 post offices to reach tier-3 towns, underscoring the market's long-tail opportunity. As parcel density rises, integrated warehousing and last-mile orchestration underpin competitive advantage inside the India freight and logistics market.
List of Companies Covered in this Report:
- Adani Ports and SEZ
- Allcargo Logistics, Ltd. (Including Gati Express)
- Amazon
- Blue Dart Express, Ltd.
- Busybees Logistics Solutions Pvt. Ltd.
- Container Corporation of India, Ltd.
- Delhivery, Ltd.
- DHL Group
- DSV A/S (Including DB Schenker)
- DTDC Express, Ltd.
- Ecom Express, Ltd.
- FedEx
- Flipkart Logistics
- Kuehne+Nagel
- LEAP India Pvt. Ltd.
- Mahindra Logistics, Ltd
- Redington, Ltd.
- Safexpress Pvt. Ltd.
- Shadowfax
- Snowman Logistics Ltd.
- TCI (Transport Corporation of India Ltd.)
- TVS Supply Chain Solutions Ltd.
- United Parcel Service of America, Inc. (UPS)
- VRL Logistics Ltd.
Additional Benefits:
- The market estimate (ME) sheet in Excel format
- 3 months of analyst support
TABLE OF CONTENTS
1 Introduction
- 1.1 Study Assumptions and Market Definition
- 1.2 Scope of the Study
2 Research Methodology
3 Executive Summary
4 Market Landscape
- 4.1 Market Overview
- 4.2 Demographics
- 4.3 GDP Distribution by Economic Activity
- 4.4 GDP Growth by Economic Activity
- 4.5 Inflation
- 4.6 Economic Performance and Profile
- 4.6.1 Trends in E-Commerce Industry
- 4.6.2 Trends in Manufacturing Industry
- 4.7 Transport and Storage Sector GDP
- 4.8 Export Trends
- 4.9 Import Trends
- 4.10 Fuel Price
- 4.11 Trucking Operational Costs
- 4.12 Trucking Fleet Size by Type
- 4.13 Logistics Performance
- 4.14 Modal Share
- 4.15 Maritime Fleet Load Carrying Capacity
- 4.16 Liner Shipping Connectivity
- 4.17 Port Calls and Performance
- 4.18 Freight Pricing Trends
- 4.19 Freight Tonnage Trends
- 4.20 Infrastructure
- 4.21 Regulatory Framework (Road and Rail)
- 4.22 Regulatory Framework (Sea and Air)
- 4.23 Value Chain and Distribution Channel Analysis
- 4.24 Market Drivers
- 4.24.1 Omnichannel and D2C Fulfilment Surge
- 4.24.2 Real-Time Visibility and Predictive ETA Mandate
- 4.24.3 Flexible Delivery Windows and "Anytime Returns"
- 4.24.4 Pharmaceutical Cold-Chain Integrity Demands
- 4.24.5 Defence and Aerospace Logistics Outsourcing Surge
- 4.24.6 Ultra-High Service-Level SLAs for Industrial OEMs
- 4.25 Market Restraints
- 4.25.1 Driver Shortage and High Attrition
- 4.25.2 Highly Fragmented Truck Ownership
- 4.25.3 Volatile Diesel and LNG Price Spread
- 4.25.4 Geopolitical Route Volatility (Red Sea / Panama)
- 4.26 Technological Outlook
- 4.27 Porter's Five Forces Analysis
- 4.27.1 Threat of New Entrants
- 4.27.2 Bargaining Power of Buyers
- 4.27.3 Bargaining Power of Suppliers
- 4.27.4 Threat of Substitutes
- 4.27.5 Competitive Rivalry
5 Market Size and Growth Forecasts (Value in USD)
- 5.1 By End-User Industry
- 5.1.1 Agriculture, Fishing, and Forestry
- 5.1.2 Construction
- 5.1.3 Manufacturing
- 5.1.4 Oil and Gas, Mining, and Quarrying
- 5.1.5 Wholesale and Retail Trade
- 5.1.6 Others
- 5.2 By Logistics Function
- 5.2.1 Courier, Express and Parcel (CEP)
- 5.2.1.1 By Destination Type
- 5.2.1.1.1 Domestic
- 5.2.1.1.2 International
- 5.2.1.1 By Destination Type
- 5.2.2 Freight Forwarding
- 5.2.2.1 By Mode of Transport
- 5.2.2.1.1 Air
- 5.2.2.1.2 Sea and Inland Waterways
- 5.2.2.1.3 Others
- 5.2.2.1 By Mode of Transport
- 5.2.3 Freight Transport
- 5.2.3.1 By Mode of Transport
- 5.2.3.1.1 Air
- 5.2.3.1.2 Pipelines
- 5.2.3.1.3 Rail
- 5.2.3.1.4 Road
- 5.2.3.1.5 Sea and Inland Waterways
- 5.2.3.1 By Mode of Transport
- 5.2.4 Warehousing and Storage
- 5.2.4.1 By Temperature Control
- 5.2.4.1.1 Non-Temperature-Controlled
- 5.2.4.1.2 Temperature-Controlled
- 5.2.4.1 By Temperature Control
- 5.2.5 Other Services
- 5.2.1 Courier, Express and Parcel (CEP)
6 Competitive Landscape
- 6.1 Market Concentration
- 6.2 Strategic Moves
- 6.3 Market Share Analysis
- 6.4 Company Profiles (includes Global Level Overview, Market Level Overview, Core Segments, Financials as Available, Strategic Information, Market Rank/Share for Key Companies, Products and Services, and Recent Developments)
- 6.4.1 Adani Ports and SEZ
- 6.4.2 Allcargo Logistics, Ltd. (Including Gati Express)
- 6.4.3 Amazon
- 6.4.4 Blue Dart Express, Ltd.
- 6.4.5 Busybees Logistics Solutions Pvt. Ltd.
- 6.4.6 Container Corporation of India, Ltd.
- 6.4.7 Delhivery, Ltd.
- 6.4.8 DHL Group
- 6.4.9 DSV A/S (Including DB Schenker)
- 6.4.10 DTDC Express, Ltd.
- 6.4.11 Ecom Express, Ltd.
- 6.4.12 FedEx
- 6.4.13 Flipkart Logistics
- 6.4.14 Kuehne+Nagel
- 6.4.15 LEAP India Pvt. Ltd.
- 6.4.16 Mahindra Logistics, Ltd
- 6.4.17 Redington, Ltd.
- 6.4.18 Safexpress Pvt. Ltd.
- 6.4.19 Shadowfax
- 6.4.20 Snowman Logistics Ltd.
- 6.4.21 TCI (Transport Corporation of India Ltd.)
- 6.4.22 TVS Supply Chain Solutions Ltd.
- 6.4.23 United Parcel Service of America, Inc. (UPS)
- 6.4.24 VRL Logistics Ltd.
7 Market Opportunities and Future Outlook
- 7.1 White-Space and Unmet-Need Assessment
 2034年全球貨運市場預測-依運輸方式、貨物類型、燃料和推進方式、所有權類型、最終用戶和地區分類的分析
 全球貨運和物流市場:市場規模、佔有率、趨勢和成長分析(2026-2034 年)
 2026年全球貨車市場報告2026年全球貨運和物流市場報告2026年全球零碳運輸市場報告
 貨運及物流市場分析及預測(至2035年):依類型、產品類型、服務、技術、組件、應用、流程、最終使用者及運輸方式分類
 2026-2030年全球貨物審核與支付市場
 中東歐貨運與物流:市場佔有率分析、產業趨勢與統計、成長預測(2026-2031 年)亞太地區貨運與物流:市場佔有率分析、產業趨勢與統計、成長預測(2026-2031)南美貨運與物流:市場佔有率分析、產業趨勢與統計、成長預測(2026-2031)