

 |
市場調查報告書
商品編碼
2044275
新加坡化學品物流:市場佔有率分析、產業趨勢與統計及成長預測(2026-2031)Singapore Chemical Logistics - Market Share Analysis, Industry Trends & Statistics, Growth Forecasts (2026 - 2031) |
||||||
※ 本網頁內容可能與最新版本有所差異。詳細情況請與我們聯繫。
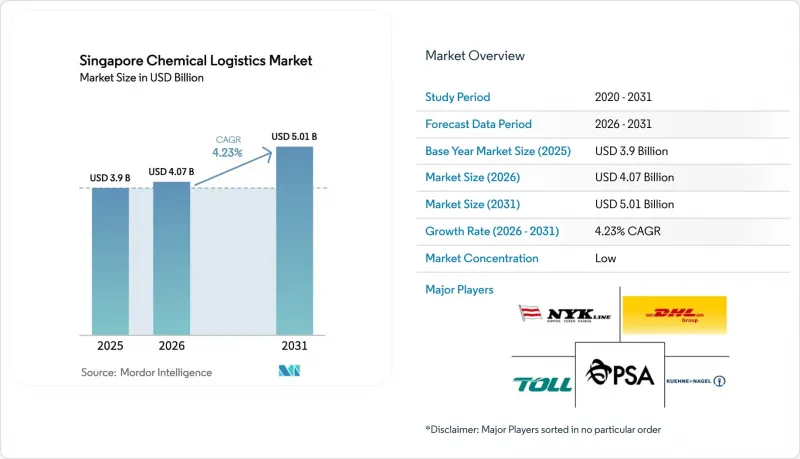
新加坡化學品物流市場在 2025 年的價值為 39 億美元,預計到 2031 年將達到 50.1 億美元,而 2026 年為 40.7 億美元,預測期(2026-2031 年)的複合年成長率為 4.23%。
由於非洲和南亞地區的進口商依賴新加坡進行品質檢驗和集中式文件處理,化學品再出口到這些地區的利潤率很高。 SS 667:2020 標準的修訂導致危險品倉庫供應緊張,有利於資金雄厚且設施符合標準的營運商。大士港引入自動駕駛堆場卡車已使貨物停留時間縮短了 20-30%,從而提高了擁有即時數據連接的營運商的資產利用率。一家總部位於新加坡、由私募股權支持的 ISO 儲罐租賃公司正在擴大其專用設備的供應,幫助綜合服務提供商將運輸、儲罐租賃和 TradeNet 申報打包成一站式服務。低碳氨燃料庫檢查以及對 TradeNet 電子危險品許可證 (e-DG) 系統的審查表明,政府主導的數位化和脫碳措施正在不斷提高營運效率的標準。
新加坡化學品物流市場趨勢與洞察
新加坡向非洲和南亞轉口特種化學品的數量激增。
根據新加坡企業發展局(Enterprise Singapore)預測,2024年新加坡化學品出口額將達到915億新元(約686億美元),其中表面活性劑和催化劑等特種化學品在新興市場的出口額將實現兩位數成長。進口商依賴新加坡提供小批量重新包裝、本地語言安全資料表(SDS)製作和真偽鑑定服務,這使得物流供應商能夠收取兩到三倍於標準轉運費的費用。與非洲分銷商的合作拓展了庫存管理和價值鏈金融服務,而南亞的醫藥採購商也開始選擇在新加坡採購,以實現貨源多元化,擺脫對單一國家的依賴。預計這一趨勢將擴大增值活動帶來的收入佔有率,並鞏固新加坡作為特種化學品風險規避門戶的地位。
大士港的自動堆場卡車檢查作業加快了周轉時間的縮短。
新加坡港務集團(PSA Singapore)已部署超過200輛可全天候24小時運作的自動駕駛電動堆場卡車,精度可達厘米級,從而將化學品集裝箱的停留時間縮短了高達30%。自動化消除了駕駛人疲勞的限制,並減少了人與危險品的接觸,提高了安全性和生產效率。事件驅動型港口軟體為每輛車提供即時通道資訊,將堆場作業與船舶時刻表和倉庫可用性關聯起來。整合的第三方物流(3PL)公司將其自身的運輸管理系統直接連接到PSA的資料層,即可獲得即時進度信息,從而將準點率提升至98%以上。
事故發生後,全球危險物品倉庫的保險費正在上漲。
貝魯特和天津爆炸事件發生後,保險公司將未配備先進探測和滅火系統的設施的保費提高了30%至50%。這迫使營運商實施即時監控和第三方安全審計,以維持保險覆蓋範圍。雖然資金雄厚的公司正在積極應對,但許多小規模業者選擇退出,導致認證場所供應短缺,租金飆升。
細分市場分析
預計到2025年,運輸業將維持其在新加坡化學品物流市場66.47%的佔有率,而其他服務業則以6.11%的複合年成長率快速成長,出口商正努力應對碳邊境調節措施(CBAM)申報、危險品包裝和清關等問題。由於碳排放報告義務,出口商需支付5,000至25,000美元的諮詢費,這推動了新加坡化學品物流市場附加價值服務的市場規模成長。同時,自動駕駛場內卡車的引入縮短了卡車週轉時間,但這無法完全抵消燃油額外費用的波動。 SS 667:2020標準的溢價效應支撐了倉儲收入,該標準導致租金比標準工業空間高出40%至60%,提供認證倉儲服務的營運商在新加坡化學品物流市場整體佔有率正在擴大。
對整合解決方案的需求使得整合式第三方物流公司能夠將ISO罐租賃與TradeNet自動化相結合,從而提高合約續約率和定價權。專注於危險品單證和小批量再出口至非洲的包裝的諮詢公司蓬勃發展。缺乏整合式數位化許可證能力的營運商面臨著被淘汰的風險,因為托運人會選擇提供當日清關服務的供應商。
由於裕廊島煉油廠的建設,石油和天然氣產業佔據了新加坡化學品物流市場27.08%的佔有率。同時,受生物製藥產品湧入電力供應不穩定的鄰近東協國家推動,醫藥物流正以5.28%的複合年成長率快速成長。符合GDP標準、配備不連續電源和檢驗的冷藏設施的物流公司,其收費是標準處理費的2至3倍,這推動了新加坡化學品物流市場規模的成長,其中醫療相關貨物運輸尤為重要。此外,由於新加坡是半導體製造廠和美妝品牌的區域中心,化妝品和特殊電子化學品產業也從中受益。
新加坡衛生科學局 (HSA) 的嚴格監管限制了供應,從而保障了利潤率,因為只有獲得許可的 GDP 供應商才能參與競爭。同時,由於能源轉型政策導致原油交易量萎縮,油氣物流企業被迫最佳化和自動化 ISO 儲罐,以維持盈利。
其他好處
- Excel格式的市場預測(ME)表
- 3個月的分析師支持
目錄
第1章:引言
- 研究假設和市場定義
- 調查範圍
第2章:調查方法
第3章執行摘要
第4章 市場狀況
- 市場概覽
- 市場促進因素
- 新加坡向非洲和南亞轉口特種化學品數量激增。
- 大士港的自動堆場卡車檢查作業正在加速縮短週轉時間。
- 強制性 SS 667:2020 認證正在推動對符合監管規定的儲存的需求。
- 總部位於新加坡的 ISO Tank Lease Pool 透過私募股權融資實現成長。
- 低碳氨燃料加註的檢驗和測試作業正在創造新的物流流程。
- 由於 Tradenet E-DG 許可證系統的修訂,海關清關時間將縮短。
- 市場限制因素
- 全球倉庫中危險物品(DG)儲存事故發生後的保險費正在上漲。
- 遵守歐盟碳邊境調節措施 (CBAM) 的負擔延長了出口文件準備週期。
- 國內鐵路網連通性差,阻礙了透過多模態降低成本。
- 波動不定的船用燃料額外費用正在削弱第三方物流利潤率的穩定性。
- 價值/供應鏈分析
- 監理情勢
- 技術展望
- 波特五力分析
- 供應商的議價能力
- 買方的議價能力
- 新進入者的威脅
- 替代品的威脅
- 競爭公司之間的競爭
- 地緣政治事件對供應鏈轉型的影響
第5章 市場規模與成長預測
- 按服務
- 運輸
- 路
- 鐵路
- 航空
- 海
- 倉儲、物流和庫存管理
- 其他
- 運輸
- 按最終用戶行業分類
- 製藥
- 化妝品
- 石油和天然氣
- 特種化學品
- 其他
- 危險物質分類
- 危險化學品
- 無害化學品
- 透過溫度控制
- 溫度控制(冷氣/暖氣)
- 無溫度控制
第6章 競爭情勢
- 市場集中度
- 策略趨勢
- 市佔率分析
- 公司簡介
- ALPS Global Logistics
- Bertschi Singapore Pte Ltd.
- DHL Group
- Kuehne+Nagel
- PSA Chemical Logistics(PSA Corp)
- NYK Line
- CMA CGM Group(Including CEVA Logistics)
- "K" Line
- Mitsubishi Chemical Logistics
- Noatum Holdings
- CWT Pte Ltd.
- YCH Group
- DSV A/S
- Rohlig Logistics
- Poh Tiong Choon Logistics Ltd.
- Yang Kee Logistics Pte Ltd.
- Suttons International
- Den Hartogh Logistics
- TranceGlobal Logistics Pte Ltd.
- Toll Group
- ACW Logistics Pte Ltd.
第7章 市場機會與未來展望
The Singapore chemical logistics market size was valued at USD 3.9 billion in 2025 and estimated to grow from USD 4.07 billion in 2026 to reach USD 5.01 billion by 2031, at a CAGR of 4.23% during the forecast period (2026-2031).
Chemical re-export flows to Africa and South Asia generate premium margins because importers in those regions rely on Singapore for quality verification and consolidated documentation. SS 667:2020 upgrades are tightening dangerous-goods warehouse supply, favoring capital-rich operators with compliant facilities. Tuas Port's autonomous yard-truck deployments are already showing 20-30% dwell-time savings that raise asset utilization for operators with real-time data connectivity. Private-equity backed ISO-tank leasing pools domiciled in Singapore are expanding specialized equipment availability and helping integrated providers bundle transport, tank rental, and TradeNet filing into single-source offerings. Low-carbon ammonia bunkering trials, together with the TradeNet e-DG permit revamp, illustrate how government-led digitalization and decarbonization initiatives are continually raising the baseline for operational efficiency.
Singapore Chemical Logistics Market Trends and Insights
Surge in Singapore's Specialty-Chemical Re-Exports to Africa and South Asia
Enterprise Singapore recorded SGD 91.5 billion (USD 68.6 billion) of chemical exports in 2024, and specialty segments such as surfactants and catalysts posted double-digit growth toward emerging markets. Importers rely on Singapore for smaller lot repackaging, local-language SDS preparation, and authenticity assurance, allowing logistics providers to charge 2-3 times standard transshipment rates. Partnerships with African distributors add inventory management and supply-chain financing services, while South Asian pharmaceutical buyers adopt Singapore-based sourcing to diversify away from single-country dependencies. The dynamic is expected to widen the revenue share of value-added activities, reinforcing Singapore's function as a risk-buffering gateway for specialty chemicals.
Autonomous Yard-Truck Pilots at Tuas Port Accelerating Turnaround Times
PSA Singapore has deployed more than 200 autonomous electric yard trucks capable of 24/7 operation with centimeter-level precision, cutting chemical container dwell time by up to 30%. Automation removes driver fatigue limitations and reduces human exposure to hazardous cargo, enhancing both safety and productivity. Event-driven port software feeds routing updates to each vehicle, synchronizing yard moves with vessel schedules and warehouse slot availability. Integrated 3PLs that plug their transport-management systems directly into PSA's data layer gain real-time milestones, pushing on-time performance above 98%.
Rising Insurance Premiums for DG Warehousing Post-Global Incidents
After the Beirut and Tianjin explosions, underwriters raised premiums 30-50% for facilities without advanced detection and suppression, compelling operators to adopt real-time monitoring and third-party safety audits to maintain cover. Capital-rich firms comply; smaller players often exit, tightening supply and supporting higher rents for certified space.
Other drivers and restraints analyzed in the detailed report include:
- Mandatory SS 667:2020 Certification Driving Compliant Storage Demand
- PE-Backed Growth of ISO-Tank Leasing Pools Domiciled in Singapore
- EU CBAM Compliance Burden Inflating Export Documentation Cycles
For complete list of drivers and restraints, kindly check the Table Of Contents.
Segment Analysis
Transportation maintained 66.47% share of the Singapore chemical logistics market in 2025, yet other services are growing faster at 6.11% CAGR as exporters grapple with CBAM filings, dangerous-goods packaging, and customs brokerage. The Singapore chemical logistics market size for value-added services benefits from advisory fees of USD 5,000-25,000 per exporter on carbon reporting mandates. Meanwhile, autonomous yard-truck rollouts improve truck cycle times but cannot fully offset fuel-surcharge volatility. Warehousing revenue is buoyed by SS 667:2020 premiums that lift rents 40-60% above standard industrial space and enhance the overall Singapore chemical logistics market share captured by operators offering certified storage.
Demand for bundled solutions lets integrated 3PLs pair ISO-tank leasing with TradeNet automation, creating stickier contracts and pricing power. Niche consultants thrive on dangerous-goods documentation and packaging for small-lot re-exports to Africa. Those without digital permit integration risk disintermediation as shippers embrace providers capable of same-day clearance.
Oil and Gas controls 27.08% Singapore chemical logistics market share owing to Jurong Island's refinery complex, yet pharmaceutical logistics expands at 5.28% CAGR on biologics flows to power-unstable ASEAN neighbors. GDP-compliant facilities with backup power and validated cold rooms command 2-3-times standard handling rates, boosting the Singapore chemical logistics market size attributable to healthcare shipments. Cosmetics and specialty electronic chemicals also gain from Singapore's role as a regional consolidation hub for semiconductor fabs and beauty brands.
Stringent Health Sciences Authority oversight ensures only licensed GDP providers compete, limiting supply and supporting margins. Conversely, energy-transition measures compress crude trading volumes, forcing Oil & Gas logistics to pursue ISO-tank optimization and automation to preserve profitability.
The Singapore Chemical Logistics Market Report is Segmented by Service (Transportation, Warehousing/Distribution/Inventory Management, Other Services), End-User Industry (Pharmaceutical, Cosmetic, Oil and Gas, Specialty Chemicals, and More), Hazard Class (Hazardous Chemicals, Non-Hazardous Chemicals), Temperature Control (Temperature-Controlled, Non-Temperature-Controlled). The Market Forecasts are Provided in Terms of Value (USD).
List of Companies Covered in this Report:
- ALPS Global Logistics
- Bertschi Singapore Pte Ltd.
- DHL Group
- Kuehne+Nagel
- PSA Chemical Logistics (PSA Corp)
- NYK Line
- CMA CGM Group (Including CEVA Logistics)
- "K" Line
- Mitsubishi Chemical Logistics
- Noatum Holdings
- CWT Pte Ltd.
- YCH Group
- DSV A/S
- Rohlig Logistics
- Poh Tiong Choon Logistics Ltd.
- Yang Kee Logistics Pte Ltd.
- Suttons International
- Den Hartogh Logistics
- TranceGlobal Logistics Pte Ltd.
- Toll Group
- ACW Logistics Pte Ltd.
Additional Benefits:
- The market estimate (ME) sheet in Excel format
- 3 months of analyst support
TABLE OF CONTENTS
1 Introduction
- 1.1 Study Assumptions and Market Definition
- 1.2 Scope of the Study
2 Research Methodology
3 Executive Summary
4 Market Landscape
- 4.1 Market Overview
- 4.2 Market Drivers
- 4.2.1 Surge in SG's Specialty-Chemical Re-Exports to Africa and South Asia
- 4.2.2 Autonomous Yard-Truck Pilots at Tuas Port Accelerating Turnaround Times
- 4.2.3 Mandatory SS 667:2020 Certification Driving Compliant Storage Demand
- 4.2.4 PE-Backed Growth of ISO-Tank Leasing Pools Domiciled in Singapore
- 4.2.5 Low-Carbon Ammonia Bunkering Trials Creating New Logistics Flows
- 4.2.6 Tradenet E-DG Permit Revamp Reducing Customs Clearance Times
- 4.3 Market Restraints
- 4.3.1 Rising Insurance Premiums for DG Warehousing Post-Global Incidents
- 4.3.2 EU CBAM Compliance Burden Inflating Export Documentation Cycles
- 4.3.3 Limited Domestic Rail Connectivity Hindering Multimodal Cost Savings
- 4.3.4 Volatile Bunker Fuel Surcharges Eroding 3PL Margin Stability
- 4.4 Value / Supply-Chain Analysis
- 4.5 Regulatory Landscape
- 4.6 Technological Outlook
- 4.7 Porter's Five Forces Analysis
- 4.7.1 Bargaining Power of Suppliers
- 4.7.2 Bargaining Power of Buyers
- 4.7.3 Threat of New Entrants
- 4.7.4 Threat of Substitute Products
- 4.7.5 Intensity of Competitive Rivalry
- 4.8 Impact of Geo-Political Events on Supply Chain Shifts
5 Market Size and Growth Forecasts
- 5.1 By Service
- 5.1.1 Transportation
- 5.1.1.1 Road
- 5.1.1.2 Rail
- 5.1.1.3 Air
- 5.1.1.4 Sea
- 5.1.2 Warehousing, Distribution and Inventory Management
- 5.1.3 Other Services
- 5.1.1 Transportation
- 5.2 By End-User Industry
- 5.2.1 Pharmaceutical
- 5.2.2 Cosmetic
- 5.2.3 Oil and Gas
- 5.2.4 Specialty Chemicals
- 5.2.5 Other End-Users
- 5.3 By Hazard Class
- 5.3.1 Hazardous Chemicals
- 5.3.2 Non-hazardous Chemicals
- 5.4 By Temperature Control
- 5.4.1 Temperature-Controlled (Refrigerated/Heated)
- 5.4.2 Non-Temperature-Controlled
6 Competitive Landscape
- 6.1 Market Concentration
- 6.2 Strategic Moves
- 6.3 Market Share Analysis
- 6.4 Company Profiles (Includes Global Level Overview, Market Level Overview, Core Segments, Financials as Available, Strategic Information, Market Rank/Share for Key Companies, Products and Services, and Recent Developments)
- 6.4.1 ALPS Global Logistics
- 6.4.2 Bertschi Singapore Pte Ltd.
- 6.4.3 DHL Group
- 6.4.4 Kuehne+Nagel
- 6.4.5 PSA Chemical Logistics (PSA Corp)
- 6.4.6 NYK Line
- 6.4.7 CMA CGM Group (Including CEVA Logistics)
- 6.4.8 "K" Line
- 6.4.9 Mitsubishi Chemical Logistics
- 6.4.10 Noatum Holdings
- 6.4.11 CWT Pte Ltd.
- 6.4.12 YCH Group
- 6.4.13 DSV A/S
- 6.4.14 Rohlig Logistics
- 6.4.15 Poh Tiong Choon Logistics Ltd.
- 6.4.16 Yang Kee Logistics Pte Ltd.
- 6.4.17 Suttons International
- 6.4.18 Den Hartogh Logistics
- 6.4.19 TranceGlobal Logistics Pte Ltd.
- 6.4.20 Toll Group
- 6.4.21 ACW Logistics Pte Ltd.
7 Market Opportunities and Future Outlook
- 7.1 White-space and Unmet-need Assessment
 化學品物流市場規模、佔有率、趨勢和預測:按類型、服務和地區分類,2026-2034年
 零售油氣物流市場:依運輸方式、燃料類型、物流供應商類型及基礎設施類型分類-2026-2032年全球市場預測
 2026年全球化學品物流市場報告化學品物流市場:依服務類型、化學品類型、運輸方式、包裝類型、溫度控制及最終用途產業分類-2026-2032年全球預測2026年全球零售油氣物流市場報告
 2026-2030年全球零售油氣物流市場液態化學品物流市場按運輸方式、化學品類型、服務類型、溫度控制和最終用途產業分類-全球預測(2026-2032 年)
 化學品物流市場規模、佔有率和成長分析(按服務、運輸方式、最終用途和地區分類)-產業預測(2026-2033 年)
 化學品物流:全球市佔率排名、總銷售額和需求預測(2025-2031年)
 2025-2029年全球石油與天然氣物流市場