

 |
市場調查報告書
商品編碼
2061752
亞太地區IT設備:市場佔有率分析、產業趨勢與統計及成長預測(2026-2031年)Asia-Pacific IT Device - Market Share Analysis, Industry Trends & Statistics, Growth Forecasts (2026 - 2031) |
||||||
※ 本網頁內容可能與最新版本有所差異。詳細情況請與我們聯繫。
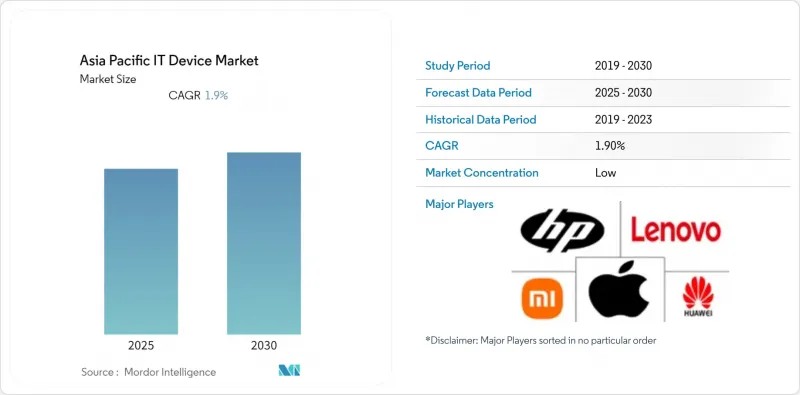
根據 Mordor Intelligence 預測,亞太地區的 IT 設備市場規模將從 2025 年的 7,200 億美元成長到 2026 年的 7,900 億美元,到 2031 年將達到 1.21 兆美元,2026 年至 2031 年的複合年成長率為 8.73%。
本報告按設備類型(智慧型手機、平板電腦、筆記型電腦、桌上型電腦和工作站、穿戴式裝置、PC顯示器和周邊設備)、終端用戶產業(消費者、其他)、連接技術(支援5G、4G/LTE、僅Wi-Fi、有線)、分銷管道(線下零售、線上零售、其他)和地區進行細分。市場預測以美元(USD)為單位。
亞太地區IT設備市場趨勢及洞察。
5G基礎架構的快速部署正在加速設備更新換代週期。
到2025年12月,馬來西亞超過80%的人口將擁有獨立組網的5G網路,這將使物流和製造企業能夠用5G平板電腦取代4G手持終端機,從而實現即時路線規劃和倉庫自動化。印度一家大型通訊業者已將獨立組網的5G網路擴展到300個城市,將網路延遲降低到10毫秒以下,即使在中階智慧型手機上也能運行雲端遊戲和工業IoT。泰國和菲律賓的通訊業者目前正將5G套餐與設備分期付款計畫捆綁銷售,從而縮短設備更換週期。雖然IMT-2020標準保持了向下相容性,但企業發現4G晶片組無法應對網路切片策略帶來的封包檢測開銷,導致即使是2023年購買的設備也會很快過時。醫療保健和製造業是最大的受益者,因為這些產業需要為關鍵任務工作負荷提供有保障的服務品質。
家用電子電器中人工智慧設備端應用的新案例
印度、印尼和越南的數據本地化法律禁止跨境傳輸生物識別和金融數據,迫使原始設備製造商 (OEM) 將推理工作負載傳輸到邊緣。 2026 年推出的旗艦智慧型手機將在本地運行 70 億參數的語言模型,從而實現即時翻譯、會議轉錄和無需雲端呼叫的隱私保護語音助理。三星預計到 2026 年將在 8 億台裝置上預先安裝 Galaxy AI,並計劃透過生產力附加元件的高級訂閱服務來擴大獲利模式。汽車製造商正在為資訊娛樂系統採用客製化的 AI 晶片組,這表明設備端智慧將超越傳統的運算形式。與低價定價模式中依賴 CPU 的推理相比,專用神經網路引擎將提供更低的延遲和更長的電池續航時間,因此預計高階機型的價格將上漲 30% 至 40%。
半導體供應鏈的波動
2026年初,隨著高頻寬記憶體被重新用於人工智慧加速器,DRAM現貨價格較上一季飆升90-95%,NAND快閃記憶體價格也上漲了55-60%。目前,消費級筆記型電腦和入門級平板電腦的LPDDR5記憶體模組前置作業時間為16至20週,這導致產品發布延遲,並迫使廠商重新設計材料清單,使用犧牲電池續航時間的舊記憶體。 PC OEM廠商正在考慮從二線供應商採購,這引發了人們對效能檢驗和地緣政治因素的擔憂。包括Realme和榮耀在內的中階智慧型手機品牌缺乏足夠的議價能力來確保長期供貨,這進一步壓縮了300美元以下價位段本已微薄的利潤空間。記憶體市場歷來有週期性波動,預計2027年可能出現供應過剩,因此晶圓代工廠在擴大產能方面仍保持謹慎。
細分市場分析
預計到2031年,穿戴式裝置將以9.93%的複合年成長率成長,而智慧型手機在2025年佔據了亞太地區IT設備市場48.43%的佔有率。這一細分市場的成長主要得益於心電圖(ECG)、血氧飽和度和連續血糖監測等健康監測功能。日本、韓國和新加坡為使用這些功能的用戶提供10-15%的保險費折扣。配備條碼掃描器和熱成像攝影機的耐候型穿戴設備也在物流營運中取代傳統的手持終端機,推動了企業用戶需求的成長。平板電腦在2025年實現了兩位數的出貨量成長,這主要得益於印度和印尼教育計畫設備的普及,但其銷售量仍極易受到經濟週期的影響。筆記型電腦市場呈現複雜的趨勢:由於Windows 10將於2025年10月停止支持,企業升級需求激增;而由於記憶體價格上漲,單台筆記型電腦的成本增加了50至80美元,消費者需求有所放緩。桌上型電腦和工作站主要用於CAD設計和演算法交易等特定應用,使用者願意為多核心CPU和獨立顯示卡支付更高的價格。
現今,智慧型手機的差異化主要由軟體主導,生成式人工智慧助理和聯邦學習平台在提升使用者體驗的同時,也保障了使用者隱私。聯想的跨裝置助理能夠同步筆記型電腦、平板電腦和智慧型手機上的任務,展現了超越外形規格的融合趨勢。智慧型手機的毛利率約為20-25%,而穿戴式音訊設備和智慧戒指的毛利率則高達40-50%,這不僅豐富了穿戴式產品組合,也實現了收入來源的多元化。目前,亞太地區物流業對耐環境手持終端機的需求小規模,但隨著5G連接和邊緣人工智慧的普及,對傳統Windows CE終端的依賴性降低,該市場正在迅速擴張。
企業買家預計將以9.53%的複合年成長率成長,縮小與消費者之間的差距。 2025年,消費者貢獻了67.14%的收入,但如今他們的升級頻率有所下降。混合辦公模式要求筆記型電腦具備硬體信任根(HRT)功能,以滿足零信任安全標準,這推動了金融、醫療保健和科技業的設備升級。設備即服務(DaaS)以營運成本低廉的訂閱模式提供硬體、軟體和支持,吸引了那些規模較小、無法享受批量採購折扣的中小型企業。 2025年,印尼教育部部署了150萬台平板電腦,教育產業的採購量激增,但2027年的預算仍存在不確定性。
政府機構在採購要求中明確規定了能源效率和可回收性指標,這給採購設置了障礙,有利於擁有成熟合規體系的大型原始設備製造商 (OEM)。儘管在一些東協市場,中小企業在技術應用方面仍然落後,但一項2025年的調查顯示,75%的中小企業正在採用新的數位支付工具,這表明數位化普及正在推動硬體需求。隨著Windows 11硬體需求和人工智慧協處理器的標準化,亞太地區的企業筆記型電腦市場預計將穩定成長。
其他好處:
- Excel格式的市場預測(ME)表
- 3個月的分析師支持
目錄
第1章:引言
- 研究假設和市場定義
- 調查範圍
第2章:調查方法
第3章執行摘要
第4章 市場狀況
- 市場概覽
- 市場促進因素
- 5G基礎設施的快速部署正在加速設備更換週期。
- 擴大中小企業自備設備辦公室(BYOD)的採用率
- 提高二、三線城市家用電器電子商務滲透率。
- 政府對國內電子製造業的獎勵措施
- 家用電子電器中設備內人工智慧的新應用案例
- 遊戲化和電子競技正在推動對高性能設備的需求。
- 市場限制因素
- 半導體供應鏈的波動性
- 加強對電子廢棄物管理的監管
- 外匯波動對依賴進口的汽車製造商的影響
- 都市區高階智慧型手機市場飽和
- 宏觀經濟因素對市場的影響
- 產業價值鏈分析
- 監理情勢
- 技術展望
- 波特五力分析
第5章 市場規模與成長預測
- 依設備類型
- 智慧型手機
- 藥片
- 筆記型電腦
- 桌上型電腦和工作站
- 穿戴式裝置
- 電腦顯示器及周邊設備
- 按最終用戶行業分類
- 消費者
- 公司
- 政府/公共部門
- 教育
- 透過連接技術
- 相容5G
- 4G/LTE
- 僅限 Wi-Fi
- 有線
- 透過分銷管道
- 線下零售
- 線上零售
- 直接向企業銷售
- 增值轉售商
- 按地區
- 中國
- 日本
- 印度
- 韓國
- 澳洲和紐西蘭
- 其他亞太國家
第6章 競爭情勢
- 市場集中度
- 策略趨勢
- 市佔率分析
- 公司簡介
- Samsung Electronics Co., Ltd.
- Apple Inc.
- Huawei Technologies Co., Ltd.
- Xiaomi Corporation
- Lenovo Group Limited
- OPPO Guangdong Mobile Telecommunications Corp., Ltd.
- Vivo Mobile Communication Co., Ltd.
- ASUSTeK Computer Inc.
- Acer Inc.
- Dell Technologies Inc.
- HP Inc.
- Sony Group Corporation
- Panasonic Holdings Corporation
- LG Electronics Inc.
- Toshiba Corporation
- Fujitsu Limited
- NEC Corporation
- Transsion Holdings
- Realme Chongqing Mobile Telecommunications Corp. Ltd.
- HONOR Device Co., Ltd.
第7章 市場機會與未來展望
According to Mordor Intelligence, the asia-Pacific iT device market size is expected to grow from USD 0.72 trillion in 2025 to USD 0.79 trillion in 2026 and is forecast to reach USD 1.21 trillion by 2031 at an 8.73% CAGR over 2026-2031.
This report is Segmented by Device Type (Smartphones, Tablets, Laptops and Notebooks, Desktops and Workstations, Wearables, and PC Monitors and Peripherals), End-User Industry (Consumer, and More), Connectivity Technology (5G Enabled, 4G/LTE, Wi-Fi Only, and Wired), Distribution Channel (Offline Retail, Online Retail, and More), and Geography. The Market Forecasts are Provided in Terms of Value (USD).
Asia-Pacific IT Device Market Trends and Insights
Rapid 5G Infrastructure Roll-out Accelerating Device Refresh Cycles
Standalone 5G coverage surpassed 80% of Malaysia's population by December 2025, prompting logistics and manufacturing firms to replace 4G handhelds with 5G tablets that enable real-time routing and warehouse automation. India's leading operator extended standalone 5G to 300 cities, cutting network latency below 10 milliseconds, making cloud gaming and industrial IoT viable on mid-tier smartphones. Operators in Thailand and the Philippines now bundle 5G plans with device-financing offers, shortening replacement intervals. Although IMT-2020 rules retain backward compatibility, enterprises find that 4G chipsets cannot sustain the packet inspection overhead of network slicing policies, leading to the accelerated obsolescence of devices bought as recently as 2023. The largest gains are occurring in healthcare and manufacturing verticals that require guaranteed quality of service for mission-critical workloads.
Emerging AI-On-Device Use-Cases in Consumer Electronics
Data-localization laws in India, Indonesia, and Vietnam bar cross-border transfer of biometric and financial data, driving OEMs to shift inference workloads to the edge. Flagship smartphones launched in 2026 are running 7-billion-parameter language models locally, enabling real-time translation, meeting transcription, and privacy-preserving voice assistance without cloud calls. Samsung expects to preload Galaxy AI on 800 million devices during 2026, expanding monetization through premium subscriptions for productivity add-ons. Automotive OEMs are adopting custom AI chipsets for infotainment, signaling that on-device intelligence will transcend traditional computing form factors. The premium tier commands a 30-40% price uplift, as dedicated neural engines deliver lower latency and better battery life compared to CPU-bound inference on budget models.
Semiconductor Supply Chain Volatility
DRAM spot prices jumped 90-95% quarter-on-quarter in early 2026, and NAND prices rose 55-60%, as high-bandwidth memory was diverted to AI accelerators. Consumer laptops and entry-level tablets now face 16-20-week lead times for LPDDR5 modules, delaying product launches or forcing bill-of-materials redesigns around older memory that compromises battery life. PC OEMs have explored sourcing from second-tier suppliers, raising performance-validation and geopolitical concerns. Realme, Honor, and other mid-tier smartphone brands lack the purchasing clout to lock in long-term supply, squeezing already-thin margins in the sub-USD 300 bracket. Foundries remain cautious about adding capacity because the memory market is historically cyclical and could swing to oversupply by 2027.
Other drivers and restraints analyzed in the detailed report include:
- Government Incentives for Local Electronics Manufacturing
- Growing BYOD Adoption in Small and Medium Enterprises
- Intensifying Regulatory Scrutiny on E-waste Management
For complete list of drivers and restraints, kindly check the Table Of Contents.
Segment Analysis
Wearables are projected to post a 9.93% CAGR through 2031, while smartphones retained 48.43% of the Asia-Pacific IT device market share in 2025. The segment's rise is driven by health-monitoring functions such as ECG, blood-oxygen saturation, and continuous glucose monitoring that qualify users for 10-15% insurance premium discounts in Japan, South Korea, and Singapore. Ruggedized wearables equipped with barcode scanners and thermal cameras are also replacing legacy handhelds in logistics operations, capturing incremental demand from enterprise buyers. Tablets recorded double-digit shipment growth in 2025 as India and Indonesia distributed devices for education programs, yet volumes remain susceptible to fiscal cycles. Laptops experienced mixed dynamics, such as corporate upgrades surged ahead of Windows 10's end-of-support in October 2025, but consumer demand slowed due to memory price inflation, which added USD 50-80 per unit. Desktops and workstations serve niche applications such as CAD design and algorithmic trading, where users pay premiums for multi-core CPUs and discrete GPUs.
Smartphone differentiation is now software-led, with generative AI assistants and federated learning platforms augmenting the user experience without compromising privacy. Lenovo's cross-device assistant synchronizes tasks between laptops, tablets, and phones, demonstrating convergence across form factors. Hearables and smart rings, which carry 40-50% gross margins versus 20-25% for smartphones, extend the wearables family and diversify revenue streams. The Asia-Pacific IT device market for rugged handhelds in logistics is small today but expanding rapidly as 5G connectivity and edge AI reduce reliance on legacy Windows CE terminals.
Enterprise buyers are forecast to expand at a 9.53% CAGR, narrowing the gap with consumers, who generated 67.14% of 2025 revenue but now upgrade less frequently. Hybrid work models require laptops with hardware root-of-trust (HRT) features to meet zero-trust security standards, prompting fleet renewals across finance, healthcare, and technology verticals. Device-as-a-service offerings bundle hardware, software, and support into opex-friendly subscriptions, attracting SMEs that lack scale for volume discounts. Education procurements spiked in 2025 when Indonesia's Ministry of Education deployed 1.5 million tablets, though funding for 2027 is uncertain.
Government agencies specify energy-efficiency and recyclability metrics, adding procurement hurdles that favor established OEMs with mature compliance processes. SMEs remain technology laggards in some ASEAN markets, yet a 2025 survey showed 75% adopting new digital-payment tools, signaling broader digitization that will lift hardware demand. The Asia-Pacific IT device market for enterprise laptops is expected to expand steadily as Windows 11 hardware baselines and AI co-processors become standard.
List of Companies Covered in this Report:
- Samsung Electronics Co., Ltd.
- Apple Inc.
- Huawei Technologies Co., Ltd.
- Xiaomi Corporation
- Lenovo Group Limited
- OPPO Guangdong Mobile Telecommunications Corp., Ltd.
- Vivo Mobile Communication Co., Ltd.
- ASUSTeK Computer Inc.
- Acer Inc.
- Dell Technologies Inc.
- HP Inc.
- Sony Group Corporation
- Panasonic Holdings Corporation
- LG Electronics Inc.
- Toshiba Corporation
- Fujitsu Limited
- NEC Corporation
- Transsion Holdings
- Realme Chongqing Mobile Telecommunications Corp. Ltd.
- HONOR Device Co., Ltd.
Additional Benefits:
- The market estimate (ME) sheet in Excel format
- 3 months of analyst support
TABLE OF CONTENTS
1 INTRODUCTION
- 1.1 Study Assumptions and Market Definition
- 1.2 Scope of the Study
2 RESEARCH METHODOLOGY
3 EXECUTIVE SUMMARY
4 MARKET LANDSCAPE
- 4.1 Market Overview
- 4.2 Market Drivers
- 4.2.1 Rapid 5G Infrastructure Roll-out Accelerating Device Refresh Cycles
- 4.2.2 Growing BYOD Adoption in Small and Medium Enterprises
- 4.2.3 Expanding E-commerce Penetration for Electronics in Tier-2 and Tier-3 Cities
- 4.2.4 Government Incentives for Local Electronics Manufacturing
- 4.2.5 Emerging AI-On-Device Use-Cases in Consumer Electronics
- 4.2.6 Gamification and Esports Fueling Demand for High-Performance Devices
- 4.3 Market Restraints
- 4.3.1 Semiconductor Supply Chain Volatility
- 4.3.2 Intensifying Regulatory Scrutiny on E-waste Management
- 4.3.3 Currency Fluctuations Impacting Import-Dependent OEMs
- 4.3.4 Saturation of Premium Smartphone Segment in Urban Hubs
- 4.4 Impact of Macroeconomic Factors on the Market
- 4.5 Industry Value Chain Analysis
- 4.6 Regulatory Landscape
- 4.7 Technological Outlook
- 4.8 Porter's Five Forces Analysis
- 4.8.1 Bargaining Power of Suppliers
- 4.8.2 Bargaining Power of Buyers
- 4.8.3 Threat of New Entrants
- 4.8.4 Threat of Substitutes
- 4.8.5 Intensity of Competitive Rivalry
5 MARKET SIZE AND GROWTH FORECASTS (VALUE)
- 5.1 By Device Type
- 5.1.1 Smartphones
- 5.1.2 Tablets
- 5.1.3 Laptops and Notebooks
- 5.1.4 Desktops and Workstations
- 5.1.5 Wearables
- 5.1.6 PC Monitors and Peripherals
- 5.2 By End-User Industry
- 5.2.1 Consumer
- 5.2.2 Enterprise
- 5.2.3 Government and Public Sector
- 5.2.4 Education
- 5.3 By Connectivity Technology
- 5.3.1 5G Enabled
- 5.3.2 4G/LTE
- 5.3.3 Wi-Fi Only
- 5.3.4 Wired
- 5.4 By Distribution Channel
- 5.4.1 Offline Retail
- 5.4.2 Online Retail
- 5.4.3 Enterprise Direct Sales
- 5.4.4 Value-Added Resellers
- 5.5 By Geography
- 5.5.1 China
- 5.5.2 Japan
- 5.5.3 India
- 5.5.4 South Korea
- 5.5.5 Australia and New Zealand
- 5.5.6 Rest of Asia Pacific
6 COMPETITIVE LANDSCAPE
- 6.1 Market Concentration
- 6.2 Strategic Moves
- 6.3 Market Share Analysis
- 6.4 Company Profiles (includes Global Level Overview, Market Level Overview, Core Segments, Financials as available, Strategic Information, Market Rank/Share, Products and Services, Recent Developments)
- 6.4.1 Samsung Electronics Co., Ltd.
- 6.4.2 Apple Inc.
- 6.4.3 Huawei Technologies Co., Ltd.
- 6.4.4 Xiaomi Corporation
- 6.4.5 Lenovo Group Limited
- 6.4.6 OPPO Guangdong Mobile Telecommunications Corp., Ltd.
- 6.4.7 Vivo Mobile Communication Co., Ltd.
- 6.4.8 ASUSTeK Computer Inc.
- 6.4.9 Acer Inc.
- 6.4.10 Dell Technologies Inc.
- 6.4.11 HP Inc.
- 6.4.12 Sony Group Corporation
- 6.4.13 Panasonic Holdings Corporation
- 6.4.14 LG Electronics Inc.
- 6.4.15 Toshiba Corporation
- 6.4.16 Fujitsu Limited
- 6.4.17 NEC Corporation
- 6.4.18 Transsion Holdings
- 6.4.19 Realme Chongqing Mobile Telecommunications Corp. Ltd.
- 6.4.20 HONOR Device Co., Ltd.
7 MARKET OPPORTUNITIES AND FUTURE OUTLOOK
- 7.1 White-Space and Unmet-Need Assessment
 2026年全球資訊科技(IT)網路市場報告
 IT設備:市場佔有率分析、產業趨勢與統計、成長預測(2026-2031年)北美IT設備:市場佔有率分析、產業趨勢與統計及成長預測(2026-2031年)南美洲IT設備:市場佔有率分析、產業趨勢與統計及成長預測(2026-2031年)歐洲IT設備:市場佔有率分析、產業趨勢與統計、成長預測(2026-2031年)
 ITaaS(資訊科技即服務)市場報告:按類型、應用和地區分類(2026-2034 年)2026年全球混合資訊科技(IT)管理市場報告2026年全球資訊科技(IT)營運管理軟體市場報告2026年全球資訊科技(IT)資產管理軟體市場報告
 超個人化技術市場規模、佔有率和趨勢分析報告:按組件、技術、應用、最終用途、地區和細分市場預測(2026-2033 年)