


 |
市場調查報告書
商品編碼
2061747
IT設備:市場佔有率分析、產業趨勢與統計、成長預測(2026-2031年)IT Device - Market Share Analysis, Industry Trends & Statistics, Growth Forecasts (2026 - 2031) |
||||||
※ 本網頁內容可能與最新版本有所差異。詳細情況請與我們聯繫。
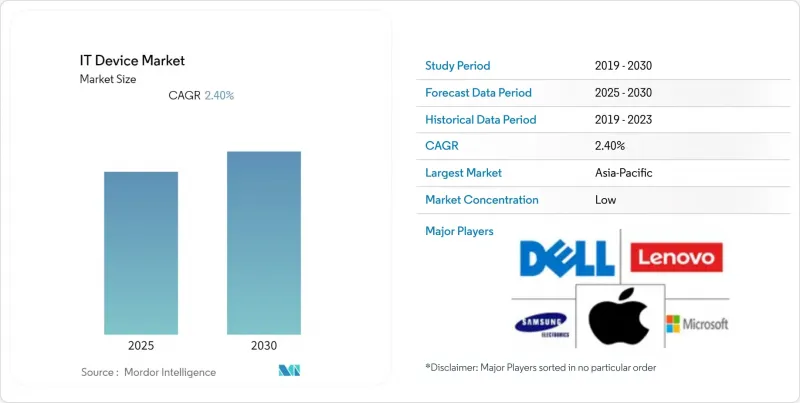
根據 Mordor Intelligence 預測,IT 設備市場規模將從 2025 年的 2.14 兆美元成長到 2026 年的 2.345 兆美元,到 2031 年將達到 3.49 兆美元,2026 年至 2031 年的複合年成長率預計為 8.33%。
本報告按裝置類型(智慧型手機、筆記型電腦、桌上型電腦、平板電腦、穿戴式裝置、印表機及周邊設備、外部儲存裝置)、終端使用者產業(消費者、其他)、連接技術(有線、Wi-Fi、其他)、通路(線上零售、線下零售、直銷、增值轉售商)和地區進行細分。市場預測以美元計價。
全球IT設備市場趨勢與洞察
透過整合邊緣人工智慧晶片實現設備內處理
神經處理單元 (NPU) 正從資料中心轉移到普通的智慧型手機、筆記型電腦和平板電腦,從而實現生成式人工智慧的即時推理,且無需雲端延遲。高通驍龍 X2 Elite 的運算速度達到 50 TOPS,而 Arm 的 Ethos-U85 微型 NPU 則面向始終線上運作設備。歐盟和中國的資料主權法律要求將敏感資料儲存在本地設備上,這促使企業需要能夠直接執行大型量化語言模型的硬體。谷歌在安卓裝置中搭載的 Coral Edge TPU 實現了 4 毫秒的目標偵測延遲,比基於雲端的處理速度提升了 10 倍。由於傳統處理器無法有效率地支援最新的推理工作負載,設備更換越來越注重人工智慧加速器的效能。
5G部署的加速將促進設備更新換代。
根據GSMA的調查,2025年底,全球5G獨立網路核心網路的普及率將達到17.6%,與非獨立網路方式相比,下載速度中位數將提升40%。 Ookla已證實,在韓國和美國部分地區,5G的延遲始終保持在20毫秒以下,從而支援雲端遊戲和擴增實境(AR)等應用程式場景。安聯的一項調查發現,消費者升級設備並非僅為了使用5G,但企業正在更新其耐環境的平板電腦和掃描儀,以滿足即時庫存管理和自動駕駛汽車的需求。工廠和港口等場所部署的專用5G網路正在提高行動電腦的規格要求,並進一步刺激IT設備市場的需求。
地緣政治出口限制了先進晶片的獲取
2024年10月,美國工業與安全局(BIS)對超過300 TOPS或1200 TOPS/mm²的未經許可的晶片出口實施限制,迫使晶片製造商為中國市場生產性能降低的晶片。東南亞分銷商現在需要驗證最終用途,導致交貨延遲和合規負擔增加。華為透露,2025年其零件成本將飆升18%,其高階智慧型手機在製程技術方面落後全球領導企業兩代。儘管中國OEM廠商正在加快國內生產計畫,但預計仍需三到五年才能趕上最尖端科技,這抑制了高階設備的創新,並減緩了全球IT設備市場的成長潛力。
細分市場分析
穿戴式裝置以9.73%的複合年成長率實現了最高增速,而智慧型手機市場將在2025年佔整個IT設備市場的41.32%。 Meta佔了全球XR頭顯出貨量的50.8%,顯示消費者對XR的認知度正在向企業試點部署擴展。像Withings BeamO Pro這樣的連網健康監測器將醫療效用與消費者便利性結合,拓展了其應用情境。售價超過1500美元的折疊式智慧型手機構成了一個超高階細分市場,但與主流機型相比,其出貨量仍然較低。同時,印表機正面臨數位轉型的挑戰,新的成長僅限於工業標籤和3D原型製作。隨著希捷和西部數據逐步淘汰傳統機械硬碟並專注於高容量近線產品,外部儲存正在向固態解決方案轉型。
平板電腦和筆記型電腦的發展趨勢截然相反。基於雲端的生產力提升降低了非技術崗位對高效能桌上型電腦的需求,而混合辦公模式的興起則推動了超輕薄筆記型電腦在視訊會議領域的更換。高通驍龍X2 Elite處理器實現了無風扇企業級筆記型電腦的普及,挑戰了傳統的x86架構,並將電池續航時間延長至20小時以上。桌上型電腦的市佔率正在萎縮,主要集中在遊戲和工作站等細分市場,在這些市場中,獨立顯示卡和開放式架構比行動性更為重要。同時,穿戴式裝置正朝著健身、商用和工業等多種方向發展,更強化了IT設備市場各細分領域的專業化。
2025年,消費支出佔總銷售額的52.64%,但醫療保健產業表現優於其他所有產業,到2031年複合年成長率將達到9.53%。隨著醫院採用持續監測系統,雲端連接醫療設備的IT設備市佔率正在擴大,預計到2029年將達到1,206億美元。飛利浦與Respiree合作,將FDA已通過核准的心肺感測器整合到穿戴式裝置中。同時,思科的Wi-Fi 7骨幹網路即時聚合病患資料。網路安全認證的硬體是政府採購的優先考慮因素,教育預算也從疫情期間的激增轉向穩定的Chromebook升級。工業和製造業用戶正在部署整合專用5G網路的耐環境平板電腦,用於自動駕駛車輛的校準和品管。
企業負責人在混合辦公環境中維護多設備環境,並對生物識別安全和終端管理提出了更高的要求。醫療軟體即醫療設備(SaaS)正在加速核准流程,並加強臨床醫生和開發人員之間的回饋循環。儘管由於已開發地區消費市場的飽和,銷售量成長正轉向新興市場,但對高階設備的需求仍然強勁,從而維持了價值成長。整體而言,醫療保健和企業級市場共同推動了IT設備市場利潤率的提升。
區域分析
預計到2025年,北美將佔全球銷售額的34.98%,這主要得益於對高階設備的需求以及混合辦公模式下的硬體升級。 Workwize的研究顯示,每位員工平均擁有2.3個終端設備,儘管設備壽命逐漸延長,但這項指標仍推動了更換需求。對終端安全的投入推高了平均售價,跨境電商則以具有競爭力的價格將美國產品引入加拿大和墨西哥市場。監管力度加大,更重視資料隱私而非硬體進口關稅,有助於區域內貿易的順暢進行。
預計到2031年,亞太地區將以每年9.38%的速度成長,這得益於製造地的轉移和中產階級需求的激增。印度的生產連結獎勵計畫計畫已批准450億美元的電子產品出口,促使富士康和三星擴大產能。越南1740億美元的電子產品出口額顯示其經濟正在擺脫對中國的依賴,但其對外部需求的高度依賴使其容易受到全球貿易政策波動的影響。一旦記憶體短缺問題緩解,該地區的個人電腦出貨量預計將會回升,從而促進支援當地IT設備市場的硬體分銷。
在歐洲,儘管經濟不確定性,但預計市場將保持穩定成長,而強力的監管因素正在推動設備更換。歐盟的生態設計法規將於2025年6月生效,該法規要求企業履行七年零件供應義務並展示可維修性評分,這將導致許多2022年之前的型號不符合規定。採用模組化設計的製造商將獲得先發優勢,而零售商則需要管理多樣化的庫存以滿足合規期限。在南美洲,成長主要集中在巴西(智慧型手機普及率不斷提高)和阿根廷(由於政府的數位化政策,教育平板電腦的需求正在成長)。中東和非洲市場基數小規模,但正在快速成長。海灣合作理事會波灣合作理事會由於5G網路的部署而提高了企業硬體規格,而非洲市場則更青睞價格低廉且符合購買力的智慧型手機。
其他好處:
- Excel格式的市場預測(ME)表
- 3個月的分析師支持
目錄
第1章:引言
- 研究假設和市場定義
- 調查範圍
第2章:調查方法
第3章執行摘要
第4章 市場狀況
- 市場概覽
- 市場促進因素
- 5G部署的加速將加快設備更換週期。
- 透過整合邊緣人工智慧晶片實現設備內處理
- 混合工作模式支援多設備需求
- XR穿戴裝置在企業培訓的應用。
- 對電子廢棄物的更嚴格監管正在推動模組化設計的普及。
- 半導體供應多元化以緩解價格波動
- 市場限制因素
- 地緣政治出口限制了先進晶片的獲取
- 已開發國家消費電子設備的飽和度
- 原始設備製造商網路安全認證成本不斷上漲
- 二手設備市場蓬勃發展,蠶食了新產品的銷售量。
- 宏觀經濟因素對市場的影響
- 產業價值鏈分析
- 監理情勢
- 技術展望
- 波特五力分析
第5章 市場規模與成長預測
- 依設備類型
- 智慧型手機
- 筆記型電腦
- 桌面
- 藥片
- 穿戴式裝置
- 印表機及周邊設備
- 外部儲存設備
- 按最終用戶行業分類
- 消費者
- 公司
- 政府
- 教育
- 衛生保健
- 工業和製造業
- 透過連接技術
- 有線
- Wi-Fi
- 蜂窩網路(4G/5G)
- Bluetooth
- 近距離場通訊
- 透過分銷管道
- 線上零售
- 線下零售
- 直銷
- 增值轉售商
- 按地區
- 北美洲
- 美國
- 加拿大
- 墨西哥
- 南美洲
- 巴西
- 阿根廷
- 其他南美國家
- 歐洲
- 英國
- 德國
- 法國
- 義大利
- 西班牙
- 其他歐洲國家
- 亞太地區
- 中國
- 日本
- 印度
- 韓國
- 其他亞太國家
- 中東和非洲
- 中東
- 阿拉伯聯合大公國
- 沙烏地阿拉伯
- 其他中東國家
- 非洲
- 南非
- 埃及
- 其他非洲國家
- 中東
- 北美洲
第6章 競爭情勢
- 市場集中度
- 策略趨勢
- 市佔率分析
- 公司簡介
- Apple Inc.
- Samsung Electronics Co., Ltd.
- Dell Technologies Inc.
- HP Inc.
- Lenovo Group Limited
- ASUSTeK Computer Inc.
- Acer Inc.
- Huawei Technologies Co., Ltd.
- Xiaomi Corporation
- Microsoft Corporation
- LG Electronics Inc.
- Sony Group Corporation
- Fujitsu Limited
- Panasonic Holdings Corporation
- Toshiba Electronic Devices and Storage Corporation
- Zebra Technologies Corporation
- Seagate Technology Holdings plc
- Western Digital Corporation
- Canon Inc.
- Brother Industries, Ltd.
第7章 市場機會與未來展望
According to Mordor Intelligence, the iT device market size is expected to increase from USD 2.14 trillion in 2025 to USD 2.345 trillion in 2026 and reach USD 3.49 trillion by 2031, growing at a CAGR of 8.33% over 2026-2031.
This report is Segmented by Device Type (Smartphones, Laptops, Desktops, Tablets, Wearables, Printers and Peripherals, and External Storage Devices), End-User Industry (Consumer, and More), Connectivity Technology (Wired, Wi-Fi, and More), Distribution Channel (Online Retail, Offline Retail, Direct Sales, and Value-Added Resellers), and Geography. The Market Forecasts are Provided in Terms of Value (USD).
Global IT Device Market Trends and Insights
Edge-AI Chip Integration Enabling On-Device Processing
Neural processing units are migrating from data centers into mainstream smartphones, laptops, and tablets, bringing real-time inference for generative artificial intelligence without cloud latency. Qualcomm's Snapdragon X2 Elite hits 50 TOPS, while Arm's Ethos-U85 microNPU targets always-on wearables. Data-sovereignty laws in the European Union and China require sensitive data to be stored on local devices, pushing enterprises to demand hardware that can run quantized large-language models directly. Google's Coral Edge TPU, added to Android handsets, achieved 4-millisecond object-detection latency, a tenfold improvement over cloud paths. Device replacement cycles now pivot on AI accelerator capabilities because legacy processors cannot efficiently support modern inference workloads.
Accelerating 5G Roll-Outs Boosting Device Refresh Cycles
GSMA recorded 17.6% global penetration of 5G standalone cores by late 2025, delivering median download speeds 40% higher than those of non-standalone builds. Ookla confirmed consistent sub-20-millisecond latency in South Korea and parts of the United States, unlocking cloud gaming and augmented-reality use cases. Although Allianz found consumers did not upgrade solely for 5G, enterprises are replacing ruggedized tablets and scanners to meet real-time inventory and autonomous vehicle demands. Private 5G in factories and ports raises the baseline specifications for mobile computers, injecting incremental volumes into the IT device market.
Geopolitical Export Controls Limiting Advanced Chip Access
The United States Bureau of Industry and Security capped unlicensed shipments above 300 TOPS or 1,200 TOPS/mm2 in October 2024, forcing chipmakers to build detuned variants for China. Distributors in Southeast Asia now require end-use verification, delaying deliveries and adding compliance overhead. Huawei disclosed a 18% surge in component costs in 2025, while its premium phones lag two process nodes behind global leaders. Chinese OEMs are accelerating domestic fabrication plans, yet leading-edge parity remains three to five years away, restraining premium device innovation and tempering the IT device market's global upside.
Other drivers and restraints analyzed in the detailed report include:
- Hybrid Work Models Sustaining Multi-Device Demand
- Emergence of XR-Ready Wearables for Enterprise Training
- Intensifying Second-Hand Device Ecosystem Cannibalizing New Sales
For complete list of drivers and restraints, kindly check the Table Of Contents.
Segment Analysis
Wearables posted the highest growth at a 9.73% CAGR, while smartphones retained 41.32% of the 2025 value in the IT device market. Meta commanded 50.8% of global XR headset shipments, proving consumer familiarity now extends into enterprise pilots. Cellular-enabled health monitors such as Withings BeamO Pro merge medical utility with consumer convenience, widening addressable use cases. Foldable phones priced above USD 1,500 create a super-premium niche, but their volumes remain small relative to mainstream models. Meanwhile, printers confront digital substitution, with new growth limited to industrial labels and 3D prototyping. External storage migrates to solid-state solutions as Seagate and Western Digital phase out legacy mechanical drives in favor of high-capacity nearline offerings.
Tablets and laptops experience divergent dynamics. Cloud productivity minimizes the need for high-spec desktops in non-technical roles, yet hybrid work catalyzes ultralight laptop upgrades to support video collaboration. Qualcomm's Snapdragon X2 Elite enables fanless enterprise laptops, challenging x86 incumbency and extending daily battery life beyond 20 hours. Desktops withdraw into gaming and workstation niches where discrete graphics and open architecture outweigh mobility. Wearables, however, diversify into fitness, professional, and industrial variants, reinforcing specialization across device categories inside the IT device market.
Consumer spending accounted for 52.64% of revenue in 2025, but healthcare outpaced all verticals with a 9.53% CAGR through 2031. The IT device market share for cloud-connected medical equipment is accelerating as hospitals deploy continuous monitoring systems, projected to reach USD 120.6 billion by 2029. Philips partnered with Respiree to embed FDA-cleared cardio-respiratory sensors into wearables, while Cisco's Wi-Fi 7 backbone aggregates patient data in real time. Government procurement focuses on cybersecurity-validated hardware, and education budgets shift from pandemic peaks to steady Chromebook replacements. Industrial and manufacturing users install ruggedized tablets integrated with private 5G for autonomous vehicle coordination and quality control.
Enterprise buyers maintain multi-device setups in hybrid work environments, demanding biometric security and endpoint management. Software-as-a-medical-device fast-tracks approvals, tightening feedback loops between clinicians and developers. Consumer saturation in developed regions pushes volume gains toward emerging markets, yet premium device demand remains resilient, preserving value growth. Overall, the healthcare and enterprise segments collectively drive margin expansion in the IT device market.
Geography Analysis
North America accounted for 34.98% of 2025 revenue, underpinned by premium device demand and hybrid-work hardware upgrades. Workwize documented employees averaging 2.3 endpoints, a metric that pushes replacement volumes even as lifespans edge upward. Endpoint security investments bolster average selling prices, and cross-border e-commerce funnels United States offerings into Canada and Mexico at competitive rates. Regulatory scrutiny remains focused on data privacy rather than hardware import duties, sustaining smooth intra-regional trade.
Asia-Pacific, forecast to grow at 9.38% through 2031, benefits from both manufacturing migration and burgeoning middle-class demand. India's production-linked incentive scheme approved USD 45 billion in electronics exports, drawing Foxconn and Samsung to expand capacity. Vietnam's USD 174 billion in electronics exports illustrate diversification away from China, though reliance on external demand exposes it to swings in global trade policy. The region's personal computer shipments are expected to rebound once memory constraints ease, reinforcing hardware flows that feed the local IT device market.
Europe experiences measured gains amid economic uncertainty, with robust regulatory triggers for device replacement. The European Union's ecodesign rules, effective June 2025, mandate seven-year spare-parts availability and visible repairability scores, rendering many pre-2022 models non-compliant. Manufacturers that respond with modular designs gain an early-mover edge, while retailers manage mixed inventories to meet compliance deadlines. South America concentrates growth in Brazil, where smartphone adoption is expanding, and Argentina, where government digital initiatives are procuring education tablets. Middle East and Africa advance from smaller bases, with Gulf Cooperation Council countries deploying 5G networks that elevate enterprise hardware specifications, while African markets favor budget smartphones aligned with purchasing power.
- Apple Inc.
- Samsung Electronics Co., Ltd.
- Dell Technologies Inc.
- HP Inc.
- Lenovo Group Limited
- ASUSTeK Computer Inc.
- Acer Inc.
- Huawei Technologies Co., Ltd.
- Xiaomi Corporation
- Microsoft Corporation
- LG Electronics Inc.
- Sony Group Corporation
- Fujitsu Limited
- Panasonic Holdings Corporation
- Toshiba Electronic Devices and Storage Corporation
- Zebra Technologies Corporation
- Seagate Technology Holdings plc
- Western Digital Corporation
- Canon Inc.
- Brother Industries, Ltd.
Additional Benefits:
- The market estimate (ME) sheet in Excel format
- 3 months of analyst support
TABLE OF CONTENTS
1 INTRODUCTION
- 1.1 Study Assumptions and Market Definition
- 1.2 Scope of the Study
2 RESEARCH METHODOLOGY
3 EXECUTIVE SUMMARY
4 MARKET LANDSCAPE
- 4.1 Market Overview
- 4.2 Market Drivers
- 4.2.1 Accelerating 5G Roll-outs Boosting Device Refresh Cycles
- 4.2.2 Edge-AI Chip Integration Enabling On-Device Processing
- 4.2.3 Hybrid Work Models Sustaining Multi-Device Demand
- 4.2.4 Emergence of XR-Ready Wearables for Enterprise Training
- 4.2.5 Growing E-waste Regulations Spurring Modular Designs
- 4.2.6 Semiconductor Supply Diversification Mitigating Price Volatility
- 4.3 Market Restraints
- 4.3.1 Geopolitical Export Controls Limiting Advanced Chip Access
- 4.3.2 Consumer Device Saturation in Developed Economies
- 4.3.3 Rising Cyber-security Certification Costs for OEMs
- 4.3.4 Intensifying Second-hand Device Ecosystem Cannibalizing New Sales
- 4.4 Impact of Macroeconomic Factors on the Market
- 4.5 Industry Value Chain Analysis
- 4.6 Regulatory Landscape
- 4.7 Technological Outlook
- 4.8 Porter's Five Forces Analysis
- 4.8.1 Bargaining Power of Suppliers
- 4.8.2 Bargaining Power of Buyers
- 4.8.3 Threat of New Entrants
- 4.8.4 Threat of Substitutes
- 4.8.5 Intensity of Competitive Rivalry
5 MARKET SIZE AND GROWTH FORECASTS (VALUE)
- 5.1 By Device Type
- 5.1.1 Smartphones
- 5.1.2 Laptops
- 5.1.3 Desktops
- 5.1.4 Tablets
- 5.1.5 Wearables
- 5.1.6 Printers and Peripherals
- 5.1.7 External Storage Devices
- 5.2 By End-User Industry
- 5.2.1 Consumer
- 5.2.2 Enterprise
- 5.2.3 Government
- 5.2.4 Education
- 5.2.5 Healthcare
- 5.2.6 Industrial and Manufacturing
- 5.3 By Connectivity Technology
- 5.3.1 Wired
- 5.3.2 Wi-Fi
- 5.3.3 Cellular (4G/5G)
- 5.3.4 Bluetooth
- 5.3.5 Near-Field Communication
- 5.4 By Distribution Channel
- 5.4.1 Online Retail
- 5.4.2 Offline Retail
- 5.4.3 Direct Sales
- 5.4.4 Value-Added Resellers
- 5.5 By Geography
- 5.5.1 North America
- 5.5.1.1 United States
- 5.5.1.2 Canada
- 5.5.1.3 Mexico
- 5.5.2 South America
- 5.5.2.1 Brazil
- 5.5.2.2 Argentina
- 5.5.2.3 Rest of South America
- 5.5.3 Europe
- 5.5.3.1 United Kingdom
- 5.5.3.2 Germany
- 5.5.3.3 France
- 5.5.3.4 Italy
- 5.5.3.5 Spain
- 5.5.3.6 Rest of Europe
- 5.5.4 Asia-Pacific
- 5.5.4.1 China
- 5.5.4.2 Japan
- 5.5.4.3 India
- 5.5.4.4 South Korea
- 5.5.4.5 Rest of Asia-Pacific
- 5.5.5 Middle East and Africa
- 5.5.5.1 Middle East
- 5.5.5.1.1 United Arab Emirates
- 5.5.5.1.2 Saudi Arabia
- 5.5.5.1.3 Rest of Middle East
- 5.5.5.2 Africa
- 5.5.5.2.1 South Africa
- 5.5.5.2.2 Egypt
- 5.5.5.2.3 Rest of Africa
- 5.5.5.1 Middle East
- 5.5.1 North America
6 COMPETITIVE LANDSCAPE
- 6.1 Market Concentration
- 6.2 Strategic Moves
- 6.3 Market Share Analysis
- 6.4 Company Profiles (includes Global Level Overview, Market Level Overview, Core Segments, Financials as available, Strategic Information, Market Rank/Share, Products and Services, Recent Developments)
- 6.4.1 Apple Inc.
- 6.4.2 Samsung Electronics Co., Ltd.
- 6.4.3 Dell Technologies Inc.
- 6.4.4 HP Inc.
- 6.4.5 Lenovo Group Limited
- 6.4.6 ASUSTeK Computer Inc.
- 6.4.7 Acer Inc.
- 6.4.8 Huawei Technologies Co., Ltd.
- 6.4.9 Xiaomi Corporation
- 6.4.10 Microsoft Corporation
- 6.4.11 LG Electronics Inc.
- 6.4.12 Sony Group Corporation
- 6.4.13 Fujitsu Limited
- 6.4.14 Panasonic Holdings Corporation
- 6.4.15 Toshiba Electronic Devices and Storage Corporation
- 6.4.16 Zebra Technologies Corporation
- 6.4.17 Seagate Technology Holdings plc
- 6.4.18 Western Digital Corporation
- 6.4.19 Canon Inc.
- 6.4.20 Brother Industries, Ltd.
7 MARKET OPPORTUNITIES AND FUTURE OUTLOOK
- 7.1 White-Space and Unmet-Need Assessment
 2026年全球資訊科技(IT)網路市場報告
 亞太地區IT設備:市場佔有率分析、產業趨勢與統計及成長預測(2026-2031年)北美IT設備:市場佔有率分析、產業趨勢與統計及成長預測(2026-2031年)南美洲IT設備:市場佔有率分析、產業趨勢與統計及成長預測(2026-2031年)歐洲IT設備:市場佔有率分析、產業趨勢與統計、成長預測(2026-2031年)
 ITaaS(資訊科技即服務)市場報告:按類型、應用和地區分類(2026-2034 年)2026年全球混合資訊科技(IT)管理市場報告2026年全球資訊科技(IT)營運管理軟體市場報告2026年全球資訊科技(IT)資產管理軟體市場報告
 超個人化技術市場規模、佔有率和趨勢分析報告:按組件、技術、應用、最終用途、地區和細分市場預測(2026-2033 年)