


 |
市場調查報告書
商品編碼
2035044
貨運與物流:市場佔有率分析、產業趨勢與統計、成長預測(2026-2031)Freight And Logistics - Market Share Analysis, Industry Trends & Statistics, Growth Forecasts (2026 - 2031) |
||||||
※ 本網頁內容可能與最新版本有所差異。詳細情況請與我們聯繫。
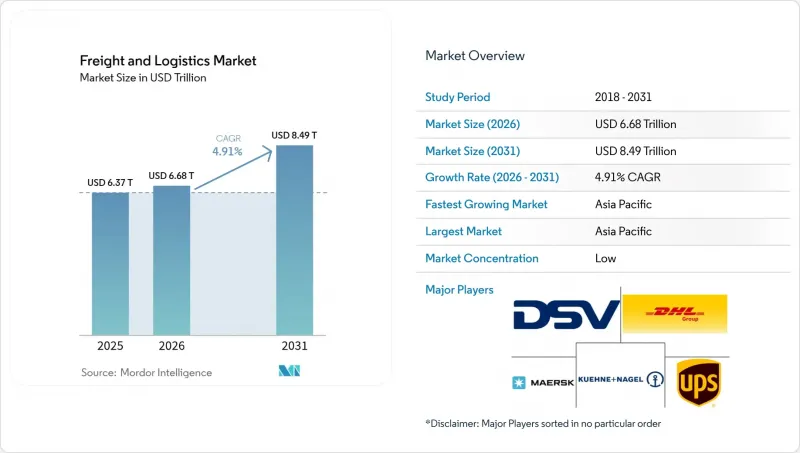
預計貨運和物流市場規模將從 2025 年的 6.37 兆美元成長到 2026 年的 6.68 兆美元,到 2031 年將達到 8.49 兆美元,2026 年至 2031 年的複合年成長率為 4.91%。
在強勁的電子商務活動、基礎設施現代化、跨境宅配小包裹服務需求不斷成長以及公私合營加速推進的推動下,貨運和物流市場保持著穩步成長的態勢。儘管貨運仍然是全球貿易的基礎,但隨著托運人對一體化解決方案的需求日益成長,該領域正向貨運代理、倉儲和最後一公里履約等多元化方向發展。亞太地區的強勁勢頭、向範圍3排放報告方向推進的法規以及在自動化、可視性和預測最佳化方面的技術投資,持續重塑著競爭策略和成本結構。以DSV收購DB Schenker為例的產業重組,凸顯了該產業對規模、網路密度和技術的重視,以解決運力瓶頸和司機短缺問題。
全球貨運及物流市場趨勢及洞察
電子商務在新興市場的傳播
智慧型手機的普及和亞太及拉丁美洲數位支付的興起,加劇了對快速訂單履行的需求,迫使物流供應商在人口密集的城市地區附近建造微型倉配中心。這種結構性轉變正在推動國際小包裹遞送(CEP)業務量的成長。雖然小包裹遞送利潤率高,但需要強大的清關能力、統一的產品分類和數據驅動的貨運可視性。為了滿足消費者日益成長的配送期望,供應商正在投資自動化分類、人工智慧驅動的路線規劃和全通路庫存管理。隨著區域法規結構的碎片化日益複雜,海關當局正在建立合作,以簡化跨境電子商務的合規流程。隨著這些努力的成熟,跨境小包裹的流動進一步將中小經銷商融入全球貿易網路,從而擴大了整體貨運和物流市場。
對當日送達按需服務的期望
在成熟的消費市場中,超過三分之一的消費者現在更傾向於當日送達重要商品,這迫使零售商重新思考其物流配送模式。實體店正日益成為超當地語系化的履約中心,縮短了最後一公里配送距離,降低了每個小包裹的成本。自動化倉儲系統、協作機器人和預測性勞動力調度正在提升都市區微型倉庫的產能。最後一公里配送專家正在利用群眾外包配送人員、動態路線規劃軟體和應用程式介面 (API) 整合,將即時訂單資料導入車輛管理工具,以確保兩小時內送達。消費者對服務的高期望給傳統宅配的利潤率帶來了越來越大的壓力,同時也為瞄準北美、歐洲和亞太已開發地區人口稠密城市的科技驅動型新興參與企業開闢了擴張之路。
司機短缺和勞動力老化
美國和西歐的職業卡車駕駛人平均年齡超過50歲,由於生活方式的考量和培訓延誤,人才供應無法跟上需求成長。不斷上漲的人事費用推高了合約價格,增加了最後一公里配送成本,並限制了公司在旺季滿足激增需求的能力。為了緩解這個問題,運輸公司正在實施遠端資訊處理技術以最佳化調度,引入駕駛輔助技術以減輕疲勞,並在管理路線上試點自動駕駛車輛編隊行駛。倉儲業也面臨類似的勞動力短缺問題,這促使企業投資於機器人技術和自動化碼垛,並將焦點從貨物轉向人員。持續的勞動力短缺仍然是貨運和物流市場潛在生產力提升的最大限制。
細分市場分析
到2025年,批發和零售將佔貨運和物流市場規模的33.10%,這主要受持續的補貨履約、全通路履行以及促銷季期間需求波動的影響。庫存分散化策略需要區域配送中心和門市補貨樞紐之間的靈活中程運輸。電子商務的蓬勃發展提高了小包裹密度,對傳統的樞紐輻射式網路構成挑戰,同時也推動了對分類自動化和承運商多元化的投資。
製造業正以5.17%的複合年成長率(2026-2031年)高速成長,在地化促進了原物料和零件在非洲大陸的流通。目的地設備製造商(OEM)正在強制推行準時制生產、精準的生產線交付和即時可視性,以協調多個工廠的生產。重型貨物、專案貨物和溫控貨物運輸領域受益於對高價值機械、電子產品和藥品的需求,從而擴大了貨運和物流市場的潛在總收入(TAR)。供應商管理庫存(VMI)和供應商園區等專業物流模式日益普及,促進了製造商與第三方物流供應商(3PL)之間更深入的合作。
到2025年,貨運將佔貨運和物流市場規模的61.45%,這得益於龐大的公路、鐵路、海運和空運網路,該網路為全球貿易提供了堅實的實體基礎。其成熟的基礎預計將使其在2026年至2031年間保持4.19%的複合年成長率,實現溫和成長,因為宏觀貿易成長抵消了效率提升帶來的收益。貨運代理商預計將以5.18%的複合年成長率成長(2026-2031年),利用數位化訂艙平台、貨物視覺化儀錶板和海關專業知識來協調多模態路線。中小出口商越來越依賴貨運代理來確保合規性和選擇承運商,從而推動了其在貨運和物流領域的市場佔有率成長。
各供應商都在整合關稅分類引擎、同步文件工作流程和到貨預測演算法,以縮短邊境清關時間。隨著全球供應鏈日益多元化,跨越多個始發地,端到端協調和異常管理成為關鍵的差異化因素,使貨運代理能夠贏得那些優先考慮靈活性而非單純成本的托運人的合約。因此,儘管資產密集型運輸企業在絕對收入規模上仍然佔據主導地位,但貨運代理在貨運和物流市場的佔有率正在穩步成長。
區域分析
到2025年,亞太地區將佔全球貨運和物流市場規模的41.20%,預計2026年至2031年間將以6.15%的複合年成長率成為該行業成長最快的地區,這主要得益於貿易路線從中國向東南亞、印度和大洋洲的多元化發展。上海、新加坡和科倫坡等大規模港口的擴建、中老高速鐵路貨運線路的開通以及數位化單一窗口海關服務等舉措,將縮短運輸時間並降低合規成本。製造地向越南、印尼和菲律賓的轉移,也推動了亞洲內部卡車運輸、支線船舶運輸和跨境鐵路運輸需求的成長。
歐洲憑藉其高運力鐵路貨運走廊、沿海航運網路以及申根區內統一的海關程序,維持強大的多模態體系。其在永續性領域的領先地位正在重塑運輸路線的經濟格局,促使氫燃料卡車的早期應用、最後一公里運輸的電氣化以及運輸方式轉換的獎勵得以實施。儘管與俄羅斯的地緣政治緊張局勢使東部陸路運輸變得複雜,但對波羅的海和地中海門戶港口的投資正在促進替代供應路線的開闢,並保持貨運和物流市場的競爭力。
北美正受益於墨西哥和加拿大的近岸外包模式,這推動了跨境貨車運輸量的成長,並促進了雙邊海關程序的協調統一。美國的《基礎設施投資與就業法案》正在加速公路維修、內陸港口開發和港口疏浚工程。一級鐵路公司正在擴大多式聯運碼頭,以滿足電子商務激增的需求,而墨西哥灣沿岸的港口開發則透過擴建後的巴拿馬運河,吸引來自亞洲的遠洋航線。這些舉措共同推動著該地區的貨運和物流市場保持約5%的年成長率。
其他好處:
- Excel格式的市場預測(ME)表
- 3個月的分析師支持
目錄
第1章:引言
- 研究假設和市場定義
- 調查範圍
第2章:調查方法
第3章執行摘要
第4章 市場狀況
- 市場概覽
- 人口動態
- 按經濟活動分類的GDP構成
- 按經濟活動分類的GDP成長率
- 通貨膨脹
- 經濟表現及概覽
- 電子商務產業趨勢
- 製造業的發展趨勢
- 運輸和倉儲部門的GDP
- 出口趨勢
- 進口趨勢
- 燃油價格
- 卡車運輸營運成本
- 按車輛類型分類的運輸卡車數量
- 主要卡車供應商
- 物流績效
- 按交通方式分享
- 船隊的裝載能力
- 定期渡輪服務的連結性
- 停靠港口和成就
- 貨運價格趨勢
- 貨物裝卸量趨勢
- 基礎設施
- 法律規範(公路和鐵路)
- 阿根廷
- 澳洲
- 巴西
- 加拿大
- 智利
- 中國
- 哥倫比亞
- 埃及
- 法國
- 德國
- 印度
- 印尼
- 義大利
- 日本
- 馬來西亞
- 墨西哥
- 荷蘭
- 奈及利亞
- 北歐國家
- 秘魯
- 波蘭
- 卡達
- 羅馬尼亞
- 俄羅斯
- 沙烏地阿拉伯
- 南非
- 西班牙
- 泰國
- 土耳其
- 阿拉伯聯合大公國
- 英國
- 美國
- 烏拉圭
- 越南
- 法律規範(海事和航空)
- 阿根廷
- 澳洲
- 巴西
- 加拿大
- 智利
- 中國
- 哥倫比亞
- 埃及
- 法國
- 德國
- 印度
- 印尼
- 義大利
- 日本
- 馬來西亞
- 墨西哥
- 荷蘭
- 奈及利亞
- 北歐國家
- 秘魯
- 波蘭
- 卡達
- 羅馬尼亞
- 俄羅斯
- 沙烏地阿拉伯
- 南非
- 西班牙
- 泰國
- 土耳其
- 阿拉伯聯合大公國
- 英國
- 美國
- 烏拉圭
- 越南
- 價值鍊和通路分析
- 市場促進因素
- 新興市場的電子商務滲透率
- 對當日配送的期望
- 基礎建設與公私合營物流走廊
- 製造業的回流和近岸外包
- 強制揭露範圍 3排放
- 國防部門儲備
- 市場限制因素
- 促進要素短缺和勞動力老化
- 港口擁擠和內陸瓶頸
- 對主要貿易路線的地緣政治制裁
- 網路安全保險費飆升
- 市場上的技術創新
- 波特五力分析
- 新進入者的威脅
- 買方的議價能力
- 供應商的議價能力
- 替代品的威脅
- 競爭公司之間的競爭
第5章 市場規模與成長預測
- 終端用戶產業
- 農業、漁業、林業
- 建造
- 製造業
- 石油和天然氣、採礦和採石
- 批發和零售
- 其他
- 物流職能
- 宅配、快遞、小包裹(CEP)
- 按目的地類型
- 國內的
- 國際的
- 按目的地類型
- 貨運代理
- 透過交通工具
- 航空
- 海路和內河航道
- 其他
- 透過交通工具
- 貨物運輸
- 透過交通工具
- 航空
- 管道
- 鐵路
- 路
- 海路和內河水道
- 透過交通工具
- 倉庫/存儲
- 透過溫度控制
- 無溫度控制
- 溫度控制
- 透過溫度控制
- 其他服務
- 宅配、快遞、小包裹(CEP)
- 地區
- 亞太地區
- 國家
- 澳洲
- 中國
- 印度
- 印尼
- 日本
- 馬來西亞
- 泰國
- 越南
- 亞太其他地區
- 國家
- 歐洲
- 國家
- 丹麥
- 芬蘭
- 法國
- 德國
- 冰島
- 義大利
- 荷蘭
- 挪威
- 波蘭
- 羅馬尼亞
- 俄羅斯
- 西班牙
- 瑞典
- 土耳其
- 英國
- 其他歐洲地區
- 國家
- 中東和非洲
- 國家
- 埃及
- 奈及利亞
- 卡達
- 沙烏地阿拉伯
- 南非
- 阿拉伯聯合大公國
- 其他中東和非洲地區
- 國家
- 北美洲
- 國家
- 加拿大
- 墨西哥
- 美國
- 北美其他地區
- 國家
- 南美洲
- 國家
- 阿根廷
- 巴西
- 智利
- 哥倫比亞
- 秘魯
- 烏拉圭
- 南美洲其他地區
- 國家
- 世界其他地區
- 亞太地區
第6章 競爭情勢
- 市場集中度
- 重大策略舉措
- 市佔率分析
- 公司簡介
- AP Moller-Maersk
- Allcargo Logistics
- Americold
- Aramex
- CH Robinson
- CJ Logistics Corporation
- CMA CGM Group(Including CEVA Logistics)
- CTS Logistics Group
- Culina Group
- DACHSER
- DHL Group
- DP World
- DSV A/S(Including DB Schenker)
- Expeditors International of Washington, Inc.
- FedEx
- GEODIS
- GXO Logistics
- Hellmann Worldwide Logistics
- Hub Group
- International Distributions Services
- JB Hunt Transport Services, Inc.
- Japan Post Holdings Co., Ltd.
- JD.com, Inc.(Including JD Logistics, Inc.)
- Kintetsu Group Holdings Co., Ltd.(Including Kintetsu World Express, Inc.)
- Kuehne+Nagel
- La Poste Group(Including DPD Group)
- Landstar System Inc.
- LOGWIN
- LX International Corp.(Including LX Pantos Co., Ltd.)
- Mainfreight
- NFI Industries
- NYK(Nippon Yusen Kaisha)Line
- Orient Overseas Container Line(OOCL Logistics)
- Penske Corporation(Including Penske Logistics)
- Poste Italiane
- Rhenus Logistics
- Ryder System, Inc.
- Savino Del Bene SpA
- SF Express(KEX-SF)
- Sinotrans, Ltd.
- The MSC Group(Mediterranean Shipping Company)
- Total Quality Logistics, LLC
- Uber Technologies Inc.
- United Parcel Service of America, Inc.(UPS)
- XPO, Inc.
- Yamato Holdings Co., Ltd.
第7章 市場機會與未來展望
The Freight And Logistics Market size is expected to grow from USD 6.37 trillion in 2025 to USD 6.68 trillion in 2026 and is forecast to reach USD 8.49 trillion by 2031 at 4.91% CAGR over 2026-2031.
Robust e-commerce activity, infrastructure modernization, rising demand for cross-border courier, express, and parcel (CEP) services, and accelerating public-private partnerships keep the freight and logistics market on a steady growth path. Freight transport remains the backbone of global trade, yet segment diversification toward forwarding, warehousing, and last-mile fulfillment is increasing as shippers seek integrated solutions. Strong regional momentum in Asia-Pacific, regulatory pushes for Scope-3 emissions reporting, and technology investments in automation, visibility, and predictive optimization continue to reshape competitive strategies and cost structures. Consolidation, exemplified by DSV's purchase of DB Schenker, underscores the sector's focus on scale, network density, and technology leverage to offset capacity bottlenecks and driver shortages.
Global Freight And Logistics Market Trends and Insights
E-Commerce Penetration in Emerging Markets
Rising smartphone use and digital payment adoption in Asia-Pacific and Latin America amplify demand for rapid order fulfillment, forcing logistics providers to build micro-fulfillment facilities near high-density urban clusters. This structural shift boosts international CEP volumes, which command premium margins and require robust customs-clearing capabilities, harmonized product classification, and data-driven shipment visibility. Providers invest in automated sortation, artificial-intelligence-guided route planning, and omnichannel inventory orchestration to meet elevated consumer delivery promises. Regionally fragmented regulatory frameworks add complexity, prompting collaborative initiatives among customs authorities to streamline cross-border e-commerce compliance. As these efforts mature, cross-border parcel flows further integrate small and medium-sized sellers into global trade networks, expanding the overall freight and logistics market.
On-Demand Same-Day Delivery Expectations
In mature consumer markets, more than one-third of shoppers now prefer same-day delivery on key purchases, prompting retailers to reset fulfillment blueprints. Brick-and-mortar stores increasingly double as hyperlocal distribution nodes, shrinking last-mile distances and reducing per-parcel costs. Automated storage and retrieval systems, collaborative robots, and predictive labor scheduling enhance throughput in urban micro-warehouses. Last-mile specialists leverage crowdsourced couriers, dynamic routing software, and application programming interface (API) integrations that feed real-time order data into fleet management tools, ensuring delivery windows under two hours. High service expectations intensify margin pressure for traditional parcel operators yet create expansion avenues for tech-enabled entrants targeting dense cities across North America, Europe, and advanced Asia-Pacific markets.
Driver Shortage and Ageing Workforce
The median professional truck driver age in the United States and Western Europe exceeds 50 years, while pipeline talent lags due to lifestyle concerns and training backlogs. Rising wage bills elevate contract rates, inflate last-mile delivery costs, and limit surge capacity during peak seasons. To mitigate, carriers adopt telematics for optimized dispatching, deploy driver-assist technologies that cut fatigue, and pilot autonomous vehicle platoons on controlled corridors. Warehousing faces similar labor headwinds, encouraging investments in goods-to-person robotics and automated palletizing. Persistent personnel scarcity remains the single most pronounced brake on potential output gains within the freight and logistics market.
Other drivers and restraints analyzed in the detailed report include:
- Infrastructure Upgrades and PPP Logistics Corridors
- Reshoring and Near-Shoring of Manufacturing
- Port Congestion and Inland Bottlenecks
For complete list of drivers and restraints, kindly check the Table Of Contents.
Segment Analysis
Wholesale and retail trade accounted for 33.10% of the freight and logistics market size in 2025, driven by constant replenishment cycles, omnichannel fulfillment, and promotional seasonality. Inventory decentralization strategies require agile middle-mile transfers among regional distribution centers and store replenishment hubs. E-commerce surges magnify parcel density, challenging legacy hub-and-spoke topologies and stimulating investments in sortation automation and carrier diversification.
Manufacturing expands at the fastest 5.17% CAGR (2026-2031) as regionalization bolsters intra-continental raw material and component flows. Original equipment manufacturers mandate just-in-time sequencing, precise line-side deliveries, and real-time visibility to synchronize production across multi-plant footprints. Heavy-lift, project cargo, and temperature-controlled segments benefit from high-value machinery, electronics, and pharmaceutical demand, widening total addressable revenue within the freight and logistics market. Specialized logistics models, including vendor-managed inventory and supplier parks, gain traction, driving deeper integration between manufacturers and third-party logistics providers.
Freight transport generated 61.45% of the freight and logistics market size in 2025, underpinned by vast road, rail, sea, and air networks that physically move global commerce. Its mature footprint yields moderate expansion, projected at 4.19% CAGR between 2026-2031, as macro trade growth offsets efficiency gains. Forwarding, representing a 5.18% CAGR (2026-2031), leverages digital booking platforms, shipment visibility dashboards, and customs-brokerage expertise to orchestrate multimodal routing. Small and medium-sized exporters increasingly outsource compliance and carrier selection to forwarders, driving wallet-share capture within the freight and logistics market.
Providers integrate tariff classification engines, synchronized document workflows, and predictive arrival algorithms to shrink clearance times at borders. As global supply chains fragment across multiple origins, end-to-end orchestration and exception management become core differentiators, enabling forwarders to win contracts from shippers prioritizing agility over pure cost. Consequently, forwarding's share of the freight and logistics market steadily climbs, even as asset-heavy transport operations continue to dominate absolute revenue pools.
The Freight and Logistics Market Report is Segmented by End User Industry (Agriculture, Fishing, and Forestry, Construction, Wholesale and Retail Trade, and More), by Logistics Function (Courier, Express, and Parcel, Freight Forwarding, Freight Transport, Warehousing and Storage, and Other Services), and Geography (North America, Asia-Pacific, South America, and More). The Market Forecasts are Provided in Terms of Value (USD).
Geography Analysis
Asia-Pacific produced 41.20% of the freight and logistics market size in 2025 and posts the leading 6.15% CAGR between 2026-2031 as trade corridors diversify beyond China to Southeast Asia, India, and Oceania. Massive port expansions at Shanghai, Singapore, and Colombo, high-speed rail cargo lines on the China-Laos route, and digital single-window customs programs shrink transit times and lower compliance costs. Manufacturing shifts toward Vietnam, Indonesia, and the Philippines increase intra-Asian trucking, feeder vessel demand, and cross-border rail traffic.
Europe maintains a strong multimodal proposition, leveraging high-capacity rail freight corridors, short-sea shipping networks, and synchronized customs regimes inside the Schengen area. Sustainability leadership translates into early deployment of hydrogen trucks, electrified last-mile fleets, and modal shift incentives that reshape lane economics. Although geopolitical frictions with Russia complicate eastern overland routes, investments in Baltic and Mediterranean gateway ports foster alternative supply paths, preserving competitiveness within the freight and logistics market.
North America benefits from near-shoring to Mexico and Canada, driving cross-border tractor-trailer volumes and bilateral customs harmonization. The United States' Infrastructure Investment and Jobs Act accelerates highway rehabilitation, inland port development, and port dredging. Class I railroads expand intermodal terminals to capture e-commerce surge, while Gulf Coast port upgrades attract Asian blue-water services via the expanded Panama Canal. Collectively, these initiatives sustain mid-single-digit growth for the region's freight and logistics market.
- A.P. Moller-Maersk
- Allcargo Logistics
- Americold
- Aramex
- C.H. Robinson
- CJ Logistics Corporation
- CMA CGM Group (Including CEVA Logistics)
- CTS Logistics Group
- Culina Group
- DACHSER
- DHL Group
- DP World
- DSV A/S (Including DB Schenker)
- Expeditors International of Washington, Inc.
- FedEx
- GEODIS
- GXO Logistics
- Hellmann Worldwide Logistics
- Hub Group
- International Distributions Services
- J.B. Hunt Transport Services, Inc.
- Japan Post Holdings Co., Ltd.
- JD.com, Inc. (Including JD Logistics, Inc.)
- Kintetsu Group Holdings Co., Ltd. (Including Kintetsu World Express, Inc.)
- Kuehne+Nagel
- La Poste Group (Including DPD Group)
- Landstar System Inc.
- LOGWIN
- LX International Corp. (Including LX Pantos Co., Ltd.)
- Mainfreight
- NFI Industries
- NYK (Nippon Yusen Kaisha) Line
- Orient Overseas Container Line (OOCL Logistics)
- Penske Corporation (Including Penske Logistics)
- Poste Italiane
- Rhenus Logistics
- Ryder System, Inc.
- Savino Del Bene SpA
- SF Express (KEX-SF)
- Sinotrans, Ltd.
- The MSC Group (Mediterranean Shipping Company)
- Total Quality Logistics, LLC
- Uber Technologies Inc.
- United Parcel Service of America, Inc. (UPS)
- XPO, Inc.
- Yamato Holdings Co., Ltd.
Additional Benefits:
- The market estimate (ME) sheet in Excel format
- 3 months of analyst support
TABLE OF CONTENTS
1 Introduction
- 1.1 Study Assumptions and Market Definition
- 1.2 Scope of the Study
2 Research Methodology
3 Executive Summary
4 Market Landscape
- 4.1 Market Overview
- 4.2 Demographics
- 4.3 GDP Distribution by Economic Activity
- 4.4 GDP Growth by Economic Activity
- 4.5 Inflation
- 4.6 Economic Performance and Profile
- 4.6.1 Trends in E-Commerce Industry
- 4.6.2 Trends in Manufacturing Industry
- 4.7 Transport and Storage Sector GDP
- 4.8 Export Trends
- 4.9 Import Trends
- 4.10 Fuel Price
- 4.11 Trucking Operational Costs
- 4.12 Trucking Fleet Size by Type
- 4.13 Major Truck Suppliers
- 4.14 Logistics Performance
- 4.15 Modal Share
- 4.16 Maritime Fleet Load Carrying Capacity
- 4.17 Liner Shipping Connectivity
- 4.18 Port Calls and Performance
- 4.19 Freight Pricing Trends
- 4.20 Freight Tonnage Trends
- 4.21 Infrastructure
- 4.22 Regulatory Framework (Road and Rail)
- 4.22.1 Argentina
- 4.22.2 Australia
- 4.22.3 Brazil
- 4.22.4 Canada
- 4.22.5 Chile
- 4.22.6 China
- 4.22.7 Colombia
- 4.22.8 Egypt
- 4.22.9 France
- 4.22.10 Germany
- 4.22.11 India
- 4.22.12 Indonesia
- 4.22.13 Italy
- 4.22.14 Japan
- 4.22.15 Malaysia
- 4.22.16 Mexico
- 4.22.17 Netherlands
- 4.22.18 Nigeria
- 4.22.19 Nordics
- 4.22.20 Peru
- 4.22.21 Poland
- 4.22.22 Qatar
- 4.22.23 Romania
- 4.22.24 Russia
- 4.22.25 Saudi Arabia
- 4.22.26 South Africa
- 4.22.27 Spain
- 4.22.28 Thailand
- 4.22.29 Turkey
- 4.22.30 UAE
- 4.22.31 United Kingdom
- 4.22.32 United States
- 4.22.33 Uruguay
- 4.22.34 Vietnam
- 4.23 Regulatory Framework (Sea and Air)
- 4.23.1 Argentina
- 4.23.2 Australia
- 4.23.3 Brazil
- 4.23.4 Canada
- 4.23.5 Chile
- 4.23.6 China
- 4.23.7 Colombia
- 4.23.8 Egypt
- 4.23.9 France
- 4.23.10 Germany
- 4.23.11 India
- 4.23.12 Indonesia
- 4.23.13 Italy
- 4.23.14 Japan
- 4.23.15 Malaysia
- 4.23.16 Mexico
- 4.23.17 Netherlands
- 4.23.18 Nigeria
- 4.23.19 Nordics
- 4.23.20 Peru
- 4.23.21 Poland
- 4.23.22 Qatar
- 4.23.23 Romania
- 4.23.24 Russia
- 4.23.25 Saudi Arabia
- 4.23.26 South Africa
- 4.23.27 Spain
- 4.23.28 Thailand
- 4.23.29 Turkey
- 4.23.30 UAE
- 4.23.31 United Kingdom
- 4.23.32 United States
- 4.23.33 Uruguay
- 4.23.34 Vietnam
- 4.24 Value Chain and Distribution Channel Analysis
- 4.25 Market Drivers
- 4.25.1 E-Commerce Penetration in Emerging Markets
- 4.25.2 On-Demand Same-Day Delivery Expectations
- 4.25.3 Infrastructure Upgrades and PPP Logistics Corridors
- 4.25.4 Reshoring and Near-Shoring of Manufacturing
- 4.25.5 Mandatory Scope-3 Emissions Disclosure
- 4.25.6 Defense-Sector Stockpiling
- 4.26 Market Restraints
- 4.26.1 Driver Shortage and Ageing Workforce
- 4.26.2 Port Congestion and Inland Bottlenecks
- 4.26.3 Geopolitical Sanctions on Key Trade Lanes
- 4.26.4 High Cybersecurity Insurance Premiums
- 4.27 Technology Innovations in the Market
- 4.28 Porter's Five Forces Analysis
- 4.28.1 Threat of New Entrants
- 4.28.2 Bargaining Power of Buyers
- 4.28.3 Bargaining Power of Suppliers
- 4.28.4 Threat of Substitutes
- 4.28.5 Competitive Rivalry
5 Market Size and Growth Forecasts (Value, USD)
- 5.1 End User Industry
- 5.1.1 Agriculture, Fishing, and Forestry
- 5.1.2 Construction
- 5.1.3 Manufacturing
- 5.1.4 Oil and Gas, Mining and Quarrying
- 5.1.5 Wholesale and Retail Trade
- 5.1.6 Others
- 5.2 Logistics Function
- 5.2.1 Courier, Express, and Parcel (CEP)
- 5.2.1.1 By Destination Type
- 5.2.1.1.1 Domestic
- 5.2.1.1.2 International
- 5.2.1.1 By Destination Type
- 5.2.2 Freight Forwarding
- 5.2.2.1 By Mode of Transport
- 5.2.2.1.1 Air
- 5.2.2.1.2 Sea and Inland Waterways
- 5.2.2.1.3 Others
- 5.2.2.1 By Mode of Transport
- 5.2.3 Freight Transport
- 5.2.3.1 By Mode of Transport
- 5.2.3.1.1 Air
- 5.2.3.1.2 Pipelines
- 5.2.3.1.3 Rail
- 5.2.3.1.4 Road
- 5.2.3.1.5 Sea and Inland Waterways
- 5.2.3.1 By Mode of Transport
- 5.2.4 Warehousing and Storage
- 5.2.4.1 By Temperature Control
- 5.2.4.1.1 Non-Temperature Controlled
- 5.2.4.1.2 Temperature Controlled
- 5.2.4.1 By Temperature Control
- 5.2.5 Other Services
- 5.2.1 Courier, Express, and Parcel (CEP)
- 5.3 Region
- 5.3.1 Asia-Pacific
- 5.3.1.1 By Country
- 5.3.1.1.1 Australia
- 5.3.1.1.2 China
- 5.3.1.1.3 India
- 5.3.1.1.4 Indonesia
- 5.3.1.1.5 Japan
- 5.3.1.1.6 Malaysia
- 5.3.1.1.7 Thailand
- 5.3.1.1.8 Vietnam
- 5.3.1.1.9 Rest of Asia-Pacific
- 5.3.1.1 By Country
- 5.3.2 Europe
- 5.3.2.1 By Country
- 5.3.2.1.1 Denmark
- 5.3.2.1.2 Finland
- 5.3.2.1.3 France
- 5.3.2.1.4 Germany
- 5.3.2.1.5 Iceland
- 5.3.2.1.6 Italy
- 5.3.2.1.7 Netherlands
- 5.3.2.1.8 Norway
- 5.3.2.1.9 Poland
- 5.3.2.1.10 Romania
- 5.3.2.1.11 Russia
- 5.3.2.1.12 Spain
- 5.3.2.1.13 Sweden
- 5.3.2.1.14 Turkey
- 5.3.2.1.15 United Kingdom
- 5.3.2.1.16 Rest of Europe
- 5.3.2.1 By Country
- 5.3.3 Middle East and Africa
- 5.3.3.1 By Country
- 5.3.3.1.1 Egypt
- 5.3.3.1.2 Nigeria
- 5.3.3.1.3 Qatar
- 5.3.3.1.4 Saudi Arabia
- 5.3.3.1.5 South Africa
- 5.3.3.1.6 United Arab Emirates
- 5.3.3.1.7 Rest of Middle East and Africa
- 5.3.3.1 By Country
- 5.3.4 North America
- 5.3.4.1 By Country
- 5.3.4.1.1 Canada
- 5.3.4.1.2 Mexico
- 5.3.4.1.3 United States
- 5.3.4.1.4 Rest of North America
- 5.3.4.1 By Country
- 5.3.5 South America
- 5.3.5.1 By Country
- 5.3.5.1.1 Argentina
- 5.3.5.1.2 Brazil
- 5.3.5.1.3 Chile
- 5.3.5.1.4 Colombia
- 5.3.5.1.5 Peru
- 5.3.5.1.6 Uruguay
- 5.3.5.1.7 Rest of South America
- 5.3.5.1 By Country
- 5.3.6 Rest of the World
- 5.3.1 Asia-Pacific
6 Competitive Landscape
- 6.1 Market Concentration
- 6.2 Key Strategic Moves
- 6.3 Market Share Analysis
- 6.4 Company Profiles (Includes Global Level Overview, Market Level Overview, Core Segments, Financials as Available, Strategic Information, Market Rank/Share for Key Companies, Products and Services, and Recent Developments)
- 6.4.1 A.P. Moller-Maersk
- 6.4.2 Allcargo Logistics
- 6.4.3 Americold
- 6.4.4 Aramex
- 6.4.5 C.H. Robinson
- 6.4.6 CJ Logistics Corporation
- 6.4.7 CMA CGM Group (Including CEVA Logistics)
- 6.4.8 CTS Logistics Group
- 6.4.9 Culina Group
- 6.4.10 DACHSER
- 6.4.11 DHL Group
- 6.4.12 DP World
- 6.4.13 DSV A/S (Including DB Schenker)
- 6.4.14 Expeditors International of Washington, Inc.
- 6.4.15 FedEx
- 6.4.16 GEODIS
- 6.4.17 GXO Logistics
- 6.4.18 Hellmann Worldwide Logistics
- 6.4.19 Hub Group
- 6.4.20 International Distributions Services
- 6.4.21 J.B. Hunt Transport Services, Inc.
- 6.4.22 Japan Post Holdings Co., Ltd.
- 6.4.23 JD.com, Inc. (Including JD Logistics, Inc.)
- 6.4.24 Kintetsu Group Holdings Co., Ltd. (Including Kintetsu World Express, Inc.)
- 6.4.25 Kuehne+Nagel
- 6.4.26 La Poste Group (Including DPD Group)
- 6.4.27 Landstar System Inc.
- 6.4.28 LOGWIN
- 6.4.29 LX International Corp. (Including LX Pantos Co., Ltd.)
- 6.4.30 Mainfreight
- 6.4.31 NFI Industries
- 6.4.32 NYK (Nippon Yusen Kaisha) Line
- 6.4.33 Orient Overseas Container Line (OOCL Logistics)
- 6.4.34 Penske Corporation (Including Penske Logistics)
- 6.4.35 Poste Italiane
- 6.4.36 Rhenus Logistics
- 6.4.37 Ryder System, Inc.
- 6.4.38 Savino Del Bene SpA
- 6.4.39 SF Express (KEX-SF)
- 6.4.40 Sinotrans, Ltd.
- 6.4.41 The MSC Group (Mediterranean Shipping Company)
- 6.4.42 Total Quality Logistics, LLC
- 6.4.43 Uber Technologies Inc.
- 6.4.44 United Parcel Service of America, Inc. (UPS)
- 6.4.45 XPO, Inc.
- 6.4.46 Yamato Holdings Co., Ltd.
7 Market Opportunities and Future Outlook
- 7.1 White-space and Unmet-Need Assessment
 全球貨運和物流市場:市場規模、佔有率、趨勢和成長分析(2026-2034 年)
 2026年全球貨車市場報告2026年全球貨運和物流市場報告2026年全球零碳運輸市場報告
 貨運及物流市場分析及預測(至2035年):依類型、產品類型、服務、技術、組件、應用、流程、最終使用者及運輸方式分類
 2026-2030年全球貨物審核與支付市場
 中東歐貨運與物流:市場佔有率分析、產業趨勢與統計、成長預測(2026-2031 年)亞太地區貨運與物流:市場佔有率分析、產業趨勢與統計、成長預測(2026-2031)南美貨運與物流:市場佔有率分析、產業趨勢與統計、成長預測(2026-2031)東協貨運與物流:市場佔有率分析、產業趨勢與統計、成長預測(2026-2031)