


 |
市場調查報告書
商品編碼
1911813
東非潤滑油市場:市場佔有率分析、產業趨勢與統計、成長預測(2026-2031年)East Africa Lubricants - Market Share Analysis, Industry Trends & Statistics, Growth Forecasts (2026 - 2031) |
||||||
※ 本網頁內容可能與最新版本有所差異。詳細情況請與我們聯繫。
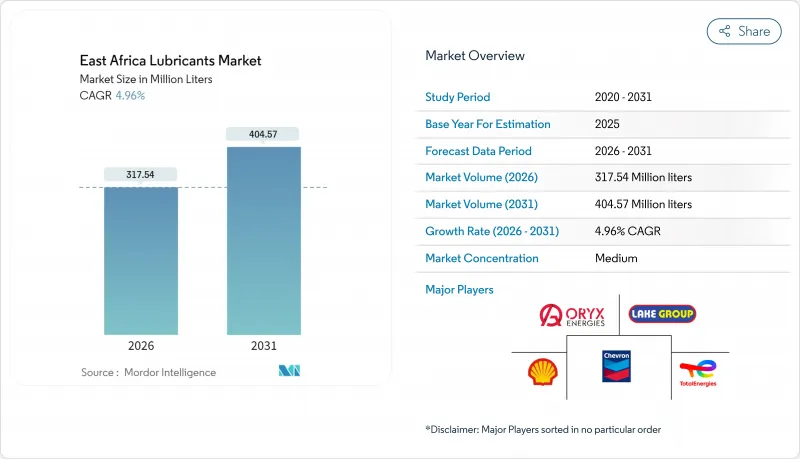
預計東非潤滑油市場將從 2025 年的 3.0253 億公升成長到 2026 年的 3.1754 億公升,到 2031 年將達到 4.0457 億公升,2026 年至 2031 年的複合年成長率為 4.96%。
目前東非潤滑油市場的成長主要得益於基礎設施的快速發展、強勁的汽車需求以及非洲大陸自由貿易區的區域一體化,這些因素共同推動東非潤滑油市場轉型為重要的消費中心。跨境貿易協調消除了曾經限制分銷的關稅壁壘,而對符合原廠配套(OEM)高等級合成油的需求不斷成長,也使得每公升潤滑油的售價穩步提升。從肯亞的標準軌鐵路到坦尚尼亞的天然氣製油廠,一系列大型計劃的持續推進正在帶動重型機械對東非潤滑油市場的需求。同時,當地的潤滑油調配企業正在提高產能、降低運輸成本、縮短前置作業時間並加強品管,從而在全球供應風險的背景下增強了該地區的自給自足能力。
東非潤滑油市場趨勢與洞察
工業和基礎設施的快速成長
肯亞和烏干達超過500億美元的大型企劃支出,加上坦尚尼亞天然氣設施的200億美元累計,將轉化為全年對特種液壓油、齒輪油和重型引擎潤滑油的需求。卡魯瑪水力發電廠的建設和標準軌距鐵路的擴建進一步推動了製造場所對金屬加工液的需求。政府間發展組織(伊加特)將交通走廊改造為經濟走廊的總體規劃將確保施工機械的運作,從而直接提振東非潤滑油市場的需求。高速公路的建設將降低服務偏遠地區的經銷商的運輸成本,並擴大「最後一公里」的覆蓋範圍。計劃也正在加速水泥、骨材和鋼鐵等相關產業的發展,增加了潤滑油在整個供應鏈中的應用環節。
二手車數量迅速成長
隨著消費者尋求經濟實惠的交通方式,二手車進口量激增,換油頻率也隨之提高,導致每輛車的潤滑油消費量增加。烏干達的車輛登記數據顯示,跨境運輸農產品的卡車老化現像日益普遍,反映了該地區的趨勢。肯亞運作的組裝增加了工廠內部的工業潤滑油需求,同時也帶動了工廠外的售後市場銷售。摩托車如今已成為農村物流的必需品,推動了小型包裝和二行程引擎潤滑油的普及。注重成本控制的車隊管理人員意識到,優質合成潤滑油可以降低總擁有成本,從而推動了東非潤滑油市場的升級需求。此外,數位化叫車平台進一步規範了車輛保養計劃,使需求更加穩定。
基礎油價格波動
原油價格波動擠壓了缺乏避險工具的調油商的利潤空間,並導致零售價格頻繁調整。由於只有蘇丹的阿爾賈伊利煉油廠部分運作,進口瓶頸日益加劇,迫使東非依賴更遠的供應商。通貨膨脹傳導推高了終端用戶的營運成本,導致一些業者延長換油週期,減緩了銷售量成長。信用狀成本上升使小規模經銷商面臨斷貨風險,促使市場佔有率轉移到資金更雄厚的跨國公司。價格波動也推遲了新建調油廠的投資決策,延長了供應的不確定性。
細分市場分析
預計到2025年,機油仍將佔東非潤滑油市場45.62%的佔有率,主要得益於乘用車和商用車龐大的保有量。變速箱油和齒輪油預計將以5.12%的複合年成長率成長,超過其他品類,這反映了鉸接式卡車和施工機械的成長,這些設備需要專用的傳動系統油液。儘管銷量不斷成長,但合成油的快速普及推高了單價,為主要供應商的盈利奠定了基礎。
受持續的土木工程活動推動,建築工地液壓油用量不斷增加。同時,由於鐵路、港口和能源計劃對鋼材的切割和成型需求增加,肯亞和坦尚尼亞工業園區的金屬加工液需求也在上升。潤滑脂對於礦用輸送機軸承和船舶甲板設備仍然至關重要,儘管用量有所減少。當地潤滑油生產商正在使用防偽QR碼來保護其品牌,此舉受到監管機構的歡迎,他們希望藉此加強東非潤滑油產業。殼牌的產品系列優勢表明,跨國公司如何利用豐富的產品種類和成熟的分銷網路來增強其競爭優勢。
東非潤滑油報告按產品類型(引擎油、變速箱油和齒輪油、液壓油、潤滑脂等)、終端用戶產業(汽車、重型機械、冶金和金屬加工、發電等)以及地區(肯亞、坦尚尼亞、烏干達、衣索比亞、盧安達、蒲隆地、剛果民主共和國)進行細分。市場預測以百萬公升為單位。
其他福利:
- Excel格式的市場預測(ME)表
- 3個月的分析師支持
目錄
第1章 引言
- 研究假設和市場定義
- 調查範圍
第2章調查方法
第3章執行摘要
第4章 市場情勢
- 市場概覽
- 市場促進因素
- 工業和基礎設施快速發展
- 二手車保有量快速成長
- 汽車製造商推廣優質合成機油
- 跨境貿易自由化(非洲大陸自由貿易區)
- 擴大本地配製能力
- 市場限制
- 基油價格波動
- 仿冒品品
- 外匯短缺
- 價值鏈分析
- 波特五力模型
- 供應商的議價能力
- 買方的議價能力
- 新進入者的威脅
- 替代品的威脅
- 競爭程度
第5章 市場規模與成長預測
- 依產品類型
- 機油
- 變速箱油和齒輪油
- 油壓
- 潤滑脂
- 金屬加工油
- 其他產品類型(例如,壓縮機油、加工油)
- 按最終用戶行業分類
- 車
- 搭乘用車
- 商用車輛
- 摩托車
- 重型機械
- 冶金/金屬加工
- 發電
- 船
- 其他終端用戶產業(石油和天然氣、農業、水泥等)
- 車
- 按地區
- 肯亞
- 坦尚尼亞
- 烏干達
- 衣索比亞
- 盧安達
- 蒲隆地
- 剛果民主共和國
第6章 競爭情勢
- 市場集中度
- 策略趨勢
- 市佔率(%)/排名分析
- 公司簡介
- BP plc
- Chevron Corporation
- Engen Petroleum Ltd.
- ENOC
- ExxonMobil
- General Petroleum FZE
- Hass Petroleum
- Lake Group
- LIQUI MOLY GmbH
- MOCL(Mineral Oil Corporation Ltd.)
- Motul SA
- National Oil Corporation of Kenya, Energizing Kenya
- Oryx Energies
- Rubis Energie
- Shell plc
- SINOPEC
- TotalEnergies
- Vivo Energy Holding BV
- Yana Oil(Bureau Veritas)
第7章 市場機會與未來展望
The East Africa Lubricants Market is expected to grow from 302.53 million liters in 2025 to 317.54 million liters in 2026 and is forecast to reach 404.57 million liters by 2031 at 4.96% CAGR over 2026-2031.
Current expansion is propelled by an infrastructure boom, resilient automotive demand, and the region's integration into the African Continental Free Trade Area, collectively transforming the East Africa lubricants market into a pivotal consumption hub. Cross-border trade harmonization removes tariff barriers that once constrained circulation, while OEM specifications for higher-grade synthetics steadily lift the value of every liter sold. A steady pipeline of megaprojects, from the Standard Gauge Railway in Kenya to gas liquefaction plants in Tanzania, funnels heavy-duty equipment requirements back into the East Africa lubricants market. At the same time, local blenders add capacity to cut freight costs, shorten lead times, and elevate quality oversight, reinforcing regional self-sufficiency amidst global supply risk.
East Africa Lubricants Market Trends and Insights
Industrial and Infrastructure Boom
Megaproject spending above USD 50 billion in Kenya and Uganda, plus USD 20 billion earmarked for Tanzanian gas facilities, translates into year-round consumption of specialized hydraulic fluids, gear oils, and heavy-duty engine lubricants. Hydropower builds such as Karuma and the widening of the Standard Gauge Railway intensify demand for metalworking fluids across fabrication shops. The IGAD master plan to convert transport corridors into economic corridors ensures that construction equipment fleets remain active, feeding direct volume growth into the East Africa lubricants market. Improved highways lower freight costs for distributors servicing remote sites, broadening last-mile reach. Each project also accelerates auxiliary industries such as cement, aggregates, and steel, multiplying lubricant touchpoints across the supply chain.
Rapid Growth of Used-Vehicle Fleet
Second-hand imports surge as consumers seek affordable mobility, forcing more frequent oil changes that lift per-vehicle lubricant consumption. Uganda's registration data mirrors a regional trend where aging trucks shuttle agricultural output across borders. Kenya's re-emerging assembly lines add industrial lubricant demand inside production plants while sustaining aftermarket sales outside factory gates. Motorcycles, now indispensable in rural logistics, popularize smaller pack sizes and two-stroke formulations. Cost-sensitive fleet managers realize that premium synthetics can lower total cost of ownership, nudging up-trading within the East Africa lubricants market. Digital ride-hailing platforms further formalize maintenance schedules, institutionalizing steady demand.
Base-Oil Price Volatility
Crude swings compress margins for blenders lacking hedging tools, stoking frequent price revisions at retail. Import bottlenecks intensify because only Sudan's Al-Jaili refinery runs partial capacity, leaving East Africa reliant on distant suppliers. Inflationary pass-through raises end-user operating costs, tempting some operators to stretch drain intervals, thereby weakening volume growth. Smaller distributors risk stockouts when letters of credit become costlier, nudging market share toward cash-rich multinationals. Volatility also delays capital decisions on new blending plants, prolonging supply insecurity.
Other drivers and restraints analyzed in the detailed report include:
- OEM Push Toward Higher-Grade Synthetics
- Cross-Border Trade Liberalization (AfCFTA)
- Foreign-Exchange Shortages
For complete list of drivers and restraints, kindly check the Table Of Contents.
Segment Analysis
Engine oils continued to account for 45.62% of the East Africa lubricants market in 2025, supported by a vast installed base of passenger and commercial vehicles. Transmission and gear oils are set to outpace all other categories at a 5.12% CAGR, mirroring growth in articulated trucks and construction machinery that demand specialty drivetrain fluids. The segment's rapid shift toward synthetics signals higher per-unit value even as volumes climb, anchoring profitability for major suppliers.
Across construction sites, hydraulic fluid usage rides on the back of sustained earth-moving activity, while metalworking fluids register upticks as Kenya's and Tanzania's industrial parks cut and shape steel for rail, port, and energy projects. Greases remain indispensable in mining conveyor bearings and marine deck gear despite their smaller absolute tonnage. Local blenders integrate anti-counterfeit QR codes to safeguard brand equity, a move welcomed by regulators aiming to sanitize the East Africa lubricants industry. Shell's portfolio dominance demonstrates how multinationals capitalize on broad SKU coverage and entrenched channel presence to reinforce competitive moats.
The East Africa Lubricants Report is Segmented by Product Type (Engine Oils, Transmission and Gear Oils, Hydraulic Fluids, Greases, and More), End-User Industry (Automotive, Heavy Equipment, Metallurgy and Metalworking, Power Generation, and More), and Geography (Kenya, Tanzania, Uganda, Ethiopia, Rwanda, Burundi, and Democratic Republic of Congo). The Market Forecasts are Provided in Terms of Volume (Million Liters).
List of Companies Covered in this Report:
- BP plc
- Chevron Corporation
- Engen Petroleum Ltd.
- ENOC
- ExxonMobil
- General Petroleum FZE
- Hass Petroleum
- Lake Group
- LIQUI MOLY GmbH
- MOCL (Mineral Oil Corporation Ltd.)
- Motul S.A.
- National Oil Corporation of Kenya, Energizing Kenya
- Oryx Energies
- Rubis Energie
- Shell plc
- SINOPEC
- TotalEnergies
- Vivo Energy Holding B.V.
- Yana Oil (Bureau Veritas)
Additional Benefits:
- The market estimate (ME) sheet in Excel format
- 3 months of analyst support
TABLE OF CONTENTS
1 Introduction
- 1.1 Study Assumptions and Market Definition
- 1.2 Scope of the Study
2 Research Methodology
3 Executive Summary
4 Market Landscape
- 4.1 Market Overview
- 4.2 Market Drivers
- 4.2.1 Industrial and Infrastructure Boom
- 4.2.2 Rapid Growth of Used-Vehicle Fleet
- 4.2.3 OEM Push toward Higher-Grade Synthetics
- 4.2.4 Cross-Border Trade Liberalization (AfCFTA)
- 4.2.5 Local Blending Capacity Expansion
- 4.3 Market Restraints
- 4.3.1 Base-Oil Price Volatility
- 4.3.2 Counterfeit and Sub-Standard Products
- 4.3.3 Foreign-Exchange Shortages
- 4.4 Value Chain Analysis
- 4.5 Porter's Five Forces
- 4.5.1 Bargaining Power of Suppliers
- 4.5.2 Bargaining Power of Buyers
- 4.5.3 Threat of New Entrants
- 4.5.4 Threat of Substitutes
- 4.5.5 Degree of Competition
5 Market Size and Growth Forecasts (Volume)
- 5.1 By Product Type
- 5.1.1 Engine Oils
- 5.1.2 Transmission and Gear Oils
- 5.1.3 Hydraulic Fluids
- 5.1.4 Greases
- 5.1.5 Metalworking Fluids
- 5.1.6 Other Product Types (Compressor Oils, Process Oils, etc.)
- 5.2 By End User Industry
- 5.2.1 Automotive
- 5.2.1.1 Passenger Vehicles
- 5.2.1.2 Commercial Vehicles
- 5.2.1.3 Motorcycles
- 5.2.2 Heavy Equipment
- 5.2.3 Metallurgy and Metalworking
- 5.2.4 Power Generation
- 5.2.5 Marine
- 5.2.6 Other End-user Industries (Oil and Gas, Agri, Cement, etc.)
- 5.2.1 Automotive
- 5.3 By Geography
- 5.3.1 Kenya
- 5.3.2 Tanzania
- 5.3.3 Uganda
- 5.3.4 Ethiopia
- 5.3.5 Rwanda
- 5.3.6 Burundi
- 5.3.7 Democratic Republic of Congo
6 Competitive Landscape
- 6.1 Market Concentration
- 6.2 Strategic Moves
- 6.3 Market Share (%)/Ranking Analysis
- 6.4 Company Profiles (includes Global level Overview, Market level overview, Core Segments, Financials as available, Strategic Information, Market Rank/Share for key companies, Products and Services, and Recent Developments)
- 6.4.1 BP plc
- 6.4.2 Chevron Corporation
- 6.4.3 Engen Petroleum Ltd.
- 6.4.4 ENOC
- 6.4.5 ExxonMobil
- 6.4.6 General Petroleum FZE
- 6.4.7 Hass Petroleum
- 6.4.8 Lake Group
- 6.4.9 LIQUI MOLY GmbH
- 6.4.10 MOCL (Mineral Oil Corporation Ltd.)
- 6.4.11 Motul S.A.
- 6.4.12 National Oil Corporation of Kenya, Energizing Kenya
- 6.4.13 Oryx Energies
- 6.4.14 Rubis Energie
- 6.4.15 Shell plc
- 6.4.16 SINOPEC
- 6.4.17 TotalEnergies
- 6.4.18 Vivo Energy Holding B.V.
- 6.4.19 Yana Oil (Bureau Veritas)
7 Market Opportunities and Future Outlook
- 7.1 White-space and Unmet-Need Assessment
- 7.2 Growth of waste-oil collection and re-refining
- 7.3 Emerging e-commerce channels for lubricants
 拉絲潤滑劑市場:2026-2032年全球市場預測(依產品類型、添加劑類型、線材類型、應用、終端用戶產業和銷售管道分類)外科潤滑劑市場:按類型、應用、最終用戶和分銷管道分類-2026-2032年全球市場預測
 2026年全球潤滑油市場報告潤滑油市場:按產品類型、基礎油、黏度等級、最終用戶和分銷管道分類的全球市場預測,2026-2032年大豆油基潤滑劑市場:2026-2032年全球市場預測(依產品類型、包裝、應用、終端用戶產業及通路分類)紡織潤滑劑市場:依產品類型、劑型、應用及最終用途分類-2026年至2032年全球預測金屬切削潤滑劑市場:依產品類型、金屬類型、應用、終端用戶產業和通路分類-2026-2032年全球預測
 潤滑油過濾器市場規模、佔有率和成長分析:按過濾器類型、應用、材質、最終用戶和地區分類 - 2026-2033 年產業預測
 2026-2034年全球紗線潤滑劑市場規模、佔有率、趨勢和成長分析報告
 玻璃潤滑劑市場規模、佔有率和成長分析:按潤滑劑基礎類型、配方類型、應用方法、包裝類型、最終用戶產業和地區分類-2026-2033年產業預測