


 |
市場調查報告書
商品編碼
1906993
潤滑油:市場佔有率分析、產業趨勢與統計、成長預測(2026-2031)Lubricants - Market Share Analysis, Industry Trends & Statistics, Growth Forecasts (2026 - 2031) |
||||||
※ 本網頁內容可能與最新版本有所差異。詳細情況請與我們聯繫。
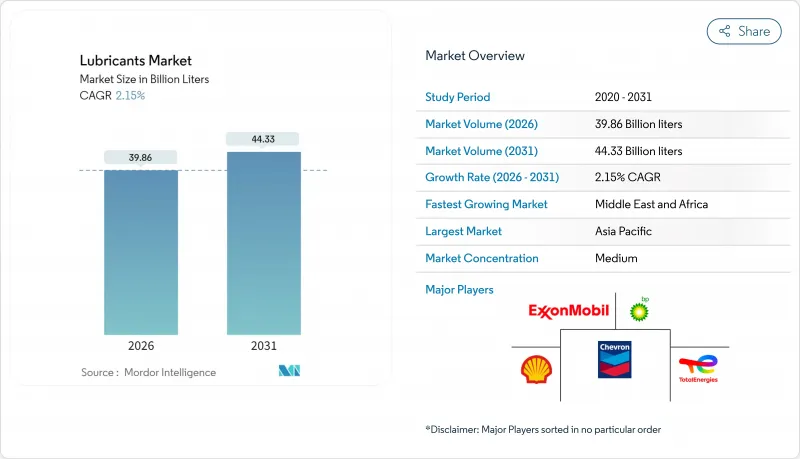
預計到 2026 年,潤滑油市場規模將達到 398.6 億公升,高於 2025 年的 390.2 億公升。預計到 2031 年,潤滑油市場規模將達到 443.3 億公升,2026 年至 2031 年的複合年成長率為 2.15%。
日益嚴格的環保法規以及汽車製造商為提高燃油經濟性而降低黏度的努力,正推動市場需求從傳統礦物油轉向高性能合成油。同時,風力發電機齒輪箱和電動車溫度控管系統等新的應用場景不斷湧現,創造了新的收入來源,彌補了傳統內燃機應用領域成長放緩的局面。高黏度合成酯的供應鏈風險、歐洲可能對內燃機的禁令以及北美日益嚴格的揮發性有機化合物(VOC)法規,都凸顯了複雜的風險回報格局,而擁有多元化產品系列的靈活配方商更受青睞。隨著各國石油公司進行垂直整合,以及全球巨頭擴大合成油產能以在高階細分市場獲取更高利潤,市場競爭持續加劇。
全球潤滑油市場趨勢與洞察
汽車保有量迅速成長,尤其是在新興亞洲國家
中國和印度公路車輛的快速成長正在重塑潤滑油市場格局,預計到2030年,兩國售後市場需求將分別成長14.7%和12.2%。中等收入家庭私家車擁有量的成長正在加速向合成油的轉變,合成油有望提高燃油經濟性並延長車輛使用壽命。印度對TREM Stage IV-V排放標準的遵守進一步推動了商用車領域對低SAP(硫含量)優質混合油的需求。南亞地區農業機械銷售的強勁成長也推動了對能夠承受嚴苛使用週期的多級高扭力潤滑油的需求。雖然從2029年起絕對銷售成長將放緩,但優質化趨勢預計將推動以美元計價的收入成長速度超過以升計價的銷售成長速度。能夠開發本地化配方並利用品牌價值的全球供應商將能夠充分利用這些結構性利好因素。
擴大發電設施(燃氣渦輪機、風力發電)的建設
全球可再生能源和燃氣渦輪機計劃的擴張,對能夠承受極端溫度和延長保養週期的特殊潤滑油產生了持續的需求。現代風力發電機機齒輪箱必須長達10年無需換油,這需要運作全合成的PAO基潤滑油,以防止白蝕裂縫和微點蝕。燃氣渦輪機同樣依賴高黏度指數潤滑油,這種潤滑油能夠在200°C下保持黏度,從而推動了對III類和茂金屬PAO基礎油的需求。離岸風力發電電場面臨鹽霧和高濕度的挑戰,通常會與能夠保證運轉率的潤滑油供應商簽訂多年服務合約。能夠滿足嚴格的OEM核准標準的供應商相對較少,這使得符合認證標準的供應商擁有定價權。
嚴格的礦物油生態毒性和揮發性有機化合物(VOC)法規
歐洲的REACH法規和加州的VOC法規正迫使潤滑油產業從傳統的礦物油基潤滑油轉向合成和生物基替代品。加州最新的消費品法規旨在每天減少21噸VOC排放,這將直接影響煞車清潔劑等高潤滑油用量的產品。在歐洲,氫氧化鋰水合物被列為生殖毒性物質,刺激了對磺酸磺酸鹽和鋁複合潤滑脂技術的研發投入。這些變化正推動潤滑油產業開發環保潤滑油。
細分市場分析
第一類基礎油目前仍佔據潤滑油市場最大佔有率,佔總市場佔有率的42.15%,但隨著高硫低黏度指數產品因原始設備製造商(OEM)規格要求而逐漸被淘汰,其市場佔有率正在穩步下降。第三類基油的產量在亞太地區正快速成長,這主要得益於新加坡和中國新建的加氫裂解計劃。預計到2026年,這兩個項目將使高品質基油的日供應量增加4萬桶以上。
這正推動潤滑油市場向低揮發性、高純度基料重新平衡,從而實現 0W-16 和 0W-8 配方,並將換油週期延長高達 30%。擁有整合煉油和添加劑技術的製造商能夠確保成本協同效應,並擁有受監管影響較小的供應鏈。同時,IV 類聚對氧酸酯 (PAO) 在航空、航太和風力發電機等細分市場中保持著高利潤率,這些市場對熱穩定性和抗氧化性要求極高。雖然 V 類酯類的產量較低,但它們為下一代電動車潤滑油奠定了基礎,並提供了一層多元化保障,以緩解傳統領域產量下降的影響。
儘管面臨多方面的不利因素,礦物油在 2025 年仍將佔據 65.85% 的市佔率。由於其成本競爭力,礦物油將在價格敏感的市場(例如農業機械和摩托車維修)中保持強勢地位,尤其是在東南亞和非洲。
然而,永續性要求、原始設備製造商 (OEM) 規範以及整體擁有成本計算工具日益重要,預計將推動合成和半合成潤滑油市場佔有率的成長。生物基潤滑油正以 3.21% 的複合年成長率成長,並擴大應用於對環境敏感的應用領域,例如林業、船舶甲板和食品加工機械,這些領域中意外洩漏會造成生態風險。挑戰仍然存在:氧化穩定性和低溫流動性的不足阻礙了其廣泛應用,而來自食品應用領域的競爭也使植物油原料的供應穩定性變得複雜。不過,歐洲和北美部分地區的稅收優惠和綠色採購法規正在縮小價格差距,並鼓勵礦物油用戶轉向永續的替代方案。
潤滑油報告依組別(I組、II組、III組、IV組、V組)、基礎油(礦物油、合成油、半合成油、生物基油)、產品類型(引擎油、變速箱和齒輪油、液壓油、金屬加工液等)、最終用戶業(汽車、發電、重型機械等)及地區(亞太地區(亞太地區、北美地區)進行細分。
區域分析
亞太地區潤滑油市場佔有率高達45.10%,這主要得益於中產階級汽車保有量的成長以及日益嚴格的區域排放標準推動高規格產品成為主流。埃克森美孚的新加坡殘渣油升級計劃、雪佛龍奧倫耐特的寧波計劃以及殼牌泰國潤滑脂工廠產能翻倍等戰略性產能擴張,正在增強該地區的供應韌性。
中東和非洲地區雖然絕對規模小規模,但到2031年將以3.19%的年成長率成為成長的主要驅動力。隨著工業化進程的加速,阿拉伯聯合大公國和沙烏地阿拉伯正將新建煉油廠與下游潤滑油調配業務結合,以瞄準奈及利亞和肯亞等高成長市場。歐洲和北美市場已趨於成熟。排放控制政策正推動市場向合成和生物基產品轉型,而美國頁岩基油的供應也支撐了國內調配業務的經濟效益。拉丁美洲正處於轉型期,基礎設施投資和汽車產業的復甦推動潤滑油市場溫和成長,但政策的不確定性限制著其長期前景。
其他福利:
- Excel格式的市場預測(ME)表
- 3個月的分析師支持
目錄
第1章 引言
- 研究假設和市場定義
- 調查範圍
第2章調查方法
第3章執行摘要
第4章 市場情勢
- 市場概覽
- 市場促進因素
- 汽車保有量快速成長-尤其是在新興亞洲地區
- 擴建發電設施(燃氣渦輪機、風力發電)
- 為了延長換油週期,汽車製造商正在降低機油黏度等級(0W-XX)。
- 主流電氣化仍然需要特殊的傳熱流體。
- 人工智慧驅動的預測性維護促進優質工業油的發展
- 市場限制
- 對礦物油製定嚴格的環境毒性和揮發性有機化合物(VOC)法規
- 歐洲加速禁止內燃機(ICE)將降低長期機油需求。
- 高黏度指數合成酯(航空、電動車)的供應風險
- 價值鏈分析
- 波特五力模型
- 供應商的議價能力
- 買方的議價能力
- 新進入者的威脅
- 替代品的威脅
- 競爭程度
第5章 市場規模和成長預測(價值和數量)
- 按組
- 第一組
- 第二組
- 第三組
- 第四組
- 第五組
- 依基料
- 礦物油潤滑油市場
- 合成潤滑油市場
- 半合成潤滑油市場
- 生物基潤滑劑市場
- 依產品類型
- 機油
- 變速箱油和齒輪油
- 油壓
- 金屬加工液
- 潤滑脂
- 其他產品類型
- 按最終用戶行業分類
- 車
- 發電
- 重型機械
- 冶金與金屬加工
- 其他終端用戶產業
- 按地區
- 亞太地區
- 中國
- 印度
- 日本
- 韓國
- 印尼
- 泰國
- 馬來西亞
- 越南
- 亞太其他地區
- 北美洲
- 美國
- 加拿大
- 墨西哥
- 歐洲
- 德國
- 英國
- 法國
- 義大利
- 西班牙
- 北歐國家
- 土耳其
- 俄羅斯
- 其他歐洲地區
- 南美洲
- 巴西
- 阿根廷
- 哥倫比亞
- 其他南美洲
- 中東和非洲
- 沙烏地阿拉伯
- 阿拉伯聯合大公國
- 卡達
- 奈及利亞
- 南非
- 埃及
- 其他中東和非洲地區
- 亞太地區
第6章 競爭情勢
- 市場集中度
- 策略趨勢
- 市佔率(%)/排名分析
- 公司簡介
- BP PLC
- Chevron Corporation
- China National Petroleum Corporation(CNPC)
- China Petroleum & Chemical Corporation(SINOPEC)
- ENEOS Corporation
- Exxon Mobil Corporation
- FUCHS
- Hindustan Petroleum Corporation Limited
- Idemitsu Kosan Co. Ltd
- Indian Oil Corporation Ltd
- LUKOIL
- MOTUL
- Petromin
- PETRONAS Lubricants International
- Phillips 66 Company
- PT Pertamina Lubricants
- Repsol
- Shell Plc
- TotalEnergies
- VALVOLINE INC.
第7章 市場機會與未來展望
Lubricants Market size in 2026 is estimated at 39.86 billion liters, growing from 2025 value of 39.02 billion liters with 2031 projections showing 44.33 billion liters, growing at 2.15% CAGR over 2026-2031.
Demand is shifting from traditional mineral-oil grades toward higher-performance synthetics as environmental regulations tighten and OEMs seek viscosity downgrades for fuel economy gains. Simultaneously, new use cases, including wind-turbine gearboxes and electric-vehicle thermal management systems, create fresh revenue pools that offset slower growth in legacy internal combustion applications. Supply-chain risk for high-viscosity synthetic esters, potential internal-combustion bans in Europe, and increasingly stringent VOC limits in North America underscore a complex risk-reward landscape that rewards agile formulators with diversified portfolios. Competitive intensity continues to rise as national oil companies vertically integrate and global majors expand synthetic capacity to secure higher margins in premium niches.
Global Lubricants Market Trends and Insights
Surging Vehicle Parc-Especially in Emerging Asia
The rapid expansion of the on-road vehicle population in China and India is reshaping the lubricants market, with aftermarket demand in those two nations rising at 14.7% and 12.2% respectively, through 2030. Rising middle-income ownership of personal vehicles is accelerating the shift from conventional mineral oils to synthetics, which promise fuel-economy gains and longer service intervals. Compliance with India's TREM Stage IV-V standards further lifts demand for low-SAPs, premium formulations in the commercial-vehicle segment. Strong growth in agricultural machinery sales across South Asia also spurs demand for multi-grade, high-torque lubricants that withstand harsher duty cycles. Although absolute volume expansion moderates after 2029, the premiumization trend is expected to lift dollar revenues faster than liter volumes. Global suppliers that localize blending and leverage brand equity are positioned to benefit from this structural tailwind.
Expanding Power-Generation Build-Out (Gas-Turbine, Wind)
Ambitious renewable and gas-turbine projects worldwide generate steady demand for specialty lubricants engineered for extreme temperatures and long service intervals. A modern wind-turbine gearbox must run as long as 10 years without an oil change, requiring fully synthetic PAO-based fluids tailored to prevent white-etching cracks and micro-pitting. Gas turbines likewise rely on high-VI lubricants that retain viscosity at 200 °C, fostering demand for Group III and metallocene PAO basestocks. Offshore wind farms present salinity and moisture challenges, prompting operators to forge multi-year service contracts with lubricant suppliers that can guarantee equipment uptime. With relatively few suppliers qualifying under stringent OEM approvals, pricing power favors those who clear the certification bar.
Stringent Eco-Toxicity and VOC Norms on Mineral Oils
European REACH requirements and California's VOC regulations are forcing a pivot away from conventional mineral-oil lubricants toward synthetics and bio-based alternatives. California's latest Consumer-Products rulemaking aims to eliminate 21 tons per day of VOC emissions, directly impacting common lubricant-rich products such as brake cleaners. In Europe, the classification of lithium hydroxide monohydrate as a reproductive toxicant has triggered research and development investments in calcium-sulfonate and aluminum-complex grease technologies. These shifts are propelling the lubricants industry towards development of environmentally acceptable lubricants.
Other drivers and restraints analyzed in the detailed report include:
- OEM Viscosity-Grade Downgrading (0W-XX) Extends Drain Intervals
- Mainstream Electrification Still Needs Specialty Thermal Fluids
- Accelerated ICE Bans in Europe Cut Long-Term Engine-Oil Demand
For complete list of drivers and restraints, kindly check the Table Of Contents.
Segment Analysis
Group I basestocks retain the largest 42.15% share of the lubricants market size, but their lead is steadily shrinking as OEM specifications render higher-sulfur, lower-VI products obsolete. Group III output is scaling rapidly in the Asia-Pacific region, buoyed by new hydrocracking projects in Singapore and China that, together, will add more than 40,000 barrels per day of premium basestock supply by 2026.
The lubricants market is therefore recalibrating toward low-volatility, high-purity basestocks that enable 0W-16 and 0W-8 formulations, extending oil-drain intervals by up to 30%. Producers with integrated refining and additive capabilities capture cost synergies and restriction-proof supply chains. Meanwhile, Group IV PAOs command high margins in the aviation, aerospace, and wind turbine niches, where thermal stability and oxidative resistance are non-negotiable. Group V esters, though small in volume, underpin next-generation EV fluids, adding a diversification layer that cushions volume erosion in traditional segments.
Mineral oils still command 65.85% of 2025 volume despite multi-faceted headwinds. Cost competitiveness keeps them entrenched in price-sensitive markets such as agricultural equipment and two-wheeler maintenance, especially across Southeast Asia and Africa.
Yet the lubricants market share of synthetic and semi-synthetic products is set to climb as sustainability mandates, OEM specs, and total-cost-of-ownership calculators gain prominence. Bio-based lubricants, expanding at 3.21% CAGR, are increasingly adopted in applications with environmental sensitivity, think forestry, marine decks, and food-processing machinery, where accidental leakage poses ecological risk. Obstacles remain: oxidative stability and cold-flow limits hinder broader adoption, and supply security for vegetable-oil feedstocks is complicated by competition with food uses. Nevertheless, tax incentives and green-procurement rules in Europe and parts of North America are closing the price gap, nudging mineral oil users toward sustainable substitutes.
The Lubricants Report is Segmented by Group (Group I, Group II, Group III, Group IV, and Group V), Base Stock (Mineral-Oil, Synthetic, Semi-Synthetic, and Bio-Based), Product Type (Engine Oils, Transmission and Gear Oils, Hydraulic Fluids, Metalworking Fluids, and More), End-User Industry (Automotive, Power Generation, Heavy Equipment, and More), and Geography (Asia-Pacific, North America, Europe, and More).
Geography Analysis
The Asia-Pacific's 45.10% lubricants market share is driven by trends amplified by the growth of middle-class vehicle ownership and stringent local emissions standards, which are pulling higher-spec products into the mainstream. Strategic capacity expansions, ExxonMobil's Singapore Resid Upgrade, Chevron Oronite's Ningbo project, and Shell's Thailand grease plant tripling output-fortify supply resilience in the region.
Middle East and Africa, though smaller in absolute terms, leads volumetric expansion at 3.19% through 2031. The UAE and Saudi Arabia are pairing new refining ventures with downstream lube blending, targeting high-growth markets such as Nigeria and Kenya, where industrialization is gathering pace in the lubricants industry. Europe and North America operate under mature market dynamics: restrictive emissions policies catalyze migration to synthetics and bio-based grades, while shale-advantaged basestock supply in the United States supports domestic blending economics. Latin America sits in transition; infrastructure spending and a rebounding automotive sector place the lubricants market on a moderate upward slope, though policy instability dampens long-term forecasts.
- BP PLC
- Chevron Corporation
- China National Petroleum Corporation (CNPC)
- China Petroleum & Chemical Corporation (SINOPEC)
- ENEOS Corporation
- Exxon Mobil Corporation
- FUCHS
- Hindustan Petroleum Corporation Limited
- Idemitsu Kosan Co. Ltd
- Indian Oil Corporation Ltd
- LUKOIL
- MOTUL
- Petromin
- PETRONAS Lubricants International
- Phillips 66 Company
- PT Pertamina Lubricants
- Repsol
- Shell Plc
- TotalEnergies
- VALVOLINE INC.
Additional Benefits:
- The market estimate (ME) sheet in Excel format
- 3 months of analyst support
TABLE OF CONTENTS
1 Introduction
- 1.1 Study Assumptions and Market Definition
- 1.2 Scope of the Study
2 Research Methodology
3 Executive Summary
4 Market Landscape
- 4.1 Market Overview
- 4.2 Market Drivers
- 4.2.1 Surging Vehicle Parc - Especially in Emerging Asia
- 4.2.2 Expanding Power-Generation Build-Out (Gas-Turbine, Wind)
- 4.2.3 OEM Viscosity-Grade Downgrading (0W-XX) Extends Drain Intervals
- 4.2.4 Mainstream Electrification Still Needs Specialty Thermal Fluids
- 4.2.5 AI-Enabled Predictive Maintenance Boosts Premium Industrial Oils
- 4.3 Market Restraints
- 4.3.1 Stringent Eco-Toxicity and VOC Norms on Mineral Oils
- 4.3.2 Accelerated ICE Bans in Europe Cut Long-Term Engine-Oil Demand
- 4.3.3 Supply-Risk of High-VI Synthetic Esters (Aviation, EV)
- 4.4 Value Chain Analysis
- 4.5 Porter's Five Forces
- 4.5.1 Bargaining Power of Suppliers
- 4.5.2 Bargaining Power of Buyers
- 4.5.3 Threat of New Entrants
- 4.5.4 Threat of Substitutes
- 4.5.5 Degree of Competition
5 Market Size and Growth Forecasts (Value and Volume)
- 5.1 By Group
- 5.1.1 Group I
- 5.1.2 Group II
- 5.1.3 Group III
- 5.1.4 Group IV
- 5.1.5 Group V
- 5.2 By Base Stock
- 5.2.1 Mineral-oil Lubricants
- 5.2.2 Synthetic Lubricants
- 5.2.3 Semi-synthetic Lubricants
- 5.2.4 Bio-based Lubricants
- 5.3 By Product Type
- 5.3.1 Engine Oils
- 5.3.2 Transmission and Gear Oils
- 5.3.3 Hydraulic Fluids
- 5.3.4 Metalworking Fluids
- 5.3.5 Greases
- 5.3.6 Other Product Types
- 5.4 By End-user Industry
- 5.4.1 Automotive
- 5.4.2 Power Generation
- 5.4.3 Heavy Equipment
- 5.4.4 Metallurgy and Metalworking
- 5.4.5 Other End-user Industries
- 5.5 By Geography
- 5.5.1 Asia-Pacific
- 5.5.1.1 China
- 5.5.1.2 India
- 5.5.1.3 Japan
- 5.5.1.4 South Korea
- 5.5.1.5 Indonesia
- 5.5.1.6 Thailand
- 5.5.1.7 Malaysia
- 5.5.1.8 Vietnam
- 5.5.1.9 Rest of Asia-Pacific
- 5.5.2 North America
- 5.5.2.1 United States
- 5.5.2.2 Canada
- 5.5.2.3 Mexico
- 5.5.3 Europe
- 5.5.3.1 Germany
- 5.5.3.2 United Kingdom
- 5.5.3.3 France
- 5.5.3.4 Italy
- 5.5.3.5 Spain
- 5.5.3.6 Nordics
- 5.5.3.7 Turkey
- 5.5.3.8 Russia
- 5.5.3.9 Rest of Europe
- 5.5.4 South America
- 5.5.4.1 Brazil
- 5.5.4.2 Argentina
- 5.5.4.3 Colombia
- 5.5.4.4 Rest of South America
- 5.5.5 Middle-East and Africa
- 5.5.5.1 Saudi Arabia
- 5.5.5.2 United Arab Emirates
- 5.5.5.3 Qatar
- 5.5.5.4 Nigeria
- 5.5.5.5 South Africa
- 5.5.5.6 Egypt
- 5.5.5.7 Rest of Middle-East and Africa
- 5.5.1 Asia-Pacific
6 Competitive Landscape
- 6.1 Market Concentration
- 6.2 Strategic Moves
- 6.3 Market Share (%)/Ranking Analysis
- 6.4 Company Profiles (includes Global level Overview, Market level overview, Core Segments, Financials as available, Strategic Information, Market Rank/Share for key companies, Products and Services, and Recent Developments)
- 6.4.1 BP PLC
- 6.4.2 Chevron Corporation
- 6.4.3 China National Petroleum Corporation (CNPC)
- 6.4.4 China Petroleum & Chemical Corporation (SINOPEC)
- 6.4.5 ENEOS Corporation
- 6.4.6 Exxon Mobil Corporation
- 6.4.7 FUCHS
- 6.4.8 Hindustan Petroleum Corporation Limited
- 6.4.9 Idemitsu Kosan Co. Ltd
- 6.4.10 Indian Oil Corporation Ltd
- 6.4.11 LUKOIL
- 6.4.12 MOTUL
- 6.4.13 Petromin
- 6.4.14 PETRONAS Lubricants International
- 6.4.15 Phillips 66 Company
- 6.4.16 PT Pertamina Lubricants
- 6.4.17 Repsol
- 6.4.18 Shell Plc
- 6.4.19 TotalEnergies
- 6.4.20 VALVOLINE INC.
7 Market Opportunities and Future Outlook
- 7.1 White-space and Unmet-Need Assessment
- 7.2 Growing Adoption of Bio-lubricants
 金屬切削潤滑劑市場:依產品類型、金屬類型、應用、終端用戶產業和通路分類-2026-2032年全球預測自行車潤滑脂市場按產品類型、通路、濃稠度等級和應用分類-全球預測,2026-2032年
 Isododecane潤滑劑市場規模、佔有率和成長分析:按產品類型、應用、最終用戶和地區分類-2026-2033年產業預測
 潤滑油市場分析及預測(至2035年):依類型、產品、應用、技術、最終用戶、形態、功能、安裝類型及解決方案分類
 南美潤滑油:市場佔有率分析、產業趨勢與統計、成長預測(2026-2031)泰國潤滑油:市場佔有率分析、產業趨勢與統計、成長預測(2026-2031)越南潤滑油:市場佔有率分析、產業趨勢與統計、成長預測(2026-2031)非洲潤滑油市場:市場佔有率分析、產業趨勢與統計、成長預測(2026-2031)
 全球大豆油基潤滑劑市場規模、佔有率、趨勢和成長分析報告(2026-2034)全球雌二醇市場規模、佔有率、趨勢和成長分析報告(2026-2034年)