


 |
市場調查報告書
商品編碼
1693511
印度控制釋放肥料:市場佔有率分析、產業趨勢與統計、成長預測(2025-2030 年)India Controlled Release Fertilizer - Market Share Analysis, Industry Trends & Statistics, Growth Forecasts (2025 - 2030) |
||||||
※ 本網頁內容可能與最新版本有所差異。詳細情況請與我們聯繫。
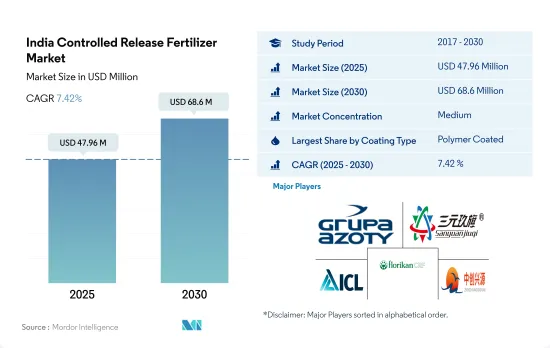
印度控制釋放肥料市場規模預計在 2025 年達到 4,796 萬美元,預計到 2030 年將達到 6,860 萬美元,預測期內(2025-2030 年)的複合年成長率為 7.42%。
高氮需求和永續的農業實踐正在推動對 CRF 的需求增加
- 控制釋放肥料是一項創新技術,可將養分釋放期延長至3個月、6個月、12個月和15個月,在該國得到越來越多的採用,以進一步支持小麥、水稻和玉米等主要作物的生長。
- 2017-2021年期間,該國控制釋放肥市場價值成長了106.1%,而消費量增加了24.2%。主要原因是印度政府強制要求所有國內尿素生產商生產 100% 印楝包覆尿素,並以補貼價格分發給農民。
- 田間作物田間作物佔耕地面積的 90.0%,因此將佔據市場主導地位,到 2022 年將佔消費量的 89.5%。印度主要的田間作物包括水稻、小麥、小米、玉米、豆類和油籽,作物在整個生長階段都需要高氮含量。
- 控制釋放尿素是印度使用最廣泛的控釋肥料。氮流失是稻農面臨的主要問題之一,由於氮氣透過揮發和淋溶損失較大,水稻的氮利用效率往往較低。提高氮利用效率的一種方法是使用控制釋放尿素。控制釋放尿素肥料在減少氮損失、促進植物生長和提高氮濃度方面通常優於顆粒尿素肥料。
- 日益成長的健康問題促使人們認真看待健康相關問題。人們對環境污染的日益關注以及控釋肥的非浸出特性對該國的控制釋放肥市場產生了積極影響,預計 2023 年至 2030 年的複合年成長率將達到 4.5%。
印度控制釋放肥料市場趨勢
穀物種植業蓬勃發展的印度預計將引領化肥市場。
- 報告期內,印度田間作物種植面積增加了3.5%。由於國內外消費需求不斷成長,穀物、豆類和油籽的種植面積增加是種植面積增加的主要因素。依作物類型分類,水稻、小麥和大豆的種植面積最大,到2022年分別為4,700萬公頃、3,110萬公頃和1,230萬公頃。水稻是印度最重要的作物,約佔全國種植面積的四分之一,養活了全國約一半的人口。幾乎全國各地都有種植,主要分佈在西孟加拉邦、北方邦、安得拉邦、旁遮普邦和泰米爾納德邦。
- 因此,預計該國的米消費量將從 2016 年的 9,580 萬噸增加到 2022 年的 1.07 億噸,顯示該國對作物的需求不斷成長。預計這一趨勢將在 2023 年至 2030 年期間進一步推高化肥需求。同樣,國內小麥種植量從 2017 年的 9,850 萬噸增加到 2020 年的 1.076 億噸。小麥主要種植在旁遮普邦、西孟加拉邦、哈里亞納邦和拉賈斯坦邦。小麥是印度第二大穀物作物,在該國的糧食和營養安全中發揮著至關重要的作用。因此,該國擁有大量穀物作物,再加上國內外需求的成長,預計將在預測期內推動印度化肥市場的發展。
在主要養分中,氮是大田作物施用最多的養分,平均施用量為223.5公斤/公頃。
- 2022年所有主要養分的平均施用率為125.1公斤/公頃,其中氮和其他養分的平均施用率最高,為223.5公斤/公頃。因此,氮是該國集約化種植的水稻等作物的主要營養來源,而土壤養分缺乏正在限制全國的水稻產量。
- 印度生物肥料和有機肥料的現況顯示土壤健康狀況不佳,同時化肥消費量不斷增加。結果表明,受試土壤中氮、磷、鉀缺量的比例分別為97.0%、83.0%和71.0%。
- 以作物,2022年平均養分施用量最高的作物是小麥、水稻和玉米,估計分別為231公斤/公頃、156公斤/公頃和149公斤/公頃。小麥和米是我國乃至全球重要的主糧。多種營養缺乏是降低產量和利潤的重要因素。小麥和水稻作物需要氮、磷、鉀和硫、硼、鐵和鋅等微量營養素才能正常生長。適當的營養管理對於作物的成功生產是必要的,這推動了市場的成長。
- 田間作物消耗大量的主要營養物質,例如氮肥。該國密集種植的穀類正在耗盡土壤中的養分,需要更多的肥料來補充。
印度控制釋放肥料產業概況
印度控制釋放肥料市場適度整合,前五大公司佔58.57%的市佔率。市場的主要企業有:Grupa Azoty SA(Compo Expert)、河北三元九七化肥、ICL Group Ltd、New Mountain Capital(Florikan)和中創興源化工科技(按字母順序排列)
其他福利
- Excel 格式的市場預測 (ME) 表
- 3個月的分析師支持
目錄
第1章執行摘要和主要發現
第2章 報告要約
第3章 引言
- 研究假設和市場定義
- 研究範圍
- 調查方法
第4章 產業主要趨勢
- 主要作物種植面積
- 田間作物
- 園藝作物
- 平均養分施用量
- 主要營養素
- 田間作物
- 園藝作物
- 主要營養素
- 法律規範
- 價值鍊和通路分析
第5章市場區隔
- 塗層類型
- 聚合物塗層
- 聚合物硫塗層
- 其他
- 作物類型
- 田間作物
- 園藝作物
- 草坪和觀賞植物
第6章 競爭格局
- 關鍵策略趨勢
- 市場佔有率分析
- 商業狀況
- 公司簡介
- Grupa Azoty SA(Compo Expert)
- Haifa Group
- Hebei Sanyuanjiuqi Fertilizer Co., Ltd.
- ICL Group Ltd
- New Mountain Capital(Florikan)
- Zhongchuang xingyuan chemical technology co.ltd
第7章:CEO面臨的關鍵策略問題
第 8 章 附錄
- 世界概況
- 概述
- 五力分析框架
- 全球價值鏈分析
- 市場動態(DRO)
- 資訊來源及延伸閱讀
- 圖片列表
- 關鍵見解
- 資料包
- 詞彙表
The India Controlled Release Fertilizer Market size is estimated at 47.96 million USD in 2025, and is expected to reach 68.6 million USD by 2030, growing at a CAGR of 7.42% during the forecast period (2025-2030).
High nitrogen requirements and sustainable agricultural practices are increasing the demand for CRFs
- The adoption of controlled-release fertilizers is increasing more in the country as this is an innovative technique that extends nutrient release time by 3, 6, 12, or even 15 months, which gives additional support to the growth of major crops, such as wheat, rice, and maize.
- The controlled-release fertilizer market in the country witnessed an increase in market value by 106.1%, whereas the consumption volume increased by 24.2% during 2017-2021. The main reason for this was the Government of India making it mandatory for all domestic producers of urea to produce 100% neem-coated urea and distribute it at a subsidized price to the farmers.
- Field crops dominated the market, with consumption volume accounting for 89.5% in 2022 as field crops occupied 90.0% of the cultivated area. Major field crops in India include rice, wheat, millet, maize, pulses, and oilseeds, which require high nitrogen content throughout their growth stages.
- Controlled-release urea is the most used form of CRF in India. Nitrogen loss is one of the main problems faced by rice farmers, and the efficiency of nitrogen utilization in rice is often inadequate due to the large loss of nitrogen caused by volatilization and leaching. One way to improve nitrogen efficiency is to use controlled-release urea. Controlled-release urea fertilizers generally outperform granular urea fertilizers in reducing nitrogen loss, stimulating plant growth, and increasing nitrogen concentration.
- Growing concerns regarding health have pushed people to take health-related problems seriously. Increasing inclination toward environmental pollution and the no-leaching property of CRF are positively influencing the controlled-release fertilizer market in the country, which is expected to record a CAGR of 4.5% from 2023 to 2030.
India Controlled Release Fertilizer Market Trends
The intense cereal cultivation in the country is anticipated to drive the Indian fertilizer market
- The area under field crop cultivation in the country increased by 3.5% during the study period. The increased cultivation of cereals, pulses, and oilseeds in the country due to the rising consumer demand domestically and internationally is the major driving factor for the rising acreage. By crop type, rice, wheat, and soybean occupied the largest area under cultivation in the country, accounting for 47 million ha, 31.1 million ha, and 12.3 million ha in 2022. Rice is the most important food crop of India, covering about one-fourth of the total cropped area and providing food to about half of the Indian population. It is cultivated in almost all the states of the country, mainly in West Bengal, Uttar Pradesh, Andhra Pradesh, Punjab, and Tamil Nadu.
- Accordingly, rice consumption in the country increased from 95.8 million tons in 2016 to 107 million tons in 2022, which shows the rising demand for the crop in the country. This trend is further anticipated to drive the demand for fertilizers during 2023-2030. Similarly, wheat cultivation in the country increased from 98.5 million tons in 2017 to 107.6 million tons in 2020. It is cultivated majorly in Punjab, West Bengal, Haryana, and Rajasthan. Wheat is the second most important cereal crop in India and plays a vital role in the country's food and nutritional security. Therefore, the intense cereal cultivation in the country, coupled with rising domestic and international demand, is anticipated to drive the Indian fertilizer market during the forecast period.
Among the primary nutrients, nitrogen is the most-applied nutrient in field crops, with an average application rate of 223.5 kg per hectare
- The overall primary nutrient average application rate in 2022 was 125.1 kg/ha, with nutrients such as nitrogen with the highest average application rate of 223.5 kg/ha. Accordingly, nitrogen is the major source of nutrients for crops such as rice, which is intensively cultivated in the country, and such nutrient deficiency in soil is limiting rice productivity across the nation.
- The State of Biofertilizers and Organic Fertilizers in India marked the poor status of soil health, with increasing consumption of chemical fertilizers in India. Accordingly, 97.0%, 83.0%, and 71.0% of the soil tested were found to be deficient in nitrogen, phosphorous, and potassium, respectively.
- By crop, wheat, rice, and corn/maize are estimated to be the crop types with the highest average nutrient application rate of 231, 156, and 149 kg/ha in 2022. Wheat and rice are important staple food domestically and globally. Multiple nutrient deficiencies are the key factors that reduce yield and profit. Wheat and rice crops require nitrogen, phosphorous, and potassium, along with other micronutrients such as sulfur, boron, iron, and zinc, for their proper growth and development. The proper management of nutrients is necessary for successful crop production, which is driving market growth.
- Field crops consume the maximum amount of primary nutrients, such as nitrogen fertilizer. As grains and cereals are intensively grown in the country, the soil is depleted of its nutrition, and hence, they require more fertilizers to supplement them, which, in turn, is anticipated to drive the market during 2023-2030.
India Controlled Release Fertilizer Industry Overview
The India Controlled Release Fertilizer Market is moderately consolidated, with the top five companies occupying 58.57%. The major players in this market are Grupa Azoty S.A. (Compo Expert), Hebei Sanyuanjiuqi Fertilizer Co., Ltd., ICL Group Ltd, New Mountain Capital (Florikan) and Zhongchuang xingyuan chemical technology co.ltd (sorted alphabetically).
Additional Benefits:
- The market estimate (ME) sheet in Excel format
- 3 months of analyst support
TABLE OF CONTENTS
1 EXECUTIVE SUMMARY & KEY FINDINGS
2 REPORT OFFERS
3 INTRODUCTION
- 3.1 Study Assumptions & Market Definition
- 3.2 Scope of the Study
- 3.3 Research Methodology
4 KEY INDUSTRY TRENDS
- 4.1 Acreage Of Major Crop Types
- 4.1.1 Field Crops
- 4.1.2 Horticultural Crops
- 4.2 Average Nutrient Application Rates
- 4.2.1 Primary Nutrients
- 4.2.1.1 Field Crops
- 4.2.1.2 Horticultural Crops
- 4.2.1 Primary Nutrients
- 4.3 Regulatory Framework
- 4.4 Value Chain & Distribution Channel Analysis
5 MARKET SEGMENTATION (includes market size in Value in USD and Volume, Forecasts up to 2030 and analysis of growth prospects)
- 5.1 Coating Type
- 5.1.1 Polymer Coated
- 5.1.2 Polymer-Sulfur Coated
- 5.1.3 Others
- 5.2 Crop Type
- 5.2.1 Field Crops
- 5.2.2 Horticultural Crops
- 5.2.3 Turf & Ornamental
6 COMPETITIVE LANDSCAPE
- 6.1 Key Strategic Moves
- 6.2 Market Share Analysis
- 6.3 Company Landscape
- 6.4 Company Profiles
- 6.4.1 Grupa Azoty S.A. (Compo Expert)
- 6.4.2 Haifa Group
- 6.4.3 Hebei Sanyuanjiuqi Fertilizer Co., Ltd.
- 6.4.4 ICL Group Ltd
- 6.4.5 New Mountain Capital (Florikan)
- 6.4.6 Zhongchuang xingyuan chemical technology co.ltd
7 KEY STRATEGIC QUESTIONS FOR FERTILIZER CEOS
8 APPENDIX
- 8.1 Global Overview
- 8.1.1 Overview
- 8.1.2 Porter's Five Forces Framework
- 8.1.3 Global Value Chain Analysis
- 8.1.4 Market Dynamics (DROs)
- 8.2 Sources & References
- 8.3 List of Tables & Figures
- 8.4 Primary Insights
- 8.5 Data Pack
- 8.6 Glossary of Terms
 全球種子與肥料處理市場(2025-2032 年)
 控釋肥料(CRF):市佔率分析、產業趨勢與統計、成長預測(2026-2031)
 2026年全球緩釋肥料市場報告控釋肥料市場-2026-2031年預測
 非農業用控制釋放肥料顆粒市場(依配方類型、養分機制、成分、應用、最終用戶和通路分類),全球預測(2026-2032年)
 緩釋性肥料市場規模、佔有率及成長分析(按類型、應用方法、最終用途及地區分類)-2026-2033年產業預測
 控釋肥料市場-全球產業規模、佔有率、趨勢、機會和預測,按類型、最終用途、應用方式、地區和競爭格局分類,2020-2030年預測
 全球控釋肥料(CRF)市場按類型、功能、產品等級、應用方法、最終用途和地區分類-預測至2030年包衣肥料市場-全球產業規模、佔有率、趨勢、機會和預測(按類型、作物類型、地區和競爭情況分類,2020-2030 年)控制釋放液態氮市場按產品類型、包衣類型、形態、釋放機制、施用方法、作物類型、最終用戶和分銷管道分類 - 全球預測 2025-2030