


 |
市場調查報告書
商品編碼
1693535
亞太地區控制釋放肥料:市場佔有率分析、產業趨勢與統計、成長預測(2025-2030 年)Asia-Pacific Controlled Release Fertilizer - Market Share Analysis, Industry Trends & Statistics, Growth Forecasts (2025 - 2030) |
||||||
※ 本網頁內容可能與最新版本有所差異。詳細情況請與我們聯繫。
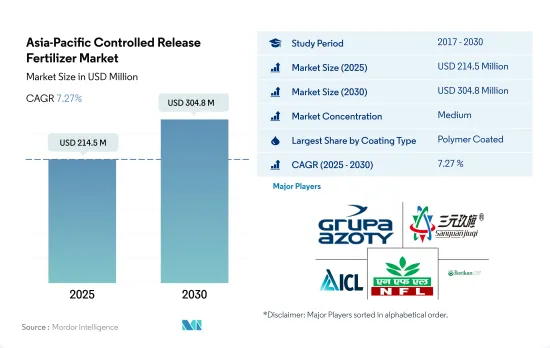
亞太地區控制釋放肥料市場規模預計在 2025 年為 2.145 億美元,預計到 2030 年將達到 3.048 億美元,預測期內(2025-2030 年)的複合年成長率為 7.27%。
中國和印度主導亞太控制釋放肥料市場
- 在研究期間,聚合物包膜控制釋放肥料市場經歷了顯著的成長。到 2022 年,這些肥料將佔據整個亞太地區控制釋放肥料 (CRF) 市場的 76.0% 佔有率。該地區對生態學安全肥料的日益重視是新型控制釋放肥料需求激增的主要驅動力。
- 玉米、大豆、油菜籽等穀物和油籽種植面積的擴大正在推動多硫包衣尿素市場的發展。此外,土壤中尿素的過量累積導致了尿素的枯竭,從而刺激了對多硫包膜控制釋放肥料的需求。此外,由於對高效環保產品的需求不斷增加等因素,多硫塗層 CRF 市場可望成長。預計該地區 2023 年至 2030 年的複合年成長率為 6.8%。
- 2022年,中國在其他類型的包膜控制釋放肥料市場佔據主導地位,佔控釋肥市場42.3%的價值佔有率。在這些肥料中,約69.6%施用於田間作物,其次是園藝作物。
- 使用化學肥料會產生有害影響,包括改變土壤 pH 值、抑制微生物生長以及過度施氮釋放溫室氣體。這些環境問題,加上營養物質流失的增加,刺激了對替代肥料的需求。因此,預計 2023 年至 2030 年市場以金額為準將達到 6.2%。
中國主導亞太控制釋放肥市場
- 亞太地區約70.0%的人口直接依賴農業作為主要生計。然而,該地區的農業部門面臨著許多生產力低下的許多挑戰。
- 中國在亞太控制釋放肥市場佔據主導地位,2022 年佔 43.8% 的市佔率。聚合物包膜性肥料在控制釋放肥料市場中佔有最大佔有率,其次是聚合物硫包膜性肥料。 2017 年聚合物包膜性肥料市場價值為 1,790 萬美元,預計到 2030 年將達到 5,800 萬美元,這主要是因為採用 CRF 減少了肥料消費量,從而提高了 NUE。
- 印度將成為該地區第二大控制釋放肥料市場,到2022年將佔16.6%。控制釋放尿素是印度最常使用的控釋肥料。氮損失是稻農面臨的主要問題之一,水稻的氮利用效率通常較低。這是由於氮透過揮發、淋溶和反硝化作用大量損失所致。提高氮利用效率的一種方法是使用控制釋放尿素。控制釋放尿素在減少氮損失、促進植物生長和增加氮濃度方面通常優於顆粒尿素肥料。
- 2017年,中國國際植物營養研究所在湖北省進行控制釋放尿素肥料應用計畫。事實證明,持續使用 CRU 肥料有助於提高水稻和茄子等主要作物的產量和盈利。因此,預計未來該市場將會成長。
亞太控制釋放肥料市場趨勢
主要作物種植面積的大幅擴大預計將推動市場成長。
- 該地區以田間作物種植為主,佔耕地總面積的95%以上。水稻、小麥和玉米是該地區的主要田間作物,到2022年,這三種作物的種植面積總合該地區作物總種植面積的38%。預計種植面積的增加將增加該國對化肥的需求。
- 亞太地區包括中國、印度、巴基斯坦和澳大利亞,是世界上最大的小麥生產區之一。中國和印度分別是世界上最大的小麥生產國和消費國。小麥需求和消費量的增加是由於小麥是該地區的主要主食之一,而且在研究期間小麥種植面積增加了一個百分點。 2022年,中國小麥產量為1.38億噸,成為全球最大的小麥生產國,印度小麥產量為1.03億噸。
- 水稻是該地區最大的田間作物。僅其種植面積就佔2022年農業用地總面積的約16.44%。水稻是亞洲和太平洋大部分地區的主食。預計2022年中國米產量為1.47億噸,印度米產量為1.24億噸。預計印度將消費1.09億噸,出口1,950萬噸,為全球最大出口國。
- 國內外對田間作物的需求迅速成長,促進了田間作物面積的擴大。預計耕地面積的大幅增加將對2023年至2030年亞太地區的CRF市場產生直接正面的影響。
全球農業用地氧化亞氮排放量約有28%來自中國農地。
- 對於田間作物,2022年全國主要養分(氮、鉀和磷)的平均施用率為129.1公斤/公頃。氮為58.5%,鉀為25.3%,磷為16.1%。大多數主要營養物質都是透過土壤施用方法施用的。 2022 年,傳統土壤基主要大量營養素肥料將佔主要大量營養素肥料市場總量的 69.2%。
- 亞洲主要的營養元素投入量很高,尤其是氮肥和鉀肥。然而,亞太地區作為世界上土地面積和人口最多的地區,也是世界上農藥生產量和消費量最大的地區。全球約28%的氧化亞氮排放排放中國的農業用地。
- 在田間作物中,小麥平均一次養分施用量為214.9公斤/公頃,是2022種田間作物中最高的。在主要養分中,氮肥佔有首要地位,平均施用量為448.5公斤/公頃。植物代謝需要大量的氮。它也是葉綠素和氨基酸的主要成分。
- 地表水和地下水受到氮和磷的污染,是由於沒有向農民提供有關施肥量和大規模作物的建議不足所造成的。然而,趨勢正在轉向更有效率的肥料。
亞太控制釋放肥料產業概況
亞太地區控制釋放肥市場適度整合,前五大公司佔61.40%的市佔率。市場的主要企業是:Grupa Azoty SA(Compo Expert)、河北三元九七化肥、ICL Group Ltd、National Fertilizers Ltd 和 New Mountain Capital(Florikan)(按字母順序排列)
其他福利
- Excel 格式的市場預測 (ME) 表
- 3個月的分析師支持
目錄
第1章執行摘要和主要發現
第2章 報告要約
第3章 引言
- 研究假設和市場定義
- 研究範圍
- 調查方法
第4章 產業主要趨勢
- 主要作物種植面積
- 田間作物
- 園藝作物
- 平均養分施用量
- 主要營養素
- 田間作物
- 園藝作物
- 主要營養素
- 法律規範
- 價值鍊和通路分析
第5章市場區隔
- 塗層類型
- 聚合物塗層
- 聚合物硫塗層
- 其他
- 作物類型
- 田間作物
- 園藝作物
- 草坪和觀賞植物
- 原產地
- 澳洲
- 孟加拉
- 中國
- 印度
- 印尼
- 日本
- 巴基斯坦
- 菲律賓
- 泰國
- 越南
- 其他亞太地區
第6章競爭格局
- 關鍵策略趨勢
- 市場佔有率分析
- 商業狀況
- 公司簡介
- Grupa Azoty SA(Compo Expert)
- Haifa Group
- Hebei Sanyuanjiuqi Fertilizer Co., Ltd.
- Hebei Woze Wufeng Biological Technology Co., Ltd
- ICL Group Ltd
- National Fertilizers Ltd
- New Mountain Capital(Florikan)
- Zhongchuang xingyuan chemical technology co.ltd
第7章:CEO面臨的關鍵策略問題
第 8 章 附錄
- 世界概況
- 概述
- 五力分析框架
- 全球價值鏈分析
- 市場動態(DRO)
- 資訊來源及延伸閱讀
- 圖片列表
- 關鍵見解
- 資料包
- 詞彙表
The Asia-Pacific Controlled Release Fertilizer Market size is estimated at 214.5 million USD in 2025, and is expected to reach 304.8 million USD by 2030, growing at a CAGR of 7.27% during the forecast period (2025-2030).
China and India dominate the Asia-Pacific controlled-release fertilizers market
- During the study period, the market for polymer-coated controlled-release fertilizers experienced notable growth. By 2022, these fertilizers held a significant share of 76.0% in the overall controlled-release fertilizer (CRF) market in Asia-Pacific. The region's increasing emphasis on ecologically safe fertilizers is a key driver behind the surge in demand for new controlled-release options.
- The cultivation expansion of cereal and oilseeds, including corn, soybeans, and rapeseed, is propelling the market for poly-sulfur-coated urea. Moreover, excessive urea accumulation in soils has led to depletion, fueling the demand for poly-sulfur-coated controlled-release fertilizers. In addition, the market for poly-sulfur-coated CRFs is poised for growth, driven by factors like the rising demand for highly efficient and eco-friendly products. It is projected to achieve a value CAGR of 6.8% in the region between 2023-2030.
- In 2022, China dominated the market for other types of coated controlled-release fertilizers, commanding a 42.3% value share in the CRF market. Of these fertilizers, approximately 69.6% were utilized in field crops, with horticultural crops following suit.
- The use of chemical fertilizers has detrimental effects, including soil pH alteration, inhibition of microbial growth, and the release of greenhouse gases from excessive nitrogen application. These environmental concerns, coupled with escalating nutrient losses, are fueling the demand for alternative fertilizers. As a result, the market is projected to witness a CAGR of 6.2% in value during the period spanning from 2023 to 2030.
China dominates the APAC controlled-release fertilizer market
- Approximately 70.0% of the population in the Asia-Pacific region depends directly on agriculture as the primary source of their livelihood. However, the region's agriculture sector is facing many issues in terms of low productivity.
- China dominates the APAC controlled-release fertilizer market, accounting for 43.8% of the market value share in 2022. Polymer-coated fertilizers accounted for the largest share of the controlled-release fertilizer market, followed by polymer sulfur-coated fertilizers. The polymer-coated fertilizer segment was valued at USD 17.9 million in 2017, and it is anticipated to reach USD 58.0 million by 2030, mainly due to increasing NUE by reducing fertilizer consumption by adopting CRFs.
- India is the region's second-largest market for controlled-release fertilizers, accounting for 16.6% in 2022. Controlled-release urea is the most commonly used form of CRF in India. Nitrogen loss is one of the main problems faced by rice farmers, and the efficiency of nitrogen utilization in rice is often inadequate. This is due to the large loss of nitrogen due to volatilization, leaching, and denitrification. One way to improve nitrogen efficiency is to use controlled-release urea. Controlled-release urea generally outperforms granular urea fertilizers in reducing nitrogen loss, stimulating plant growth, and increasing nitrogen concentration.
- In 2017, the International Plant Nutrition Institute of China conducted a controlled-release urea fertilizer Application Program in Hubei province. It was proven that the consistent use of CRU fertilizer helps improve the yield and profitability of major crops, such as rice and eggplant. Hence, the market is expected to grow in the future.
Asia-Pacific Controlled Release Fertilizer Market Trends
The significant expansion of cultivation of major growing crops is anticipated to boost the growth of the market
- Field crop cultivation dominates the region, accounting for more than 95% of the total crop area. Rice, wheat, and corn are the major field crops produced in the region, together accounting for about 38% of the total crop area in 2022. The rising area under cultivation is expected to increase the demand for fertilizer usage in the country.
- The Asia-Pacific region, which includes China, India, Pakistan, and Australia, is among the world's largest wheat producers. China and India are also the world's largest wheat producers and consumers. The increase in demand and consumption of wheat is due to wheat being one of the major staple foods of this region, and the area increased by a percentage point during the study period. In 2022, China accounted for the production of 138 million metric tons of wheat, making it the largest wheat producer in the world, and India had a wheat production of 103 million metric tons.
- Rice is the largest cultivated field crop in the region. Its cultivation alone accounted for about 16.44% of the total agricultural land in 2022. Rice is the staple food of Asia and most parts of the Pacific region. China was projected to produce 147 million tons of rice, and India was expected to harvest 124 million tons of rice in 2022. India was expected to consume 109 million tons while exporting a world-leading 19.5 million tons.
- The surge in both domestic and international demand for field crops has prompted an expansion in the cultivation area dedicated to these crops. This significant increase in cultivated land is expected to have a direct and positive impact on the Asia-Pacific CRF market from 2023 to 2030.
About 28% of nitrous oxide emissions from croplands in the world are from China's agricultural lands
- In field crops, the average primary nutrient (nitrogen, potassium, and phosphorus) application rate in the country was 129.1 kg/ha in 2022. Nitrogen accounted for 58.5%, potassium for 25.3%, and phosphorus for 16.1% of the average primary nutrient application for field crops. Most primary nutrients were applied through the soil application method. Conventional soil-based primary macronutrient fertilizers accounted for 69.2% of the total primary macronutrient fertilizer market in 2022.
- In Asia, the primary nutrient input is high, particularly for nitrogenous and potassic fertilizers, because most soils in the region are deficient in nitrogen and potassic nutrients. However, Asia-Pacific, which is the largest region in the world in terms of land area and population, is also the largest producer and consumer of agrochemicals among all the regions worldwide. About 28% of nitrous oxide emissions from croplands worldwide are from China's agricultural lands.
- In field crops, wheat had an average primary nutrient application rate of 214.9 kg/ha, the highest among field crops in 2022. In primary nutrients, nitrogen occupies the first place with an average application rate of 448.5 kg/ha, as nitrogen is required in large amounts for plant metabolism. It is also a major component of chlorophyll and amino acids.
- The contamination of surface and groundwater with nitrogen and phosphorus has been considered a result of inadequate advice given to farmers regarding fertilizer application rates and a possible larger crop. However, the trend is shifting toward highly efficient fertilizers.
Asia-Pacific Controlled Release Fertilizer Industry Overview
The Asia-Pacific Controlled Release Fertilizer Market is moderately consolidated, with the top five companies occupying 61.40%. The major players in this market are Grupa Azoty S.A. (Compo Expert), Hebei Sanyuanjiuqi Fertilizer Co., Ltd., ICL Group Ltd, National Fertilizers Ltd and New Mountain Capital (Florikan) (sorted alphabetically).
Additional Benefits:
- The market estimate (ME) sheet in Excel format
- 3 months of analyst support
TABLE OF CONTENTS
1 EXECUTIVE SUMMARY & KEY FINDINGS
2 REPORT OFFERS
3 INTRODUCTION
- 3.1 Study Assumptions & Market Definition
- 3.2 Scope of the Study
- 3.3 Research Methodology
4 KEY INDUSTRY TRENDS
- 4.1 Acreage Of Major Crop Types
- 4.1.1 Field Crops
- 4.1.2 Horticultural Crops
- 4.2 Average Nutrient Application Rates
- 4.2.1 Primary Nutrients
- 4.2.1.1 Field Crops
- 4.2.1.2 Horticultural Crops
- 4.2.1 Primary Nutrients
- 4.3 Regulatory Framework
- 4.4 Value Chain & Distribution Channel Analysis
5 MARKET SEGMENTATION (includes market size in Value in USD and Volume, Forecasts up to 2030 and analysis of growth prospects)
- 5.1 Coating Type
- 5.1.1 Polymer Coated
- 5.1.2 Polymer-Sulfur Coated
- 5.1.3 Others
- 5.2 Crop Type
- 5.2.1 Field Crops
- 5.2.2 Horticultural Crops
- 5.2.3 Turf & Ornamental
- 5.3 Country
- 5.3.1 Australia
- 5.3.2 Bangladesh
- 5.3.3 China
- 5.3.4 India
- 5.3.5 Indonesia
- 5.3.6 Japan
- 5.3.7 Pakistan
- 5.3.8 Philippines
- 5.3.9 Thailand
- 5.3.10 Vietnam
- 5.3.11 Rest of Asia-Pacific
6 COMPETITIVE LANDSCAPE
- 6.1 Key Strategic Moves
- 6.2 Market Share Analysis
- 6.3 Company Landscape
- 6.4 Company Profiles
- 6.4.1 Grupa Azoty S.A. (Compo Expert)
- 6.4.2 Haifa Group
- 6.4.3 Hebei Sanyuanjiuqi Fertilizer Co., Ltd.
- 6.4.4 Hebei Woze Wufeng Biological Technology Co., Ltd
- 6.4.5 ICL Group Ltd
- 6.4.6 National Fertilizers Ltd
- 6.4.7 New Mountain Capital (Florikan)
- 6.4.8 Zhongchuang xingyuan chemical technology co.ltd
7 KEY STRATEGIC QUESTIONS FOR FERTILIZER CEOS
8 APPENDIX
- 8.1 Global Overview
- 8.1.1 Overview
- 8.1.2 Porter's Five Forces Framework
- 8.1.3 Global Value Chain Analysis
- 8.1.4 Market Dynamics (DROs)
- 8.2 Sources & References
- 8.3 List of Tables & Figures
- 8.4 Primary Insights
- 8.5 Data Pack
- 8.6 Glossary of Terms
 控釋肥料市場-全球產業規模、佔有率、趨勢、機會和預測,按類型、最終用途、應用方式、地區和競爭格局分類,2020-2030年預測
 全球控釋肥料(CRF)市場按類型、功能、產品等級、應用方法、最終用途和地區分類-預測至2030年
 緩釋性肥市場按包覆類型、作物類型、釋放期、養分類型、應用、最終用途和銷售管道分類-2025-2032 年全球預測包衣肥料市場-全球產業規模、佔有率、趨勢、機會和預測(按類型、作物類型、地區和競爭情況分類,2020-2030 年)控制釋放液態氮市場按產品類型、包衣類型、形態、釋放機制、施用方法、作物類型、最終用戶和分銷管道分類 - 全球預測 2025-2030
 全球硝化抑制劑及尿素酶抑制劑市場分析及預測(至2032年):依產品類型、營養類型、作物類型、施用方法、通路、最終用戶及地區分類
 2025年全球控制釋放肥市場報告
 2025-2033年控釋肥料市場(按類型、形式、應用和地區)報告
 硝化抑制劑及脲酶抑制劑市場機會、成長動力、產業趨勢分析及 2025 - 2034 年預測2032 年控制釋放和緩釋性肥市場預測:按類型、作物類型、應用類型和地區分類的全球分析