


 |
市場調查報告書
商品編碼
1693411
亞太聚氨酯接著劑:市場佔有率分析、產業趨勢與統計、成長預測(2025-2030 年)Asia-Pacific Polyurethane Adhesives - Market Share Analysis, Industry Trends & Statistics, Growth Forecasts (2025 - 2030) |
||||||
價格
※ 本網頁內容可能與最新版本有所差異。詳細情況請與我們聯繫。
簡介目錄
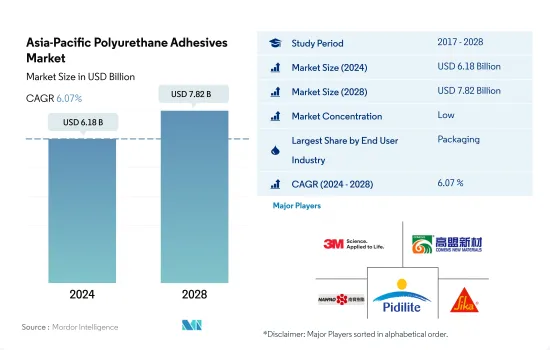
預計 2024 年亞太地區聚氨酯接著劑市場規模將達到 61.8 億美元,預計到 2028 年將達到 78.2 億美元,預測期內(2024-2028 年)的複合年成長率為 6.07%。
中國新興的汽車市場和包裝終端使用產業預計將推動亞太地區聚氨酯接著劑的消費
- 聚氨酯接著劑廣泛應用於包裝產業。聚氨酯接著劑用於食品和飲料包裝、容器包裝、功能性阻隔應用的生產線末端包裝以及金屬包裝。聚氨酯接著劑在包裝應用的使用量正在增加,2018年和2019年的成長率分別為4.76%和2.2%。
- 建築業佔據亞太聚氨酯接著劑市場的大部分佔有率,因為聚氨酯接著劑具有良好的內聚力、附著力、彈性、高內聚強度、柔韌性以及基材的高彈性模量。中國是亞太地區成長最快的國家,預計2022年至2028年期間聚氨酯建築膠黏劑消費量的複合年成長率將達到5%。由於建築產量增加,中國對聚氨酯建築膠合劑的需求創下最高紀錄,2021年達到4.6兆美元,與前一年同期比較增10%。
- 聚氨酯接著劑廣泛應用於汽車領域。預計未來電動四輪車在亞洲市場的普及將繼續發揮重要作用。從絕對值來看,中國預計將成為最大的電動車市場。按照目前的發展軌跡,到2030年,中國的滲透率將接近60%,佔全球新電動車銷量的40%以上,這將在預測期內推動對聚氨酯汽車膠合劑的需求。聚氨酯接著劑用於醫療保健產業,例如組裝醫療設備零件等應用。預計亞太地區醫療保健投資的增加將在預測期內增加對聚氨酯接著劑的需求。
建築、包裝和汽車行業的蓬勃發展可能會在未來推動聚氨酯接著劑的需求
- 2017年至2021年,亞太地區對聚氨酯接著劑的需求在所有地區中最高。由於所有終端用戶行業的生產能力都很高,該地區的黏合劑需求一直佔全球需求的 46-47%。熱熔型、水基型和溶劑型聚氨酯接著劑是該地區需求量最大的黏合劑。
- 2017年至2019年期間,該地區對黏合劑的需求複合年成長率為0.79%。聚氨酯接著劑需求放緩是由於該地區建設活動和汽車產量下降。 2018 年和 2019 年期間,這些終端用戶產業的需求分別以 -2.4% 和 -2.25% 的複合年成長率下降。
- 2020年,營運、勞動力、原料、供應鏈和其他領域的限制導致全部區域所有終端用戶產業的需求減少。在該地區所有國家的所有行業中,澳洲的製鞋業受到的打擊最為嚴重,產量較去年與前一年同期比較了49.53%。疫情期間,經濟下滑導致購買力下降,國內需求下降,嚴重影響了該產業。
- 2021年,隨著限制措施的放寬,聚氨酯接著劑的需求迅速恢復到疫情前的水準。印度的需求量增幅最高,與前一年同期比較去年同期成長73.82%。預計預測期內亞太地區的需求複合年成長率將達到 4.46%。預計預測期內,該地區的建築、包裝和汽車行業將推動需求成長。
亞太地區聚氨酯接著劑市場趨勢
開發中國家電子商務產業快速成長帶動產業擴張
- 包裝主要用於保護、容納、資訊、實用和促銷。這使得包裝成為大多數行業的重要組成部分。 2017年,包括紙、紙板和塑膠包裝在內的包裝使用量達25億噸。 2020年,受新冠疫情影響,供應鏈中斷、包裝材料短缺、貨物進出口限制、工廠開工率低等因素影響,市場出現7.4%的負成長率。
- 中國和印尼分別是第一和第二大海洋塑膠廢棄物排放,亞洲各國政府正採取措施減少塑膠的使用。中國公佈了有關過度包裝的新規定,要求所有食品和化妝品製造商遵守具體的指導方針,根據產品比例確定允許的包裝量。印尼政府的生產者延伸責任(EPR)法規要求生產者和零售商重新設計產品包裝,以增加可回收材料的比例。
- 2021年,市場實現了8%的正成長,各類包裝材料的使用量達到27億噸。由於中等收入階層的不斷壯大、供應鏈的改善以及電子商務活動的活性化,包裝行業預計將繼續成長,這些因素需要專門的包裝來運輸貨物,這在過去幾年中為包裝行業提供了巨大的推動力。預計不斷成長的亞洲市場將推動包裝的使用,預測期內(2022-2028 年)的複合年成長率將達到 5.7%。
擴大基礎設施活動的投資將擴大產業規模
- 亞太地區受中國、日本和印度等世界主要經濟體推動。中國正處於持續都市化進程中,2030年都市化率目標達到70%。都市化加快將增加都市區生活空間需求,鼓勵都市區中等收入者追求更好的居住條件,這將對住宅市場產生影響,從而增加全國的住宅建設。
- 非住宅基礎設施可能會大幅擴張。 2019年,中國政府核准了26個基礎建設計劃,總價值約1420億美元,預計2023年完工。中國擁有全球最大的建築市場,佔全球建築投資的20%。到2030年,政府計劃在建設方面投資超過13兆美元。因此,預計預測期內(2022-2028 年)建築市場的複合年成長率為 4.48%。
- 建築業是亞太地區最大的產業之一,2019 年取得了可喜的成長。由於該地區包含越南、馬來西亞、印尼、泰國和其他南亞國家等許多新興國家,該產業持續成長。然而,受新冠疫情影響,全部區域政府實施封鎖,建築業大幅下滑,嚴重影響了包括印度、中國、日本和東南亞國協在內的開發中國家。
- 亞太地區的建築業也越來越受到外國投資者的興趣。由於發展中國家為投資者提供更好的利益和機會,建築開發領域的外國直接投資(FDI)正在增加。
亞太地區聚氨酯接著劑產業概況
亞太地區聚氨酯接著劑市場較為分散,前五大公司佔11.98%的市佔率。該市場的主要企業有:3M、北京科門斯新材料、南保樹脂化工集團、Pidilite Industries Ltd.和Sika AG(按字母順序排列)。
其他福利
- Excel 格式的市場預測 (ME) 表
- 3個月的分析師支持
目錄
第1章執行摘要和主要發現
第2章 報告要約
第3章 引言
- 研究假設和市場定義
- 研究範圍
- 調查方法
第4章 產業主要趨勢
- 最終用戶趨勢
- 航太
- 車
- 建築與施工
- 鞋類和皮革
- 包裝
- 木製品和配件
- 法律規範
- 澳洲
- 中國
- 印度
- 印尼
- 日本
- 馬來西亞
- 新加坡
- 韓國
- 泰國
- 價值鍊和通路分析
第5章市場區隔
- 最終用戶產業
- 航太
- 車
- 建築與施工
- 鞋類和皮革
- 衛生保健
- 包裝
- 木製品和配件
- 其他最終用戶產業
- 科技
- 熱熔膠
- 反應性
- 溶劑型
- 紫外線固化膠合劑
- 水
- 國家
- 澳洲
- 中國
- 印度
- 印尼
- 日本
- 馬來西亞
- 新加坡
- 韓國
- 泰國
- 其他亞太地區
第6章 競爭格局
- 關鍵策略趨勢
- 市場佔有率分析
- 商業狀況
- 公司簡介.
- 3M
- Beijing Comens New Materials Co., Ltd.
- HB Fuller Company
- Henkel AG & Co. KGaA
- Hubei Huitian New Materials Co. Ltd
- Huntsman International LLC
- Kangda New Materials(Group)Co., Ltd.
- NANPAO RESINS CHEMICAL GROUP
- Pidilite Industries Ltd.
- Sika AG
第7章:CEO面臨的關鍵策略問題
第 8 章 附錄
- 全球黏合劑和密封劑產業概況
- 概述
- 五力分析框架(產業吸引力分析)
- 全球價值鏈分析
- 促進因素、阻礙因素和機會
- 資訊來源及延伸閱讀
- 圖片列表
- 關鍵見解
- 資料包
- 詞彙表
簡介目錄
Product Code: 92470
The Asia-Pacific Polyurethane Adhesives Market size is estimated at 6.18 billion USD in 2024, and is expected to reach 7.82 billion USD by 2028, growing at a CAGR of 6.07% during the forecast period (2024-2028).
Emerging automotive market in China and packaging end-use sector expected to boost the consumption of polyurethane adhesives in Asia-Pacific
- Polyurethane adhesives are widely used in the packaging industry. Polyurethane adhesives are used in food and beverage packaging, container packaging, end-of-line packaging for functional barrier applications, and metal packaging. The usage of polyurethane adhesive has been rising in packaging applications and registered growth rates of 4.76% and 2.2% in 2018 and 2019, respectively.
- The building and construction industry occupies a major share of the Asia-Pacific polyurethane adhesives market as polyurethane adhesives offer good cohesion, adhesion, and elasticity, high cohesive strength, flexibility, and a high elastic modulus of the substrate. China is the fastest-growing country in the Asia-Pacific region and is expected to register a CAGR of 5% during the period 2022 to 2028 in terms of consumption of polyurethane construction adhesives. The country recorded the highest demand for polyurethane construction adhesives owing to rising construction output, which amounted to USD 4.6 trillion in 2021, with a 10% growth over the previous year.
- Polyurethane adhesives are widely used in automotive applications. The adoption of electric four-wheelers in Asian markets will continue to be significant. In absolute terms, China is expected to become the largest EV market. On its current trajectory, China's adoption rate will approach 60%, and the country will account for more than 40% of global new EV sales by 2030, thus, boosting the demand for polyurethane automotive adhesives in the forecast period. Polyurethane adhesives are used in the healthcare industry for applications such as assembling medical device parts. The increase in healthcare investments across the Asia-Pacific region is expected to increase the demand for polyurethane adhesives in the forecast period.
Rising construction, packaging, and automotive industries likely to propel the demand for polyurethane adhesives in the future
- From 2017 to 2021, the demand for polyurethane adhesives was the highest in Asia-Pacific among all regions. The share of adhesive demand from this region has consistently occupied 46-47% of the global demand because of the region's high manufacturing capacity of all end-user industries. Polyurethane adhesives with hot melt, water-borne, and solvent-borne technologies account for the highest demand in the region.
- From 2017 to 2019, the demand for adhesives from this region recorded a CAGR of 0.79%. The slow growth in the demand for polyurethane adhesives was due to a decrease in construction activities and automotive production in the region. The demand from these end-user industries declined with a CAGR of -2.4% and -2.25% in 2018 and 2019, respectively, during this period.
- In 2020, the demand from all end-user industries across the region declined due to constraints in operations, labor, raw material, supply chain, and other areas. Among all industries across all the countries in the region, the footwear industry in Australia took the worst hit, declining by 49.53% Y-o-Y in volume terms. The decrease in domestic demand because of low purchasing power resulting from a weak economy severely affected this industry during the pandemic.
- In 2021, the demand for polyurethane adhesives quickly rebounded to the pre-pandemic demand volumes as restrictions eased. The demand from India witnessed the highest Y-o-Y growth of 73.82% in volume terms. The overall demand from the Asia-Pacific region is expected to record a CAGR of 4.46% during the forecast period. This demand growth is expected to be driven by the region's construction, packaging, and automotive industries during the forecast period.
Asia-Pacific Polyurethane Adhesives Market Trends
Fast paced growth of e-commerce industry in developing nations to augment the industry
- Packaging is mainly used for protection, containment, information, utility, and promotion. This makes packaging an integral part of most industries. In 2017, packaging usage accounted for 2.5 billion ton of packaging, including paper and paperboard and plastic packaging. In 2020, due to the COVID-19 pandemic, the market registered a negative growth rate of 7.4% due to disruptions in the supply chain, shortage of packaging material, restrictions on the import and export of goods, and factories operating at low capacity.
- Governments of different Asian countries have taken steps to reduce the use of plastic, as China and Indonesia are the first and second-largest contributors to plastic waste in the ocean. China has announced new restrictions on excessive packaging, requiring all food and cosmetics producers to adhere to specific guidelines determining the volume of packaging allowed in proportion to a product. The extended producer responsibility (EPR) regulation imposed by the Indonesian government will oblige producers and retailers to redesign their product packaging to include a higher proportion of recyclable material.
- In 2021, the market registered a positive growth of 8%, with 2.7 billion ton of packaging material used for various purposes. The packaging industry is expected to keep growing due to the rising middle-income population, improvement of supply chains, and rising e-commerce activities, which have significantly boosted the packaging industry in the past few years as special packaging is required for shipping goods. The growing Asian market is expected to boost packaging usage, enabling it to register a CAGR of 5.7% during the forecast period (2022-2028).
Raising investment to expand infrastructural activities will augment the industry size
- Asia-Pacific is driven by the world's major economies, such as China, Japan, and India. China is promoting and undergoing a process of continuous urbanization, with a target rate of 70% for 2030. The increased living spaces required in the urban areas resulting from increasing urbanization and the desire of middle-income urban residents to improve their living conditions may impact the housing market and, thereby, increase the residential constructions in the country.
- Non-residential infrastructure is likely to expand significantly. The Chinese government approved 26 infrastructure projects worth approximately USD 142 billion in 2019, with completion due in 2023. The country has the largest construction market globally, accounting for 20% of all worldwide construction investments. By 2030, the government plans to spend over USD 13 trillion on construction. Thus, the construction market is expected to register a 4.48% CAGR during the forecast period (2022-2028).
- The construction industry is one of the largest industries in Asia-Pacific and recorded promising growth in 2019. The industry continues to grow as the region constitutes many developing countries such as Vietnam, Malaysia, Indonesia, Thailand, and other South Asian countries. However, due to the COVID-19 pandemic, the construction sector witnessed a significant decline owing to lockdowns by governments across the region, which severely affected developing countries, including India, China, Japan, and ASEAN countries.
- The Asia-Pacific region is also witnessing significant interest from international investors in the construction space. Foreign Direct Investment (FDI) in the construction development sector is increasing as developing countries provide better returns and opportunities for investors.
Asia-Pacific Polyurethane Adhesives Industry Overview
The Asia-Pacific Polyurethane Adhesives Market is fragmented, with the top five companies occupying 11.98%. The major players in this market are 3M, Beijing Comens New Materials Co., Ltd., NANPAO RESINS CHEMICAL GROUP, Pidilite Industries Ltd. and Sika AG (sorted alphabetically).
Additional Benefits:
- The market estimate (ME) sheet in Excel format
- 3 months of analyst support
TABLE OF CONTENTS
1 EXECUTIVE SUMMARY & KEY FINDINGS
2 REPORT OFFERS
3 INTRODUCTION
- 3.1 Study Assumptions & Market Definition
- 3.2 Scope of the Study
- 3.3 Research Methodology
4 KEY INDUSTRY TRENDS
- 4.1 End User Trends
- 4.1.1 Aerospace
- 4.1.2 Automotive
- 4.1.3 Building and Construction
- 4.1.4 Footwear and Leather
- 4.1.5 Packaging
- 4.1.6 Woodworking and Joinery
- 4.2 Regulatory Framework
- 4.2.1 Australia
- 4.2.2 China
- 4.2.3 India
- 4.2.4 Indonesia
- 4.2.5 Japan
- 4.2.6 Malaysia
- 4.2.7 Singapore
- 4.2.8 South Korea
- 4.2.9 Thailand
- 4.3 Value Chain & Distribution Channel Analysis
5 MARKET SEGMENTATION (includes market size in Value in USD and Volume, Forecasts up to 2028 and analysis of growth prospects)
- 5.1 End User Industry
- 5.1.1 Aerospace
- 5.1.2 Automotive
- 5.1.3 Building and Construction
- 5.1.4 Footwear and Leather
- 5.1.5 Healthcare
- 5.1.6 Packaging
- 5.1.7 Woodworking and Joinery
- 5.1.8 Other End-user Industries
- 5.2 Technology
- 5.2.1 Hot Melt
- 5.2.2 Reactive
- 5.2.3 Solvent-borne
- 5.2.4 UV Cured Adhesives
- 5.2.5 Water-borne
- 5.3 Country
- 5.3.1 Australia
- 5.3.2 China
- 5.3.3 India
- 5.3.4 Indonesia
- 5.3.5 Japan
- 5.3.6 Malaysia
- 5.3.7 Singapore
- 5.3.8 South Korea
- 5.3.9 Thailand
- 5.3.10 Rest of Asia-Pacific
6 COMPETITIVE LANDSCAPE
- 6.1 Key Strategic Moves
- 6.2 Market Share Analysis
- 6.3 Company Landscape
- 6.4 Company Profiles (includes Global Level Overview, Market Level Overview, Core Business Segments, Financials, Headcount, Key Information, Market Rank, Market Share, Products and Services, and Analysis of Recent Developments).
- 6.4.1 3M
- 6.4.2 Beijing Comens New Materials Co., Ltd.
- 6.4.3 H.B. Fuller Company
- 6.4.4 Henkel AG & Co. KGaA
- 6.4.5 Hubei Huitian New Materials Co. Ltd
- 6.4.6 Huntsman International LLC
- 6.4.7 Kangda New Materials (Group) Co., Ltd.
- 6.4.8 NANPAO RESINS CHEMICAL GROUP
- 6.4.9 Pidilite Industries Ltd.
- 6.4.10 Sika AG
7 KEY STRATEGIC QUESTIONS FOR ADHESIVES AND SEALANTS CEOS
8 APPENDIX
- 8.1 Global Adhesives and Sealants Industry Overview
- 8.1.1 Overview
- 8.1.2 Porter's Five Forces Framework (Industry Attractiveness Analysis)
- 8.1.3 Global Value Chain Analysis
- 8.1.4 Drivers, Restraints, and Opportunities
- 8.2 Sources & References
- 8.3 List of Tables & Figures
- 8.4 Primary Insights
- 8.5 Data Pack
- 8.6 Glossary of Terms
02-2729-4219
+886-2-2729-4219
 聚氨酯黏合劑市場:按類型、固化機制、終端用戶產業、應用和分銷管道分類-2026-2032年全球市場預測
 全球聚氨酯接著劑市場規模、佔有率、趨勢和成長分析報告(2026-2034年)
 2026年全球聚氨酯接著劑市場報告
 電子產業用聚氨酯(PU)黏合劑:市場佔有率分析、產業趨勢與統計、成長預測(2026-2031)
 全球聚氨酯接著劑市場(按類型、技術、應用和地區分類)- 預測至 2030 年
 聚氨酯接著劑的全球市場:類別,各技術,各終端用戶業界,各地區,機會,預測,2018年~2032年歐洲聚氨酯接著劑:市場佔有率分析、產業趨勢與統計、成長預測(2025-2030)聚氨酯接著劑:市場佔有率分析、產業趨勢與統計、成長預測(2025-2030)中東和非洲聚氨酯(PU)黏合劑市場佔有率分析、產業趨勢和成長預測(2025-2030)聚氨酯接著劑和密封劑:市場佔有率分析、行業趨勢和成長預測(2025-2030 年)
▼