


 |
市場調查報告書
商品編碼
1693410
美國建築膠合劑和密封劑:市場佔有率分析、行業趨勢和統計數據、成長預測(2025-2030 年)United States Construction Adhesives & Sealants - Market Share Analysis, Industry Trends & Statistics, Growth Forecasts (2025 - 2030) |
||||||
價格
※ 本網頁內容可能與最新版本有所差異。詳細情況請與我們聯繫。
簡介目錄
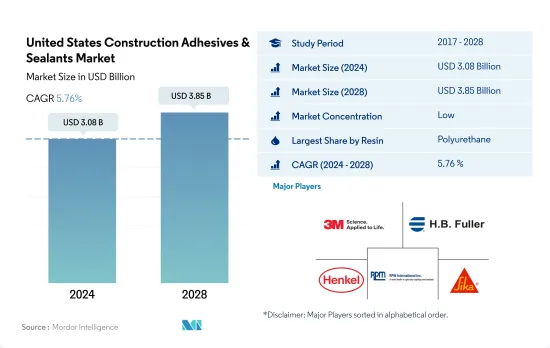
預計 2024 年美國建築膠合劑和密封劑市場規模將達到 30.8 億美元,到 2028 年將達到 38.5 億美元,預測期內(2024-2028 年)的複合年成長率為 5.76%。
預計到 2028 年,新建築面積將達到 71 億平方英尺,未來幾年對黏合劑和密封劑的需求將很高
- 樹脂賦予黏合劑必要的物理和化學特性,例如抗紫外線、耐熱性和抗張強度,使其能夠用於特定的用途。預計新建築面積將從 2021 年的 56 億平方英尺增加到 2022 年的 58 億平方英尺。
- 受經濟復甦、原料供應趨於正常化以及美國生產設施重啟(2020 年受新冠疫情影響)的推動,2021 年建築膠合劑和密封劑銷量快速成長 5.12%。疫情期間,美國各地封鎖,生產設施關閉,導致黏合劑消耗量下降。
- 這些黏合劑分為各種樹脂,其中聚氨酯和丙烯酸樹脂黏合劑廣泛用於建築應用。這些黏合劑被稱為結構性黏著劑,具有 5-8 N/mm2 範圍內的高抗張強度。此黏合劑用於黏合裝飾地板材料和瓷磚、將金屬部件封裝在混凝土中、將門框黏合到磚石上以及許多其他應用。
- 美國是建築膠合劑和密封劑消費量最高的國家,由於住宅和非住宅建築需求不斷成長,2021 年佔北美市場的近 70%。預計到 2028 年,該國的新建築面積將達到 71 億平方英尺,從而推動預測期內對建築黏合劑和密封劑的需求。
美國建築膠合劑和密封劑市場趨勢
政府投資,例如「重組美國基礎設施」(INFRA)計劃,將在 2022 年至 2026 年期間提供 72.5 億美元的資金,將促進國內建設。
- 美國是北美最大的建築業國家。該國人均GDP為25,350美元,預計到2022年將成長與前一年同期比較%。建築業占美國GDP的近4.2%。影響美國建築業的因素包括新投資、住宅和非住宅建築以及政府政策。
- 2021 年公共部門建築支出降至 3,463 億美元,而 2020 年為 3,612 億美元。然而,私部門建築支出在 2021 年有所增加,達到 12,454 億美元,而 2020 年為 11,079 億美元。
- 1 月建築許可中的住宅建築(包括私人住宅)經季節性已調整的的年率為 189.9 萬套。這比12月修訂後的188.5萬輛高出0.7%,比2021年1月的188.3萬輛高出0.8%。
- 2022年3月,美國運輸部(USDOT)宣布,重組美國基礎設施(INFRA)計畫將在2022-2026財政年度向各州和地區撥款72.5億美元,用於建設具有國家或地區重要性的多式聯運貨運和公路計劃。預計這些因素將在預測期內活性化美國的建設活動。
美國建築膠合劑和密封劑產業概況
美國建築膠合劑和密封劑市場分散,前五大公司佔34.57%的市場。該市場的主要企業有:3M、HB Fuller Company、Henkel AG & Co. KGaA、RPM International Inc. 和 Sika AG(按字母順序排列)
其他福利
- Excel 格式的市場預測 (ME) 表
- 3個月的分析師支持
目錄
第1章執行摘要和主要發現
第2章 報告要約
第3章 引言
- 研究假設和市場定義
- 研究範圍
- 調查方法
第4章 產業主要趨勢
- 最終用戶趨勢
- 建築與施工
- 法律規範
- 美國
- 價值鍊和通路分析
第5章市場區隔
- 樹脂
- 丙烯酸纖維
- 氰基丙烯酸酯
- 環氧樹脂
- 聚氨酯
- 矽膠
- VAE,EVA
- 其他樹脂
- 科技
- 熱熔膠
- 反應性
- 密封劑
- 溶劑型
- 水性
第6章 競爭格局
- 重大策略舉措
- 市場佔有率分析
- 商業狀況
- 公司簡介
- 3M
- Arkema Group
- Dow
- HB Fuller Company
- Henkel AG & Co. KGaA
- Huntsman International LLC
- Illinois Tool Works Inc.
- MAPEI SpA
- RPM International Inc.
- Sika AG
第7章:CEO面臨的關鍵策略問題
第 8 章 附錄
- 全球黏合劑和密封劑產業概況
- 概述
- 五力分析框架(產業吸引力分析)
- 全球價值鏈分析
- 促進因素、限制因素和機會
- 資訊來源及延伸閱讀
- 圖片列表
- 關鍵見解
- 資料包
- 詞彙表
簡介目錄
Product Code: 92467
The United States Construction Adhesives & Sealants Market size is estimated at 3.08 billion USD in 2024, and is expected to reach 3.85 billion USD by 2028, growing at a CAGR of 5.76% during the forecast period (2024-2028).
High demand for adhesives and sealants is expected in the coming years with new construction reaching 7.1 billion square feet by 2028
- Resins impart the required physical and chemical properties such as UV resistance, heat resistance, and tensile strength in the adhesives that can be used in specific applications. New construction is expected to grow to 5.8 billion square feet in 2022 from 5.6 billion in 2021.
- The construction adhesives and sealants recorded a sudden growth of 5.12% in volume in 2021 due to the economic recovery, regularization of raw materials supply, and reopening of production facilities in the United States, which the COVID-19 pandemic impacted in 2020. During the pandemic, lockdowns across the country caused the shutdown of production facilities and a decline in the consumption of adhesives.
- These adhesives are segmented into different resins, of which polyurethane and acrylic resin-based adhesives are widely used in construction applications. These adhesives are known as structural adhesives, which offer high tensile strength in the range of 5 to 8 N/mm2. They are used in construction to bond decorative floor coverings and ceramic tiles adhesives, seal metal parts into concrete, bond a door frame into masonry, and many other applications.
- The United States accounts for the highest consumption of construction adhesives and sealants, accounting for nearly 70% of the North American market in 2021 because of the rising demand for residential and non-residential construction. The new building and constructions in the country are expected to reach 7.1 billion square feet by 2028 and, thus, drive the demand for construction adhesives and sealants over the forecast period.
United States Construction Adhesives & Sealants Market Trends
Government's' investments such as the Infrastructure for Rebuilding America (INFRA) program of USD 7.25 billion for FY 2022-2026 to increase construction in the country
- The United States is the largest country for construction activities in the North American region. The country had a GDP of USD 25,350 per capita, with an expected growth rate of 3.7% Y-o-Y in 2022. The construction industry contributes nearly 4.2% of the US GDP. The factors affecting the US construction industry are new investments, residential & non-residential constructions, government policies, and others.
- Public sector construction spending declined in 2021, recording USD 346.3 billion compared to USD 361.2 billion in 2020. However, the private sector construction spending increased in 2021 and was valued at USD 1,245.4 billion in 2021 compared to USD 1107.9 billion in 2020.
- The residential house construction, including privately-owned housing units authorized by building permits in January, was at a seasonally adjusted annual rate of 1,899,000. This was 0.7% above the revised December rate of 1,885,000 and 0.8% above the January 2021 rate of 1,883,000.
- In March 2022, the US Department of Transportation (USDOT) announced that the Infrastructure for Rebuilding America (INFRA) program would distribute USD 7.25 billion for FY 2022-2026 to all states and regions to build multimodal freight and highway projects of national or regional significance. These factors are expected to boost construction activities in the United States over the forecast period.
United States Construction Adhesives & Sealants Industry Overview
The United States Construction Adhesives & Sealants Market is fragmented, with the top five companies occupying 34.57%. The major players in this market are 3M, H.B. Fuller Company, Henkel AG & Co. KGaA, RPM International Inc. and Sika AG (sorted alphabetically).
Additional Benefits:
- The market estimate (ME) sheet in Excel format
- 3 months of analyst support
TABLE OF CONTENTS
1 EXECUTIVE SUMMARY & KEY FINDINGS
2 REPORT OFFERS
3 INTRODUCTION
- 3.1 Study Assumptions & Market Definition
- 3.2 Scope of the Study
- 3.3 Research Methodology
4 KEY INDUSTRY TRENDS
- 4.1 End User Trends
- 4.1.1 Building and Construction
- 4.2 Regulatory Framework
- 4.2.1 United States
- 4.3 Value Chain & Distribution Channel Analysis
5 MARKET SEGMENTATION (includes market size in Value in USD and Volume, Forecasts up to 2028 and analysis of growth prospects)
- 5.1 Resin
- 5.1.1 Acrylic
- 5.1.2 Cyanoacrylate
- 5.1.3 Epoxy
- 5.1.4 Polyurethane
- 5.1.5 Silicone
- 5.1.6 VAE/EVA
- 5.1.7 Other Resins
- 5.2 Technology
- 5.2.1 Hot Melt
- 5.2.2 Reactive
- 5.2.3 Sealants
- 5.2.4 Solvent-borne
- 5.2.5 Water-borne
6 COMPETITIVE LANDSCAPE
- 6.1 Key Strategic Moves
- 6.2 Market Share Analysis
- 6.3 Company Landscape
- 6.4 Company Profiles (includes Global Level Overview, Market Level Overview, Core Business Segments, Financials, Headcount, Key Information, Market Rank, Market Share, Products and Services, and Analysis of Recent Developments).
- 6.4.1 3M
- 6.4.2 Arkema Group
- 6.4.3 Dow
- 6.4.4 H.B. Fuller Company
- 6.4.5 Henkel AG & Co. KGaA
- 6.4.6 Huntsman International LLC
- 6.4.7 Illinois Tool Works Inc.
- 6.4.8 MAPEI S.p.A.
- 6.4.9 RPM International Inc.
- 6.4.10 Sika AG
7 KEY STRATEGIC QUESTIONS FOR ADHESIVES AND SEALANTS CEOS
8 APPENDIX
- 8.1 Global Adhesives and Sealants Industry Overview
- 8.1.1 Overview
- 8.1.2 Porter's Five Forces Framework (Industry Attractiveness Analysis)
- 8.1.3 Global Value Chain Analysis
- 8.1.4 Drivers, Restraints, and Opportunities
- 8.2 Sources & References
- 8.3 List of Tables & Figures
- 8.4 Primary Insights
- 8.5 Data Pack
- 8.6 Glossary of Terms
02-2729-4219
+886-2-2729-4219
 全球建築黏合劑市場規模、佔有率、趨勢和成長分析報告(2026-2034年)
 2026年全球建築黏合劑市場報告
 建築黏合劑市場-全球產業規模、佔有率、趨勢、機會及預測(按樹脂類型、技術、最終用途產業、地區和競爭格局分類,2021-2031年)
 地板黏合劑市場按類型、形態、基材、應用方法、包裝、最終用途和通路分類-2026-2032年全球預測
 建築密封膠市場規模、佔有率和成長分析(按樹脂類型、技術、功能、應用、最終用途產業和地區分類)-產業預測,2026-2033年
 建築黏合劑市場規模、佔有率和成長分析(按類型、應用和地區分類)—2026-2033年產業預測建築密封膠市場按產品類型、應用、最終用途和技術分類-2025-2032年全球預測建築膠合劑市場(按產品類型和應用)-全球預測,2025-2032全球建築膠合劑和密封劑市場(2024-2031)
 建設用黏劑市場,規模,佔有率,產業分析報告:類別樹脂,各技術,各用途,各地區,2025年~2034年的市場預測
▼