


 |
市場調查報告書
商品編碼
1913364
電動巴士市場機會、成長要素、產業趨勢分析及預測(2026-2035年)Electric Bus Market Opportunity, Growth Drivers, Industry Trend Analysis, and Forecast 2026 - 2035 |
||||||
全球電動巴士市場預計到 2025 年價值 541 億美元,到 2035 年將達到 2,551 億美元,年複合成長率為 16.5%。
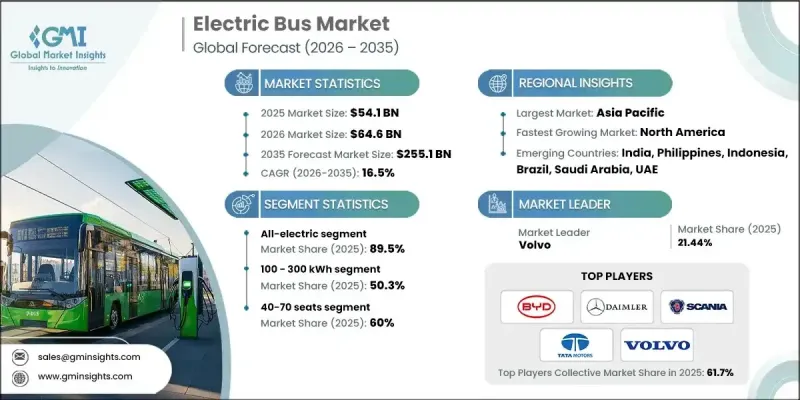
隨著公共交通系統快速向電動出行轉型,以支持更清潔的城市和更有效率的運營,市場也迅速發展。如今,電動公車配備了先進的電池系統、最佳化的電動動力系統、智慧能源管理和高效的熱控制,從而降低了營運成本並提高了服務可靠性。交通管理部門正在引入這些車輛,以降低燃料和維護成本、減少排放氣體、提高乘客舒適度,同時實現老舊車隊的現代化。政策主導的脫碳、改善空氣品質和永續城市發展舉措,正直接加速電動公車的普及。對充電基礎設施、車輛數位化和營運分析的大量投資,使營運商能夠最大限度地延長運作並最佳化路線規劃。隨著電氣化減少對傳統燃料的依賴,電動公車正日益被視為改善城際和市內交通網路環境績效和經濟穩定性的長期解決方案。
| 市場覆蓋範圍 | |
|---|---|
| 開始年份 | 2025 |
| 預測年份 | 2026-2035 |
| 起始值 | 541億美元 |
| 預測金額 | 2551億美元 |
| 複合年成長率 | 16.5% |
預計到2025年,純電動車市佔率將達到89.5%,並在2035年之前以16.2%的複合年成長率成長。該細分市場之所以佔據領先地位,主要得益於其零排放營運、較低的機械複雜性以及強而有力的監管支持。與替代動力技術相比,純電動公車擁有更低的生命週期擁有成本,同時符合排放目標,因此更受運輸業者的青睞。
預計到2025年,100-300千瓦時電池容量範圍將佔據50.3%的市場佔有率,並在2026年至2035年間以16.6%的複合年成長率成長。此容量範圍的電池因其在續航里程、充電效率和車輛重量方面的出色平衡而被廣泛採用。此容量範圍的公車能夠滿足日常線路營運需求,無需頻繁充電中斷,從而幫助營運商維持穩定的班次並控制營運成本。
預計2025年,中國電動公車市場規模將達到210.8億美元,市佔率將達65.5%。這一市場主導地位得益於強力的政策支持、長期的車輛電氣化規劃以及傳統公車被電動公車廣泛替代。對公共交通現代化建設的持續投入,也使得電動公車在大都會圈和區域交通網路中維持了較高的普及率。
目錄
第1章調查方法
第2章執行摘要
第3章業界考察
- 生態系分析
- 供應商情況
- 利潤率分析
- 成本結構
- 每個階段的附加價值
- 影響價值鏈的因素
- 中斷
- 產業影響因素
- 促進要素
- 政府加大對零排放公共交通的強制性要求
- 公共資金和補貼大幅增加,用於發展電動巴士
- 人們日益關注都市區空氣質量,並加強永續性目標。
- 與柴油巴士相比,消費者對總擁有成本較低的電動巴士的需求日益成長。
- 電池能量密度與動力傳動系統效率的進步
- 產業潛在風險與挑戰
- 電動公車和充電基礎設施的前期成本很高
- 發展中地區充電基礎設施及電網容量不足
- 市場機遇
- 新興經濟體電動公車的普及率不斷提高
- 擴大城際和長途公車路線的電氣化規模
- 電池更換和能源即服務 (EaaS)經營模式的興起
- 促進將電動公車融入智慧城市計劃
- 促進要素
- 成長潛力分析
- 監管環境
- 北美洲
- 美國聯邦電氣化獎勵和基礎設施資金籌措
- 歐洲
- 德國:《電動車法案》(EmoG)
- 英國:零排放公車資金籌措計劃
- 法國:流動性導向法(LOM 法)
- 義大利:國家能源與氣候計畫(PNIEC)
- 亞太地區
- 中國:新能源汽車(NEV)強制政策
- 印度:FAME II 電動公車補貼計劃
- 日本:國家電動車/燃料電池車引進藍圖
- 澳洲:各州零排放公車目標
- 拉丁美洲
- 巴西:國家電動車政策(PNME)
- 墨西哥:零排放都市區公共交通計劃
- 阿根廷:各州清潔交通法規
- 中東和非洲
- 阿拉伯聯合大公國:電動車充電與清潔交通法規
- 沙烏地阿拉伯:2030願景電動車交通框架
- 南非:綠色交通戰略
- 北美洲
- 波特五力分析
- PESTEL 分析
- 科技與創新趨勢
- 當前技術趨勢
- 新興技術
- 專利分析
- 定價分析
- 按地區
- 透過推進力
- 生產統計
- 生產基地
- 消費基礎
- 出口和進口
- 成本細分分析
- 車輛成本
- 營運成本
- 總擁有成本 (TCO)
- 充電基礎設施成本
- 安裝和運作成本
- 研發費用
- 永續性和環境影響分析
- 永續實踐
- 減少廢棄物策略
- 生產中的能源效率
- 環保舉措
- 碳足跡考量
- 未來前景與機遇
- 技術藍圖和演進時間表
- 新的申請機會
- 投資需求和資金籌措來源
- 風險評估與緩解
- 給市場參與企業的策略建議
第4章 競爭情勢
- 介紹
- 公司市佔率分析
- 主要市場公司的競爭分析
- 競爭定位矩陣
- 戰略展望矩陣
- 重大進展
- 併購
- 夥伴關係與合作
- 新產品發布
- 企業擴張計畫和資金籌措
第5章 依推進方式分類的市場估計與預測,2022-2035年
- 全電動
- PHEV
- 燃料電池汽車(FCEV)
第6章 依座位容量分類的市場估算與預測,2022-2035年
- 不到40個座位
- 40-70
- 70個或更多座位
第7章 按服務分類的市場估計與預測,2022-2035年
- 城際
- 城市
8. 按所有權類型分類的市場估算與預測,2022-2035 年
- 政府
- 本公司自有車輛
- 租賃和出租
- 叫車服務供應商
- 其他
第9章 依充電基礎設施分類的市場估算與預測,2022-2035年
- 公共充電網路
- 私人的
- 混合
第10章 依電池容量分類的市場估計與預測,2022-2035年
- 小於100度
- 100至300千瓦時
- 超過300度
第11章 2022-2035年各地區市場估計與預測
- 北美洲
- 美國
- 加拿大
- 歐洲
- 德國
- 英國
- 法國
- 義大利
- 西班牙
- 俄羅斯
- 北歐國家
- 亞太地區
- 中國
- 印度
- 日本
- 澳洲
- 韓國
- 菲律賓
- 印尼
- 拉丁美洲
- 巴西
- 墨西哥
- 阿根廷
- 中東和非洲
- 南非
- 沙烏地阿拉伯
- 阿拉伯聯合大公國
第12章:公司簡介
- 世界公司
- BYD
- Daimler
- Geely Automobile Holdings
- IVECO
- MAN Bus
- NFI
- Scania
- Tata Motors
- Volvo
- Zhengzhou Yutong Bus
- 本地製造商
- Beiqi Foton Motor
- Ebusco
- Irizar
- King Long United Automotive
- Solaris Bus &Coach
- VDL Bus &Coach
- Xiamen Golden Dragon Bus
- 新興製造商
- Anhui Ankai Automobile.
- Proterra
- Zhongtong Bus
The Global Electric Bus Market was valued at USD 54.1 billion in 2025 and is estimated to grow at a CAGR of 16.5% to reach USD 255.1 billion by 2035.
The market is evolving rapidly as public transportation systems increasingly shift toward electrified mobility to support cleaner cities and more efficient transit operations. Electric buses are now designed with advanced battery systems, optimized electric drivetrains, intelligent energy management, and efficient thermal controls that enable lower operating expenses and improved service reliability. Transit authorities are adopting these vehicles to cut fuel and maintenance costs, lower emissions, and enhance rider comfort while modernizing aging fleets. Policy-driven commitments to decarbonization, air quality improvement, and sustainable urban development are directly accelerating electric bus adoption. Large-scale investments in charging infrastructure, fleet digitization, and operational analytics are allowing operators to maximize uptime and improve route planning. As electrification reduces dependence on conventional fuels, electric buses are increasingly viewed as a long-term solution that improves both environmental performance and economic stability across urban and intercity transport networks.
| Market Scope | |
|---|---|
| Start Year | 2025 |
| Forecast Year | 2026-2035 |
| Start Value | $54.1 Billion |
| Forecast Value | $255.1 Billion |
| CAGR | 16.5% |
The all-electric category represented 89.5% share in 2025 and is forecast to grow at a CAGR of 16.2% through 2035. This segment leads the market due to its zero-emission operation, reduced mechanical complexity, and strong regulatory backing. Transit operators favor fully electric buses as they align with emission reduction targets while offering lower lifetime ownership costs compared to alternative propulsion technologies.
The 100-300 kWh battery capacity range accounted for 50.3% share in 2025 and is expected to expand at a CAGR of 16.6% between 2026 and 2035. This battery class is widely adopted because it offers an effective balance between driving range, charging efficiency, and vehicle weight. Buses in this range support daily route requirements without excessive charging interruptions, helping operators maintain consistent schedules and control operational costs.
China Electric Bus Market held 65.5% share and generated USD 21.08 billion during 2025. Market leadership is supported by strong policy alignment, long-term fleet electrification programs, and widespread replacement of conventional buses with electric alternatives. Continuous investment in public transport modernization has sustained high deployment levels across metropolitan and regional networks.
Key companies operating in the Global Electric Bus Market include BYD, Solaris Bus & Coach, Tata Motors, Volvo, Zhongtong Bus, Proterra, Daimler, NFI Group, Scania, and MAN Bus. Companies in the Global Electric Bus Market are strengthening their competitive position through technology innovation, capacity expansion, and strategic partnerships. Manufacturers are investing heavily in battery efficiency improvements, modular vehicle platforms, and software-enabled fleet management solutions to enhance performance and reliability. Localization of manufacturing and supply chains is being used to reduce costs and meet regional procurement requirements. Firms are also offering comprehensive service packages that include maintenance support, charging solutions, and lifecycle management to build long-term customer relationships. Collaboration with transit authorities and infrastructure providers is enabling smoother deployment, while continuous product upgrades help address evolving regulatory and operational expectations across global markets.
Table of Contents
Chapter 1 Methodology
- 1.1 Research approach
- 1.2 Quality commitments
- 1.2.1 GMI AI policy & data integrity commitment
- 1.3 Research trail & confidence scoring
- 1.3.1 Research trail components
- 1.3.2 Scoring components
- 1.4 Data collection
- 1.4.1 Partial list of primary sources
- 1.5 Data mining sources
- 1.5.1 Paid sources
- 1.6 Base estimates and calculations
- 1.6.1 Base year calculation
- 1.7 Forecast model
- 1.8 Research transparency addendum
Chapter 2 Executive Summary
- 2.1 Industry 3600 synopsis, 2022 - 2035
- 2.2 Key market trends
- 2.2.1 Regional
- 2.2.2 Propulsion
- 2.2.3 Battery capacity
- 2.2.4 Seating capacity
- 2.2.5 Service
- 2.2.6 Fleet ownership
- 2.2.7 Charging infrastructure
- 2.3 TAM Analysis, 2026-2035
- 2.4 CXO perspectives: Strategic imperatives
- 2.4.1 Executive decision points
- 2.4.2 Critical success factors
- 2.5 Future outlook and strategic recommendations
Chapter 3 Industry Insights
- 3.1 Industry ecosystem analysis
- 3.1.1 Supplier landscape
- 3.1.2 Profit margin analysis
- 3.1.3 Cost structure
- 3.1.4 Value addition at each stage
- 3.1.5 Factor affecting the value chain
- 3.1.6 Disruptions
- 3.2 Industry impact forces
- 3.2.1 Growth drivers
- 3.2.1.1 Rise in government mandates for zero-emission public transportation
- 3.2.1.2 Surge in public funding and subsidies for electric bus procurement
- 3.2.1.3 Increase in urban air-quality concerns and sustainability targets
- 3.2.1.4 Growth in demand for lower total cost of ownership compared to diesel buses
- 3.2.1.5 Advancements in battery energy density and powertrain efficiency
- 3.2.2 Industry pitfalls and challenges
- 3.2.2.1 High upfront cost of electric buses and charging infrastructure
- 3.2.2.2 Limited charging infrastructure and grid capacity in developing regions
- 3.2.3 Market opportunities
- 3.2.3.1 Expansion of electric bus adoption in emerging economies
- 3.2.3.2 Growth in electrification of intercity and long-distance bus routes
- 3.2.3.3 Rise in battery swapping and energy-as-a-service business models
- 3.2.3.4 Increasing integration of electric buses into smart city initiatives
- 3.2.1 Growth drivers
- 3.3 Growth potential analysis
- 3.4 Regulatory landscape
- 3.4.1 North America
- 3.4.1.1 US Federal Electrification Incentives & Infrastructure Funding.
- 3.4.2 Europe
- 3.4.2.1 Germany: Electric Mobility Act (EmoG)
- 3.4.2.2 UK: Zero-Emission Bus Funding Programs
- 3.4.2.3 France: Mobility Orientation Law (LOM Act)
- 3.4.2.4 Italy: National Energy & Climate Plan (PNIEC)
- 3.4.3 Asia Pacific
- 3.4.3.1 China: New Energy Vehicle (NEV) Mandate
- 3.4.3.2 India: FAME II Electric Bus Incentives
- 3.4.3.3 Japan: National EV & FCV Deployment Roadmap
- 3.4.3.4 Australia: State-Level Zero-Emission Bus Targets
- 3.4.4 Latin America
- 3.4.4.1 Brazil: National Electric Mobility Policy (PNME)
- 3.4.4.2 Mexico: Urban Zero-Emission Public Transport Programs
- 3.4.4.3 Argentina: Provincial Clean Mobility Regulations
- 3.4.5 MEA
- 3.4.5.1 UAE: EV Charging & Clean Transport Regulations
- 3.4.5.2 Saudi Arabia: Vision 2030 EV Transport Framework
- 3.4.5.3 South Africa: Green Transport Strategy
- 3.4.1 North America
- 3.5 Porter's analysis
- 3.6 PESTEL analysis
- 3.7 Technology and Innovation landscape
- 3.7.1 Current technological trends
- 3.7.2 Emerging technologies
- 3.8 Patent analysis
- 3.9 Pricing Analysis
- 3.9.1 By region
- 3.9.2 By propulsion
- 3.10 Production statistics
- 3.10.1 Production hubs
- 3.10.2 Consumption hubs
- 3.10.3 Export and import
- 3.11 Cost breakdown analysis
- 3.11.1 Vehicle Cost
- 3.11.2 Operational Cost
- 3.11.3 Total cost of ownership (TCO)
- 3.11.4 Charging Infrastructure Cost
- 3.11.5 Installation & activation costs
- 3.11.6 Research & development costs
- 3.12 Sustainability and environmental impact analysis
- 3.12.1 Sustainable practices
- 3.12.2 Waste reduction strategies
- 3.12.3 Energy efficiency in production
- 3.12.4 Eco-friendly initiatives
- 3.12.5 Carbon footprint considerations
- 3.13 Future outlook & opportunities
- 3.13.1 Technology roadmap & evolution timeline
- 3.13.2 Emerging application opportunities
- 3.13.3 Investment requirements & funding sources
- 3.13.4 Risk assessment & mitigation strategies
- 3.13.5 Strategic recommendations for market participants
Chapter 4 Competitive Landscape, 2025
- 4.1 Introduction
- 4.2 Company market share analysis
- 4.2.1 North America
- 4.2.2 Europe
- 4.2.3 Asia Pacific
- 4.2.4 Latin America
- 4.2.5 MEA
- 4.3 Competitive analysis of major market players
- 4.4 Competitive positioning matrix
- 4.5 Strategic outlook matrix
- 4.6 Key developments
- 4.6.1 Mergers & acquisitions
- 4.6.2 Partnerships & collaborations
- 4.6.3 New Product Launches
- 4.6.4 Expansion Plans and funding
Chapter 5 Market Estimates & Forecast, By Propulsion, 2022 - 2035 ($Bn, Units)
- 5.1 Key trends
- 5.2 All-electric
- 5.3 PHEV
- 5.4 FCEV
Chapter 6 Market Estimates & Forecast, By Seating Capacity, 2022 - 2035 ($Bn, Units)
- 6.1 Key trends
- 6.2 Below 40
- 6.3 40-70
- 6.4 Above 70
Chapter 7 Market Estimates & Forecast, By Service, 2022 - 2035 ($Bn, Units)
- 7.1 Key trends
- 7.2 Intercity
- 7.3 Intracity
Chapter 8 Market Estimates & Forecast, By Fleet Ownership, 2022 - 2035 ($Bn, Units)
- 8.1 Key trends
- 8.2 Government
- 8.3 Private Fleet
- 8.4 Leasing & Rental
- 8.5 Ride-hailing Operator
- 8.6 Others
Chapter 9 Market Estimates & Forecast, By Charging Infrastructure, 2022 - 2035 ($Bn, Units)
- 9.1 Key trends
- 9.2 Public Charging Network
- 9.3 Private
- 9.4 Hybrid
Chapter 10 Market Estimates & Forecast, By Battery Capacity, 2022 - 2035 ($Bn, Units)
- 10.1 Key trends
- 10.2 Below 100 kWh
- 10.3 100-300 kWh
- 10.4 Above 300 kWh
Chapter 11 Market Estimates & Forecast, By Region, 2022 - 2035 ($Bn, Units)
- 11.1 Key trends
- 11.2 North America
- 11.2.1 US
- 11.2.2 Canada
- 11.3 Europe
- 11.3.1 Germany
- 11.3.2 UK
- 11.3.3 France
- 11.3.4 Italy
- 11.3.5 Spain
- 11.3.6 Russia
- 11.3.7 Nordics
- 11.4 Asia Pacific
- 11.4.1 China
- 11.4.2 India
- 11.4.3 Japan
- 11.4.4 Australia
- 11.4.5 South Korea
- 11.4.6 Philippines
- 11.4.7 Indonesia
- 11.5 Latin America
- 11.5.1 Brazil
- 11.5.2 Mexico
- 11.5.3 Argentina
- 11.6 MEA
- 11.6.1 South Africa
- 11.6.2 Saudi Arabia
- 11.6.3 UAE
Chapter 12 Company Profiles
- 12.1 Global Players
- 12.1.1 BYD
- 12.1.2 Daimler
- 12.1.3 Geely Automobile Holdings
- 12.1.4 IVECO
- 12.1.5 MAN Bus
- 12.1.6 NFI
- 12.1.7 Scania
- 12.1.8 Tata Motors
- 12.1.9 Volvo
- 12.1.10 Zhengzhou Yutong Bus
- 12.2 Regional Players
- 12.2.1 Beiqi Foton Motor
- 12.2.2 Ebusco
- 12.2.3 Irizar
- 12.2.4 King Long United Automotive
- 12.2.5 Solaris Bus & Coach
- 12.2.6 VDL Bus & Coach
- 12.2.7 Xiamen Golden Dragon Bus
- 12.3 Emerging Players
- 12.3.1 Anhui Ankai Automobile.
- 12.3.2 Proterra
- 12.3.3 Zhongtong Bus
 電動巴士市場-全球產業規模、佔有率、趨勢、機會與預測:按電池類型、應用、巴士長度、座位容量、地區和競爭格局分類,2021-2031年
 公共交通電氣化市場預測至2034年:按車輛類型、充電基礎設施、技術和區域分類的全球分析
 電動微型巴士市場:按動力系統、座位數、續航里程、電池容量和應用分類-2026-2032年全球市場預測電動校車市場:依推進系統、車身長度、電池容量和最終用戶分類-2026-2032年全球市場預測電動巴士市場:2026-2032年全球市場預測(按推進系統、底盤類型、座位數、續航里程、應用程式和最終用戶分類)
 2026年全球中大型(9-14公尺)電動客車市場報告2026年全球電動巴士市場報告2026年全球電動校車車輛管理市場報告學校和校園的電動出行解決方案市場預測(至2034年):按車輛類型、電池容量、驅動系統、乘客容量、應用和地區分類的全球分析電動接駁車和校園交通網路市場預測至2034年-全球分析(按組件、自動駕駛等級、推進方式、應用、最終用戶和地區分類)