


 |
市場調查報告書
商品編碼
1892692
電動巴士系統市場機會、成長促進因素、產業趨勢分析及預測(2025-2034年)Electric Bus System Market Opportunity, Growth Drivers, Industry Trend Analysis, and Forecast 2025 - 2034 |
||||||
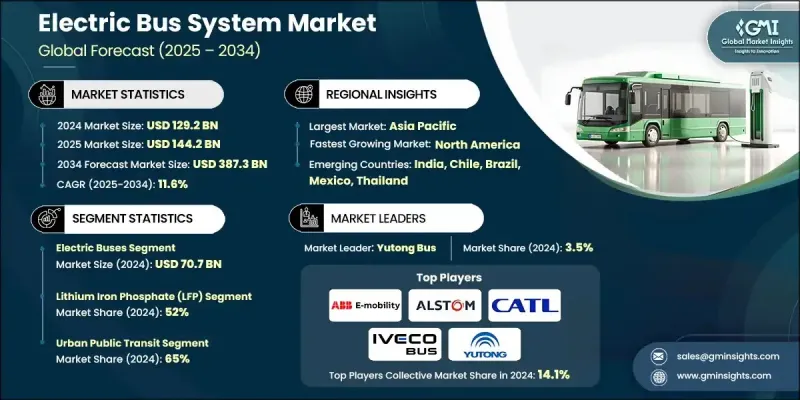
2024 年全球電動巴士系統市場價值為 1,292 億美元,預計到 2034 年將以 11.6% 的複合年成長率成長至 3,873 億美元。
全球政府大力推廣零排放公共交通的措施推動了市場成長。諸如撥款、稅收優惠和補貼等政策鼓勵地方政府和公車機構將現有車隊升級為電動公車,同時擴大必要的充電基礎設施。鋰離子電池成本的下降和能量密度的提高降低了車輛營運成本並增加了續航里程,使電動公車能夠更有效地與柴油公車競爭。城市化、永續發展目標和空氣品質改善措施推動了公車走廊、快速公車系統 (BRT) 和車輛段基礎設施的電氣化發展。協調一致的部署策略有助於公車部門在實現環境目標的同時最大限度地提高效率,從而進一步促進市場擴張。
| 市場範圍 | |
|---|---|
| 起始年份 | 2024 |
| 預測年份 | 2025-2034 |
| 起始值 | 1292億美元 |
| 預測值 | 3873億美元 |
| 複合年成長率 | 11.6% |
2024年,電動巴士市場規模達到707億美元,預計2025年至2034年將以9.7%的複合年成長率成長。電池成本下降、續航里程延長以及政府激勵措施是推動純電動巴士廣泛普及的主要因素。公車機構正日益重視車隊電氣化,這需要更大容量的電池以及與智慧電網系統的整合,以實現快速充電。
2024年,磷酸鐵鋰(LFP)電池市佔率達到52%,預計2025年至2034年將以12.7%的複合年成長率成長。 LFP電池因其循環壽命長、熱穩定性好和成本效益高等優點而備受青睞。許多製造商,尤其是在亞洲和歐洲,正在為包括標準型和鉸接式公車在內的所有類型公車配備LFP電池。諸如電芯到電池包(CTP)結構等創新技術提高了能量密度、安全性和循環壽命,使其成為大規模公共交通營運的理想選擇。
到2034年,美國電動巴士系統市佔率將成長至86%。包括兩黨基礎設施法案和低排放/零排放巴士計劃在內的聯邦項目正在加速車隊轉型。隨著公車機構投資於車輛段升級、員工培訓和新型電動巴士,美國製造商也受惠於「購買美國貨」條款,從而加強了電池、充電器和電力電子產品的國內供應鏈。
目錄
第1章:方法論
第2章:執行概要
第3章:行業洞察
- 產業生態系分析
- 供應商格局
- 利潤率分析
- 成本結構
- 每個階段的價值增加
- 影響價值鏈的因素
- 中斷
- 產業影響因素
- 成長促進因素
- 政府車隊電氣化強制令
- 電池成本下降和能量密度提高
- 城市交通電氣化計畫的擴展
- 燃料電池公車氫基礎設施的發展
- OEM及技術創新
- 產業陷阱與挑戰
- 高昂的前期車輛和基礎設施成本
- 電網容量和基礎設施限制
- 市場機遇
- 智慧充電與能源管理的整合
- 電池二次利用和回收計劃
- 拓展至城際及長途客車服務
- 公私部門合作與國際融資
- 成長促進因素
- 成長潛力分析
- 監管環境
- 波特的分析
- PESTEL 分析
- 技術與創新格局
- 目前技術
- 新興技術
- 專利分析
- 定價分析
- 按地區
- 依產品
- 成本細分分析
- 電池供應鏈脆弱性與礦物來源
- 全球電池供應鏈結構
- 關鍵礦物依賴性
- 供應鏈中斷情景
- 供應鏈緩解策略
- 物流和交貨時間
- 總擁有成本 (TCO) 建模和融資機制
- TCO框架及方法論
- 總擁有成本比較:電動巴士與柴油/CNG巴士
- 電池組成本走勢
- 充電基礎設施經濟學
- 融資機制與資本結構
- 充電基礎設施部署的經濟性和互通性
- 按收費策略分類的基礎建設投資需求
- 併網及公用事業費用
- 充電互通性挑戰
- 智慧充電與負載管理經濟性
- 充電網路商業模式
- 電池衰減、保固管理和生命週期經濟學
- 實際效能退化資料及表現
- 電池保固結構及條款
- 電池更換經濟學
- 客戶採納障礙與採購模式創新
- 技術採納障礙
- 經濟性採納障礙
- 組織和營運障礙
- 基礎設施和電網障礙
- 採購模式創新以克服障礙
- 風險緩解策略
第4章:競爭格局
- 介紹
- 公司市佔率分析
- 北美洲
- 歐洲
- 亞太地區
- 拉丁美洲
- MEA
- 主要市場參與者的競爭分析
- 競爭定位矩陣
- 戰略展望矩陣
- 重要新聞和舉措
- 併購
- 合作夥伴關係與合作
- 新產品發布
- 擴張計劃和資金
第5章:市場估算與預測:依組件分類,2021-2034年
- 電動巴士
- 電池電動巴士(BEB)
- 插電式混合動力電動巴士(PHEV)
- 燃料電池電動巴士(FCEB)
- 無軌電車
- 充電方式
- 充電站充電
- 機會收費
- 受電弓充電
- 能源供應與電網整合
- 車隊及營運管理
- 維護與支援系統
第6章:市場估計與預測:依電池化學類型分類,2021-2034年
- 磷酸鐵鋰(LFP)
- 鎳錳鈷(NMC)
- 鎳鈷鋁(NCA)
- 鈦酸鋰(LTO)
- 固態電池
- 其他
第7章:市場估計與預測:依應用領域分類,2021-2034年
- 城市大眾運輸
- 城際和區域交通
- 校園及機場接駁車
- 企業及工業接駁車
- 其他
第8章:市場估算與預測:依地區分類,2021-2034年
- 北美洲
- 美國
- 加拿大
- 歐洲
- 德國
- 英國
- 法國
- 義大利
- 西班牙
- 北歐
- 荷蘭
- 俄羅斯
- 亞太地區
- 中國
- 印度
- 日本
- 澳新銀行
- 新加坡
- 泰國
- 越南
- 韓國
- 拉丁美洲
- 巴西
- 墨西哥
- 阿根廷
- MEA
- 南非
- 沙烏地阿拉伯
- 阿拉伯聯合大公國
第9章:公司簡介
- 全球參與者
- ABB E-Mobility
- Alstom
- BYD Company
- CATL (Contemporary Amperex Technology)
- Daimler Buses (Mercedes-Benz / Thomas Built Buses)
- IVECO Bus
- NFI Group (New Flyer Industries)
- Proterra
- Scania (TRATON)
- Siemens Smart Infrastructure
- Volvo Buses (Volvo)
- Yutong Bus
- 區域玩家
- Blue Bird
- Gillig
- Karsan
- King Long United Automotive Industry
- Lion Electric Company
- Motor Coach Industries (MCI)
- Solaris Bus & Coach
- Tata Motors
- VDL Bus & Coach
- Zhongtong Bus
- 新興參與者和顛覆者
- Arrival
- CaetanoBus
- Ebusco
- Forsee Power
- GreenPower Motor Company
- Lightning eMotors
- Microvast
- Phoenix Motor
- RIDE
- Vicinity Motor
The Global Electric Bus System Market was valued at USD 129.2 billion in 2024 and is estimated to grow at a CAGR of 11.6% to reach USD 387.3 billion by 2034.
The market growth is driven by global government initiatives promoting zero-emission public transit. Policies such as grants, tax incentives, and subsidies are encouraging local governments and transit agencies to upgrade their existing fleets to electric buses while expanding the necessary charging infrastructure. Falling lithium-ion battery costs and improved energy density are reducing vehicle expenses and increasing operational range, allowing electric buses to compete more effectively with diesel alternatives. The growing trend toward electrified bus corridors, bus rapid transit (BRT) systems, and depot infrastructure is fueled by urbanization, sustainability goals, and air quality initiatives. Coordinated deployment strategies help transit authorities maximize efficiency while meeting environmental targets, further supporting market expansion.
| Market Scope | |
|---|---|
| Start Year | 2024 |
| Forecast Year | 2025-2034 |
| Start Value | $129.2 Billion |
| Forecast Value | $387.3 Billion |
| CAGR | 11.6% |
The electric buses segment generated USD 70.7 billion in 2024 and is expected to grow at a CAGR of 9.7% from 2025 to 2034. The widespread adoption of battery-electric buses is being driven by declining battery costs, extended driving ranges, and government incentives. Transit agencies are increasingly focusing on fleet electrification, which necessitates higher-capacity batteries and integration with smart grid systems for rapid charging.
The lithium iron phosphate (LFP) batteries segment held a 52% share in 2024 and is projected to grow at a CAGR of 12.7% from 2025 to 2034. LFP batteries are favored for their long lifecycle, thermal stability, and cost efficiency. Many manufacturers, especially in Asia and Europe, are equipping all bus types, including standard and articulated models, with LFP batteries. Innovations such as cell-to-pack (CTP) structures enhance energy density, safety, and lifecycle performance, making them ideal for large-scale transit operations.
U.S. Electric Bus System Market will grow at an 86% share by 2034. Federal programs, including the Bipartisan Infrastructure Law and Low-No Emission Bus Program, are accelerating fleet transitions. As transit agencies invest in depot upgrades, workforce training, and new electric buses, U.S. manufacturers benefit from the "Buy America" provisions, strengthening domestic supply chains for batteries, chargers, and power electronics.
Key players in the Global Electric Bus System Market include ABB E-Mobility, Alstom, CATL, Forsee Power, IVECO Bus, NFI, RIDE, Siemens Smart Infrastructure, Solaris Bus & Coach, and Yutong Bus. Companies in the Global Electric Bus System Market are employing several strategies to reinforce their market position. They are investing heavily in R&D to enhance battery efficiency, increase vehicle range, and integrate smart charging solutions. Strategic partnerships with local transit authorities and global suppliers enable faster deployment of electric fleets and infrastructure. Manufacturers are focusing on modular and scalable designs to accommodate various city sizes and route requirements. Expansion into emerging markets and establishing regional production facilities reduces costs and improves delivery timelines. Companies are also leveraging government incentives and aligning with sustainability goals to strengthen brand credibility, while advanced maintenance and service programs ensure long-term operational efficiency and customer retention.
Table of Contents
Chapter 1 Methodology
- 1.1 Market scope and definition
- 1.2 Research design
- 1.2.1 Research approach
- 1.2.2 Data collection methods
- 1.3 Data mining sources
- 1.3.1 Global
- 1.3.2 Regional/Country
- 1.4 Base estimates and calculations
- 1.4.1 Base year calculation
- 1.4.2 Key trends for market estimation
- 1.5 Primary research and validation
- 1.5.1 Primary sources
- 1.6 Forecast
- 1.7 Research assumptions and limitations
Chapter 2 Executive Summary
- 2.1 Industry 360° synopsis, 2021 - 2034
- 2.2 Key market trends
- 2.2.1 Component
- 2.2.2 Battery Chemistry
- 2.2.3 Application
- 2.2.4 Region
- 2.3 TAM Analysis, 2026-2034
- 2.4 CXO perspectives: Strategic imperatives
- 2.4.1 Executive decision points
- 2.4.2 Critical success factors
- 2.5 Future outlook and strategic recommendations
Chapter 3 Industry Insights
- 3.1 Industry ecosystem analysis
- 3.1.1 Supplier landscape
- 3.1.2 Profit margin analysis
- 3.1.3 Cost structure
- 3.1.4 Value addition at each stage
- 3.1.5 Factor affecting the value chain
- 3.1.6 Disruptions
- 3.2 Industry impact forces
- 3.2.1 Growth drivers
- 3.2.1.1 Government fleet electrification mandates
- 3.2.1.2 Falling battery costs & improved energy density
- 3.2.1.3 Expansion of urban transit electrification programs
- 3.2.1.4 Growth of hydrogen infrastructure for fuel cell buses
- 3.2.1.5 OEM & technology innovations
- 3.2.2 Industry pitfalls and challenges
- 3.2.2.1 High upfront vehicle & infrastructure costs
- 3.2.2.2 Grid capacity & infrastructure limitations
- 3.2.3 Market opportunities
- 3.2.3.1 Integration of smart charging & energy management
- 3.2.3.2 Battery second-life & recycling programs
- 3.2.3.3 Expansion into intercity & coach services
- 3.2.3.4 Public-private partnerships & international funding
- 3.2.1 Growth drivers
- 3.3 Growth potential analysis
- 3.4 Regulatory landscape
- 3.4.1 North America
- 3.4.2 Europe
- 3.4.3 Asia Pacific
- 3.4.4 Latin America
- 3.4.5 Middle east and Africa
- 3.5 Porter's analysis
- 3.6 PESTEL analysis
- 3.7 Technology and Innovation landscape
- 3.7.1 Current technology
- 3.7.2 Emerging technology
- 3.8 Patent analysis
- 3.9 Pricing analysis
- 3.9.1 By region
- 3.9.2 By product
- 3.10 Cost breakdown analysis
- 3.11 Battery supply chain vulnerabilities & mineral sourcing
- 3.11.1 Global battery cell supply chain structure
- 3.11.2 Critical mineral dependencies
- 3.11.3 Supply chain disruption scenarios
- 3.11.4 Supply chain mitigation strategies
- 3.11.5 Logistics & lead times
- 3.12 Total cost of ownership (tco) modeling & financing mechanisms
- 3.12.1 Tco framework & methodology
- 3.12.2 Tco comparison: electric vs diesel/cng buses
- 3.12.3 Battery pack cost trajectory
- 3.12.4 Charging infrastructure economics
- 3.12.5 Financing mechanisms & capital structures
- 3.13 Charging infrastructure deployment economics & interoperability
- 3.13.1 Infrastructure investment requirements by charging strategy
- 3.13.2 Grid connection & utility costs
- 3.13.3 Charging interoperability challenges
- 3.13.4 Smart charging & load management economics
- 3.13.5 Charging network business models
- 3.14 Battery degradation, warranty management & lifecycle economics
- 3.14.1 Real-world degradation data & performance
- 3.14.2 Battery warranty structures & terms
- 3.14.3 Battery replacement economics
- 3.15 Customer adoption barriers & procurement model innovation
- 3.15.1 Technical adoption barriers
- 3.15.2 Economic adoption barriers
- 3.15.3 Organizational & operational barriers
- 3.15.4 Infrastructure & grid barriers
- 3.15.5 Procurement model innovations to overcome barriers
- 3.15.6 Risk mitigation strategies
Chapter 4 Competitive Landscape, 2024
- 4.1 Introduction
- 4.2 Company market share analysis
- 4.2.1 North America
- 4.2.2 Europe
- 4.2.3 Asia Pacific
- 4.2.4 LATAM
- 4.2.5 MEA
- 4.3 Competitive analysis of major market players
- 4.4 Competitive positioning matrix
- 4.5 Strategic outlook matrix
- 4.6 Key news and initiatives
- 4.6.1 Mergers & acquisitions
- 4.6.2 Partnerships & collaborations
- 4.6.3 New Product Launches
- 4.6.4 Expansion Plans and funding
Chapter 5 Market Estimates & Forecast, By Component, 2021 - 2034 ($Bn, Units)
- 5.1 Key trends
- 5.2 Electric Buses
- 5.2.1 Battery Electric Buses (BEBs)
- 5.2.2 Plug-in Hybrid Electric Buses (PHEVs)
- 5.2.3 Fuel Cell Electric Buses (FCEBs)
- 5.2.4 Trolleybuses
- 5.3 Charging Method
- 5.3.1 Depot Charging
- 5.3.2 Opportunity Charging
- 5.3.3 Pantograph Charging
- 5.4 Energy Supply & Grid Integration
- 5.5 Fleet & Operations Management
- 5.6 Maintenance & Support System
Chapter 6 Market Estimates & Forecast, By Battery Chemistry, 2021 - 2034 ($Bn, Units)
- 6.1 Key trends
- 6.2 Lithium Iron Phosphate (LFP)
- 6.3 Nickel Manganese Cobalt (NMC)
- 6.4 Nickel Cobalt Aluminum (NCA)
- 6.5 Lithium Titanate (LTO)
- 6.6 Solid-State Batteries
- 6.7 Others
Chapter 7 Market Estimates & Forecast, By Application, 2021 - 2034 ($Bn, Units)
- 7.1 Key trends
- 7.2 Urban Public Transit
- 7.3 Intercity & Regional Transport
- 7.4 Campus & Airport Shuttles
- 7.5 Corporate & Industrial Shuttles
- 7.6 Others
Chapter 8 Market Estimates & Forecast, By Region, 2021 - 2034 ($Bn, Units)
- 8.1 Key trends
- 8.2 North America
- 8.2.1 US
- 8.2.2 Canada
- 8.3 Europe
- 8.3.1 Germany
- 8.3.2 UK
- 8.3.3 France
- 8.3.4 Italy
- 8.3.5 Spain
- 8.3.6 Nordics
- 8.3.7 Netherlands
- 8.3.8 Russia
- 8.4 Asia Pacific
- 8.4.1 China
- 8.4.2 India
- 8.4.3 Japan
- 8.4.4 ANZ
- 8.4.5 Singapore
- 8.4.6 Thailand
- 8.4.7 Vietnam
- 8.4.8 South Korea
- 8.5 Latin America
- 8.5.1 Brazil
- 8.5.2 Mexico
- 8.5.3 Argentina
- 8.6 MEA
- 8.6.1 South Africa
- 8.6.2 Saudi Arabia
- 8.6.3 UAE
Chapter 9 Company Profiles
- 9.1 Global Players
- 9.1.1 ABB E-Mobility
- 9.1.2 Alstom
- 9.1.3 BYD Company
- 9.1.4 CATL (Contemporary Amperex Technology)
- 9.1.5 Daimler Buses (Mercedes-Benz / Thomas Built Buses)
- 9.1.6 IVECO Bus
- 9.1.7 NFI Group (New Flyer Industries)
- 9.1.8 Proterra
- 9.1.9 Scania (TRATON)
- 9.1.10 Siemens Smart Infrastructure
- 9.1.11 Volvo Buses (Volvo)
- 9.1.12 Yutong Bus
- 9.2 Regional Players
- 9.2.1 Blue Bird
- 9.2.2 Gillig
- 9.2.3 Karsan
- 9.2.4 King Long United Automotive Industry
- 9.2.5 Lion Electric Company
- 9.2.6 Motor Coach Industries (MCI)
- 9.2.7 Solaris Bus & Coach
- 9.2.8 Tata Motors
- 9.2.9 VDL Bus & Coach
- 9.2.10 Zhongtong Bus
- 9.3 Emerging players and disruptors
- 9.3.1 Arrival
- 9.3.2 CaetanoBus
- 9.3.3 Ebusco
- 9.3.4 Forsee Power
- 9.3.5 GreenPower Motor Company
- 9.3.6 Lightning eMotors
- 9.3.7 Microvast
- 9.3.8 Phoenix Motor
- 9.3.9 RIDE
- 9.3.10 Vicinity Motor
 電池驅動電動巴士市場:機會、成長要素、產業趨勢分析以及 2026 年至 2035 年的預測。
 歐洲電動巴士:市場佔有率分析、產業趨勢與統計、成長預測(2026-2031)
 全球電動巴士市場規模、佔有率、趨勢和成長分析報告(2026-2034年)全球電池驅動電動巴士市場規模、佔有率、趨勢和成長分析報告(2026-2034)燃料電池電動巴士全球市場規模、佔有率、趨勢和成長分析報告(2026-2034)
 日本電動巴士市場規模、佔有率、趨勢及預測(按動力方式、電池類型、車身長度、續航里程、電池容量和地區分類,2026-2034年)
 全球電動巴士市場:依電池類型、動力系統、應用、巴士尺寸、車身類型、充電方式、電池容量和地區劃分 - 市場規模、市場動態、主要參與者、機會分析和預測(2026-2035年)
 全球電動鉸接式城市公車市場:按推進技術、電池化學成分、充電方式、車輛長度和最終用戶分類的預測(2026-2032年)按動力來源、傳動方式、鉸接長度、車門配置、應用和最終用戶分類的鉸接式城市公車市場,全球預測,2026-2032年按動力類型、車輛類型、服務類型、購買類型和最終用戶分類的學前校車市場-全球預測(2026-2032 年)