

 |
市場調查報告書
商品編碼
1892766
智慧票務市場機會、成長促進因素、產業趨勢分析及預測(2026-2035年)Smart Ticketing Market Opportunity, Growth Drivers, Industry Trend Analysis, and Forecast 2026 - 2035 |
||||||
2025 年全球智慧票務市場價值為 117 億美元,預計到 2035 年將以 13.1% 的複合年成長率成長至 396 億美元。
全球向數位化和非接觸式支付生態系統的轉型正在推動市場成長。旅客越來越傾向於快速便利的支付體驗,無需實體車票和現金交易。交通管理部門和公共機構積極支持數位化票務系統,以提高營運效率、減少交易摩擦並提升乘客便利性。隨著出行系統的現代化,紙本車票正逐步被安全可靠、數據驅動的平台所取代,這些平台支援即時驗證和分析。這些解決方案也符合公共衛生優先事項和成本削減策略。對城市綜合出行和數據驅動型交通規劃的日益重視進一步促進了這些解決方案的普及。各國政府正在大力投資智慧交通基礎設施,作為更廣泛的智慧城市計畫的一部分,加速在公車、鐵路和地鐵系統中的部署。智慧票務平台正日益被視為基礎性數位基礎設施,它不僅能改善使用者體驗,還能建構可擴展、面向未來的交通生態系統。
| 市場範圍 | |
|---|---|
| 起始年份 | 2025 |
| 預測年份 | 2026-2035 |
| 起始值 | 117億美元 |
| 預測值 | 396億美元 |
| 複合年成長率 | 13.1% |
基於帳戶的票務系統和開放式支付框架正在重塑票價收取方式,將交易邏輯從實體卡轉移到集中式使用者帳戶。這些模式實現了靈活的票價計算、無縫的多模式整合以及更廣泛的互通性。它們簡化了註冊流程,降低了系統複雜性,並允許旅客使用銀行卡或行動裝置支付,而無需依賴專有媒介。隨著城市尋求統一的出行平台,這些技術正迅速取代傳統的閉迴路系統。
硬體部分在2025年佔據了47%的市場佔有率,預計到2035年將以12.1%的複合年成長率成長。現代系統需要能夠同時處理多種票務介質的先進驗證器。耐用性要求和複雜的安裝環境導致更高的更換和升級成本,進一步鞏固了硬體對收入的強勁貢獻。
智慧卡市場在2025年佔據35%的市場佔有率,預計2026年至2035年間將以11.8%的複合年成長率成長。由於其可靠性和安全性,智慧卡在許多現有系統中仍然佔據核心地位,儘管向行動支付和開放式支付方式的逐步過渡仍在繼續。非接觸式支付標準確保了持續的互通性,而行動支付效能的提升也提高了智慧型手機票務系統的普及率。
預計2025年,美國智慧票務市場規模將達31億美元,引領北美市場。大型公共交通網路的持續現代化改造,推動了對先進票務基礎設施和後端平台的持續需求。
目錄
第1章:方法論與範圍
第2章:執行概要
第3章:行業洞察
- 產業生態系分析
- 供應商格局
- 系統和平台提供者
- 五金供應商
- 支付合作夥伴
- 利基專家
- 最終用途
- 成本結構
- 利潤率
- 每個階段的價值增加
- 影響供應鏈的因素
- 顛覆者
- 供應商格局
- 對力的影響
- 成長促進因素
- 非接觸式和無現金支付方式的快速普及
- 擴展以帳戶為基礎的票務系統(ABT)和開放式系統
- 智慧城市計畫與政府數位化項目
- 智慧型手機普及率和行動錢包使用量的成長
- 產業陷阱與挑戰
- 初始部署和升級成本高昂
- 與原有基礎設施整合
- 網路安全風險與資料隱私問題
- 市場機遇
- 擴展開放式EMV和行動錢包支付
- 在對成本敏感的地區,2D碼和行動票務正在成長
- 採用生物辨識及人臉辨識門禁系統
- 政府對智慧城市和公共交通現代化的投資
- 成長促進因素
- 成長潛力分析
- 北美洲
- CCPA / CPRA(加州消費者隱私法案 / 加州隱私權法案)
- PCI DSS(支付卡產業資料安全標準)
- 歐洲
- 隱私代碼(Codice in materia di protezione dei dati individuali)
- 國家網路安全局指令
- 2018年資料保護法
- PSD2(支付服務指示2)和開放銀行規則
- 亞太地區
- 2023年數位個人資料保護法(印度)
- 韓國個人資訊保護法 (PIPA)
- 1979 年電信(攔截與存取)法(澳洲)
- 國家資料保護/電子交易法
- 拉丁美洲
- LGPD(Lei Geral de Protecao de Dados)
- 國家個人資料保護局法規
- 聯邦法律關於保護私人持有的個人數據
- 中東和非洲
- 個人資料保護法 (PDPL)
- 反網路犯罪法(各司法管轄區)
- 南非電子通訊和交易法
- 北美洲
- 波特的分析
- PESTEL 分析
- 技術與創新格局
- 當前技術趨勢
- 新興技術
- 定價分析
- 依產品
- 按地區
- 成本細分分析
- 供應商成本結構
- 成本構成要素的實施
- 持續營運成本
- 間接客戶成本
- 專利分析
- 商業模式與獲利
- 資本支出銷售模式與SaaS/代管服務模式對比
- 收入來源(交易費、資料服務費、廣告費)
- 混合型商業結構
- 案例研究和參考部署
- 大都會的成功案例
- 成本敏感型/2D碼優先部署
- 經驗教訓和常見陷阱
- 永續性和環境方面
- 永續實踐
- 減少廢棄物策略
- 生產中的能源效率
- 環保舉措
- 碳足跡考量
- 未來展望與機遇
第4章:競爭格局
- 介紹
- 公司市佔率分析
- 北美洲
- 歐洲
- 亞太地區
- 拉丁美洲
- MEA
- 主要市場參與者的競爭分析
- 競爭定位矩陣
- 戰略展望矩陣
- 關鍵進展
- 併購
- 合作夥伴關係與合作
- 新產品發布
- 擴張計劃和資金
第5章:市場估算與預測:依組件分類,2022-2035年
- 硬體
- 智慧卡讀卡器
- 自動售票機(TVM)
- 閘機/旋轉閘門
- 銷售點終端
- 移動/手持式驗證器
- 軟體
- 票務及票價管理軟體
- 行動票務應用程式
- 即時乘客資訊軟體
- 收益管理系統
- CRM和分析平台
- 服務
- 專業服務
- 託管服務
第6章:市場估算與預測:依票務技術分類,2022-2035年
- 智慧卡
- 手機票務
- QR 圖碼/條碼門票
- 開放式支付系統
- 生物辨識票務
- 穿戴式票務
第7章:市場估計與預測:依系統分類,2022-2035年
- 開放系統
- 封閉系統
第8章:市場估算與預測:依部署方式分類,2022-2035年
- 本地部署
- 雲
第9章:市場估算與預測:依連結方式分類,2022-2035年
- 射頻識別
- 條碼
- 近場通訊(NFC)
- 蜂巢式網路
- 無線上網
第10章:市場估計與預測:依最終用途分類,2022-2035年
- 停車處
- 體育娛樂
- 運輸
- 道路
- 鐵路
- 航空
- 其他
第11章:市場估計與預測:按地區分類,2022-2035年
- 北美洲
- 美國
- 加拿大
- 歐洲
- 德國
- 英國
- 法國
- 義大利
- 西班牙
- 俄羅斯
- 北歐
- 比荷盧經濟聯盟
- 亞太地區
- 中國
- 印度
- 日本
- 澳洲
- 韓國
- 泰國
- 印尼
- 新加坡
- 越南
- 拉丁美洲
- 巴西
- 墨西哥
- 阿根廷
- 哥倫比亞
- MEA
- 南非
- 沙烏地阿拉伯
- 阿拉伯聯合大公國
第12章:公司簡介
- Global Leaders
- Conduent
- Cubic
- Thales
- Siemens
- Giesecke+Devrient (G+D)
- HID Global
- NXP Semiconductors
- Infineon Technologies
- Idemia
- Verimatrix
- SITA
- 區域冠軍
- CPI Card
- Confidex
- TCN Technology
- Telvent GIT
- Xerox
- Scheidt & Bachmann
- Flowbird
- Masabi
- Ridango
- 新興參與者
- Etickets
- Littlepay
- FAIRTIQ
- Snapper Services
- Eventbrite
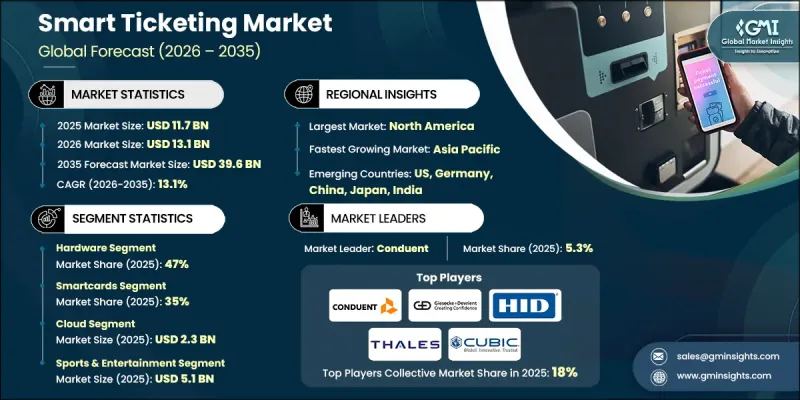
The Global Smart Ticketing Market was valued at USD 11.7 billion in 2025 and is estimated to grow at a CAGR of 13.1% to reach USD 39.6 billion by 2035.
Market growth is being driven by the worldwide transition toward digital and contactless payment ecosystems. Travelers increasingly favor fast and frictionless payment experiences that eliminate physical tickets and cash handling. Transit authorities and public agencies are actively supporting digital fare collection to improve operational efficiency, reduce transaction friction, and enhance passenger convenience. As mobility systems modernize, paper-based ticketing is steadily being replaced by secure, data-driven platforms that support real-time validation and analytics. These solutions also align with public health priorities and cost-reduction strategies. The expanding focus on integrated urban mobility and data-enabled transport planning further supports adoption. Governments are investing heavily in intelligent transport infrastructure as part of broader smart city initiatives, accelerating deployment across buses, rail networks, and metro systems. Smart ticketing platforms are increasingly viewed as foundational digital infrastructure that improves user experience while enabling scalable, future-ready transit ecosystems.
| Market Scope | |
|---|---|
| Start Year | 2025 |
| Forecast Year | 2026-2035 |
| Start Value | $11.7 Billion |
| Forecast Value | $39.6 Billion |
| CAGR | 13.1% |
Account-based ticketing and open-loop payment frameworks are reshaping fare collection by shifting transaction logic from physical cards to centralized user accounts. These models enable flexible fare calculation, seamless multimodal integration, and broader interoperability. They simplify onboarding, lower system complexity, and allow travelers to pay using bank cards or mobile devices without relying on proprietary media. As cities pursue unified mobility platforms, these technologies are rapidly replacing legacy closed-loop systems.
The hardware segment accounted for a 47% share in 2025 and is forecast to grow at a CAGR of 12.1% through 2035. Modern systems require advanced validators capable of processing multiple fare media simultaneously. Durability requirements and complex installation environments contribute to higher replacement and upgrade costs, reinforcing hardware's strong revenue contribution.
The smartcards segment held a 35% share in 2025 and is expected to grow at a CAGR of 11.8% between 2026 and 2035. These cards remain central to many established systems due to reliability and security, although gradual migration toward mobile and open-loop options continues. Contactless standards ensure ongoing interoperability, while improved mobile performance is increasing acceptance of smartphone-based ticketing.
U.S. Smart Ticketing Market generated USD 3.1 billion in 2025 and led the North America market. Ongoing modernization of large-scale transit networks is driving sustained demand for advanced fare collection infrastructure and backend platforms.
Key companies operating in the Global Smart Ticketing Market include Cubic, Thales, Conduent, Giesecke + Devrient, HID Global, NXP Semiconductors, Infineon Technologies, and Confidex. Companies in the Global Smart Ticketing Market are strengthening their competitive position through continuous innovation, strategic partnerships, and large-scale deployment capabilities. Providers are investing in interoperable platforms that support account-based architectures, open-loop payments, and mobile-first experiences. Collaboration with transit authorities enables long-term contracts and system-wide rollouts. Many players focus on modular hardware designs and cloud-native software to improve scalability and reduce deployment time.
Table of Contents
Chapter 1 Methodology & Scope
- 1.1 Market scope and definition
- 1.2 Research design
- 1.2.1 Research approach
- 1.2.2 Data collection methods
- 1.3 Data mining sources
- 1.3.1 Global
- 1.3.2 Regional/Country
- 1.4 Base estimates and calculations
- 1.4.1 Base year calculation
- 1.4.2 Key trends for market estimation
- 1.5 Primary research and validation
- 1.5.1 Primary sources
- 1.6 Forecast
- 1.7 Research assumptions and limitations
Chapter 2 Executive Summary
- 2.1 Industry 3600 synopsis
- 2.2 Key market trends
- 2.2.1 Regional
- 2.2.2 Component
- 2.2.3 Ticketing Technology
- 2.2.4 System
- 2.2.5 Deployment
- 2.2.6 Connectivity
- 2.2.7 End Use
- 2.3 TAM Analysis, 2026-2035
- 2.4 CXO perspectives: Strategic imperatives
- 2.4.1 Key decision points for industry executives
- 2.4.2 Critical success factors for market players
- 2.5 Future outlook and strategic recommendations
Chapter 3 Industry Insights
- 3.1 Industry ecosystem analysis
- 3.1.1 Supplier landscape
- 3.1.1.1 System & platform providers
- 3.1.1.2 Hardware suppliers
- 3.1.1.3 Payment partners
- 3.1.1.4 Niche specialists
- 3.1.1.5 End use
- 3.1.2 Cost structure
- 3.1.3 Profit margin
- 3.1.4 Value addition at each stage
- 3.1.5 Factors impacting the supply chain
- 3.1.6 Disruptors
- 3.1.1 Supplier landscape
- 3.2 Impact on forces
- 3.2.1 Growth drivers
- 3.2.1.1 Rapid adoption of contactless & cashless payments
- 3.2.1.2 Expansion of account-based ticketing (ABT) & open-loop systems
- 3.2.1.3 Smart city initiatives & government digitalization programs
- 3.2.1.4 Growth in smartphone penetration & mobile wallet usage
- 3.2.2 Industry pitfalls & challenges
- 3.2.2.1 High initial deployment & upgrade costs
- 3.2.2.2 Integration with legacy infrastructure
- 3.2.2.3 Cybersecurity risks & data privacy concerns
- 3.2.3 Market opportunities
- 3.2.3.1 Expansion of open-loop EMV and mobile wallet payments
- 3.2.3.2 Growth of QR and mobile ticketing in cost-sensitive regions
- 3.2.3.3 Adoption of biometric and facial recognition access systems
- 3.2.3.4 Government investments in smart city & public transport modernization
- 3.2.1 Growth drivers
- 3.3 Growth potential analysis
- 3.3.1 North America
- 3.3.1.1 CCPA / CPRA (California Consumer Privacy Act / California Privacy Rights Act)
- 3.3.1.2 PCI DSS (Payment Card Industry Data Security Standard)
- 3.3.2 Europe
- 3.3.2.1 Privacy Code (Codice in materia di protezione dei dati personali)
- 3.3.2.2 National cybersecurity agency directives
- 3.3.2.3 Data Protection Act 2018
- 3.3.2.4 PSD2 (Payment Services Directive 2) and open-banking rules
- 3.3.3 Asia Pacific
- 3.3.3.1 Digital Personal Data Protection Act 2023 (India)
- 3.3.3.2 PIPA (Personal Information Protection Act, South Korea)
- 3.3.3.3 Telecommunications (Interception and Access) Act 1979 (Australia)
- 3.3.3.4 National data-protection / e-transactions laws
- 3.3.4 Latin America
- 3.3.4.1 LGPD (Lei Geral de Protecao de Dados)
- 3.3.4.2 National Directorate for Personal Data Protection regulations
- 3.3.4.3 Federal Law on the Protection of Personal Data Held by Private Parties
- 3.3.5 Middle East & Africa
- 3.3.5.1 PDPL (Personal Data Protection Law)
- 3.3.5.2 Anti-Cyber Crime Law (various jurisdictions)
- 3.3.5.3 Electronic Communications and Transactions Act (South Africa)
- 3.3.1 North America
- 3.4 Porter's analysis
- 3.5 PESTEL analysis
- 3.6 Technology and innovation landscape
- 3.6.1 Current technological trends
- 3.6.2 Emerging technologies
- 3.7 Pricing analysis
- 3.7.1 By product
- 3.7.2 By region
- 3.8 Cost breakdown analysis
- 3.8.1 Vendor cost structure
- 3.8.2 Implementation of cost components
- 3.8.3 Ongoing operational costs
- 3.8.4 Indirect customer costs
- 3.9 Patent analysis
- 3.10 Business models & monetization
- 3.10.1 Capex sale vs SaaS / managed services models
- 3.10.2 Revenue streams (transaction fees, data services, ads)
- 3.10.3 Hybrid commercial structures
- 3.11 Case studies & reference deployments
- 3.11.1 Large-metro success stories
- 3.11.2 Cost-sensitive / QR-first deployments
- 3.11.3 Lessons learned and common pitfalls
- 3.12 Sustainability and environmental aspects
- 3.12.1 Sustainable practices
- 3.12.2 Waste reduction strategies
- 3.12.3 Energy efficiency in production
- 3.12.4 Eco-friendly initiatives
- 3.12.5 Carbon footprint considerations
- 3.13 Future outlook and opportunities
Chapter 4 Competitive Landscape, 2025
- 4.1 Introduction
- 4.2 Company market share analysis
- 4.2.1 North America
- 4.2.2 Europe
- 4.2.3 Asia Pacific
- 4.2.4 LATAM
- 4.2.5 MEA
- 4.3 Competitive analysis of major market players
- 4.4 Competitive positioning matrix
- 4.5 Strategic outlook matrix
- 4.6 Key developments
- 4.6.1 Mergers & acquisitions
- 4.6.2 Partnerships & collaborations
- 4.6.3 New product launches
- 4.6.4 Expansion plans and funding
Chapter 5 Market Estimates & Forecast, By Component, 2022 - 2035 ($Bn, Units)
- 5.1 Key trends
- 5.2 Hardware
- 5.2.1 Smart card readers
- 5.2.2 Ticket vending machines (TVMs)
- 5.2.3 Fare gates/turnstiles
- 5.2.4 Point-of-sale terminals
- 5.2.5 Mobile/handheld validators
- 5.3 Software
- 5.3.1 Ticketing & fare management software
- 5.3.2 Mobile ticketing apps
- 5.3.3 Real-time passenger information software
- 5.3.4 Revenue management systems
- 5.3.5 CRM & analytics platforms
- 5.4 Services
- 5.4.1 Professional services
- 5.4.2 Managed services
Chapter 6 Market Estimates & Forecast, By Ticketing Technology, 2022 - 2035 ($Bn)
- 6.1 Key trends
- 6.2 Smartcards
- 6.3 Mobile ticketing
- 6.4 QR code/barcode tickets
- 6.5 Open-loop payment systems
- 6.6 Biometric ticketing
- 6.7 Wearable ticketing
Chapter 7 Market Estimates & Forecast, By System, 2022 - 2035 ($Bn)
- 7.1 Key trends
- 7.2 Open system
- 7.3 Closed system
Chapter 8 Market Estimates & Forecast, By Deployment, 2022 - 2035 ($Bn)
- 8.1 Key trends
- 8.2 On-premise
- 8.3 Cloud
Chapter 9 Market Estimates & Forecast, By Connectivity, 2022 - 2035 ($Bn)
- 9.1 Key trends
- 9.2 RFID
- 9.3 Barcode
- 9.4 Near-field Communication (NFC)
- 9.5 Cellular Network
- 9.6 Wi-Fi
Chapter 10 Market Estimates & Forecast, By End Use, 2022 - 2035 ($Bn)
- 10.1 Key trends
- 10.2 Parking
- 10.3 Sports & Entertainment
- 10.4 Transportation
- 10.4.1 Roadways
- 10.4.2 Railways
- 10.4.3 Airways
- 10.5 Others
Chapter 11 Market Estimates & Forecast, By Region, 2022 - 2035 ($Bn)
- 11.1 Key trends
- 11.2 North America
- 11.2.1 US
- 11.2.2 Canada
- 11.3 Europe
- 11.3.1 Germany
- 11.3.2 UK
- 11.3.3 France
- 11.3.4 Italy
- 11.3.5 Spain
- 11.3.6 Russia
- 11.3.7 Nordics
- 11.3.8 Benelux
- 11.4 Asia Pacific
- 11.4.1 China
- 11.4.2 India
- 11.4.3 Japan
- 11.4.4 Australia
- 11.4.5 South Korea
- 11.4.6 Thailand
- 11.4.7 Indonesia
- 11.4.8 Singapore
- 11.4.9 Vietnam
- 11.5 Latin America
- 11.5.1 Brazil
- 11.5.2 Mexico
- 11.5.3 Argentina
- 11.5.4 Colombia
- 11.6 MEA
- 11.6.1 South Africa
- 11.6.2 Saudi Arabia
- 11.6.3 UAE
Chapter 12 Company Profiles
- 12.1 Global Leaders
- 12.1.1 Conduent
- 12.1.2 Cubic
- 12.1.3 Thales
- 12.1.4 Siemens
- 12.1.5 Giesecke+Devrient (G+D)
- 12.1.6 HID Global
- 12.1.7 NXP Semiconductors
- 12.1.8 Infineon Technologies
- 12.1.9 Idemia
- 12.1.10 Verimatrix
- 12.1.11 SITA
- 12.2 Regional Champions
- 12.2.1 CPI Card
- 12.2.2 Confidex
- 12.2.3 TCN Technology
- 12.2.4 Telvent GIT
- 12.2.5 Xerox
- 12.2.6 Scheidt & Bachmann
- 12.2.7 Flowbird
- 12.2.8 Masabi
- 12.2.9 Ridango
- 12.3 Emerging Players
- 12.3.1 Etickets
- 12.3.2 Littlepay
- 12.3.3 FAIRTIQ
- 12.3.4 Snapper Services
- 12.3.5 Eventbrite
 線上巴士票銷售服務市場:依預訂平台、車票類型、支付方式及客戶類型分類-2026-2032年全球市場預測
 智慧票務市場報告:按產品、組件、系統、應用和地區分類(2026-2034 年)智慧票務市場:2026-2032年全球市場預測(依解決方案、票務類型、最終用戶、銷售管道和部署模式分類)
 非接觸式收費和電子票務市場預測:至 2034 年—按組件、技術、應用、最終用戶和地區分類的全球分析
 服務台軟體市場規模、佔有率和成長分析:按服務類型、功能、部署模式、客戶規模、最終用戶產業、地區和產業預測,2026-2033 年
 交通運輸票務市場分析及預測(至2035年):依類型、產品、服務、技術、組件、應用、形式、最終使用者、模式、部署方式分類幫助台軟體市場分析及預測(至2035年):依類型、產品、服務、技術、組件、應用、部署模式、最終用戶、模組及功能分類智慧票務市場分析及預測(至2035年):依類型、產品類型、服務、技術、組件、應用、部署類型、最終用戶及解決方案分類線上活動票務市場分析及預測(至2035年):按類型、產品類型、服務、技術、組件、應用、設備、部署類型、最終用戶和解決方案分類非接觸式票務市場分析及預測(至2035年):依類型、產品類型、服務、技術、組件、應用、最終用戶、部署類型及設備分類