


 |
市場調查報告書
商品編碼
1892654
購電協議(PPA)平台市場機會、成長促進因素、產業趨勢分析及預測(2026-2035年)Power Purchase Agreement (PPA) Platform Market Opportunity, Growth Drivers, Industry Trend Analysis, and Forecast 2026 - 2035 |
||||||
2025 年全球購電協議平台市場價值為 24 億美元,預計到 2035 年將以 14.6% 的複合年成長率成長至 95 億美元。
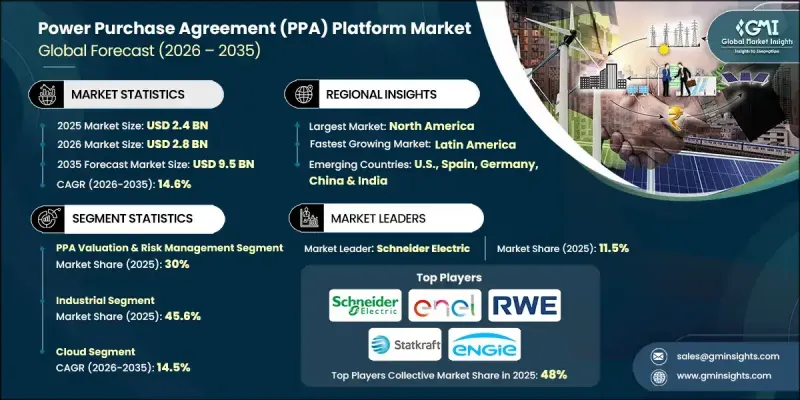
再生能源採購流程日益數位化和透明化是推動市場發展的驅動力。各機構正利用購電協議(PPA)平台評估價格、比較再生能源、管理談判流程並監控長期合約的履行情況。數位化平台能夠提高效率、減少交易摩擦,並支援各地區企業和公用事業的脫碳計畫。購電協議平臺本質上是一個軟體驅動的市場,連接再生能源開發商與企業、工業和公用事業買家。這些平台透過提供定價工具、風險評估、合約標準化和專案評估功能來簡化採購流程。透過改善買賣雙方的匹配,這些平台能夠提高專案的融資可行性、最佳化定價策略、評估買家的信用度並追蹤交易階段,從而建立一個更有效率的再生能源生態系統。
| 市場範圍 | |
|---|---|
| 起始年份 | 2025 |
| 預測年份 | 2026-2035 |
| 起始值 | 24億美元 |
| 預測值 | 95億美元 |
| 複合年成長率 | 14.6% |
預計到2025年,購電協議(PPA)估值和風險管理細分市場將佔據30%的市場佔有率,並預計在2035年之前以13.5%的複合年成長率成長。該細分市場專注於評估與長期再生能源合約相關的財務、營運和監管風險。此類平台提供先進的預測、建模和分析功能,用於評估信用風險、價格波動、專案可行性和整體合約績效。
預計到2025年,公用事業板塊的估值將達到7.102億美元。公用事業公司正擴大採用購電協議(PPA)平台,以滿足監管要求和永續發展目標,同時簡化交易流程並確保獲得經濟高效的再生能源。不斷成長的企業能源需求、電網脫碳政策以及再生能源強制規定正在推動該行業對購電協議的更高採用率。
預計到2025年,美國購電協議平台市場將佔據74%的市場佔有率,創造7.342億美元的收入。隨著企業、公用事業公司和大型能源用戶為實現永續發展目標和脫碳承諾而增加再生能源採購,預計該市場成長速度將加快。
目錄
第1章:方法論與範圍
第2章:執行概要
第3章:行業洞察
- 產業生態系分析
- 原物料供應及採購分析
- 製造能力評估
- 供應鏈韌性與風險因素
- 配電網路分析
- 監管環境
- 產業影響因素
- 成長促進因素
- 產業陷阱與挑戰
- 成長潛力分析
- 波特的分析
- PESTEL 分析
- 購電協議(PPA)平台成本結構分析
- 新興機會與趨勢
- 投資展望與數位轉型
- 永續發展與工業4.0融合
第4章:競爭格局
- 介紹
- 按地區分類的公司市佔率分析
- 北美洲
- 歐洲
- 亞太地區
- 中東和非洲
- 拉丁美洲
- 戰略儀錶板
- 策略舉措
- 重要夥伴關係與合作
- 主要併購活動
- 產品創新與發布
- 市場擴張策略
- 競爭性標竿分析
- 創新與永續發展格局
第5章:市場規模及預測:依解決方案分類,2022-2035年
- 購電協議估值與風險管理
- 合約與投資組合管理
- 市場/招標平台
- 分散式能源/微電網購電協議平台
第6章:市場規模及預測:依部署方式分類,2022-2035年
- 雲
- 現場
第7章:市場規模及預測:依最終用途分類,2022-2035年
- 工業的
- 能源開發商
- 公用事業
- 金融機構
第8章:市場規模及預測:依應用領域分類,2022-2035年
- 再生能源採購
- 金融風險與估值
- 投資組合最佳化與報告
第9章:市場規模及預測:依地區分類,2022-2035年
- 北美洲
- 美國
- 加拿大
- 墨西哥
- 歐洲
- 西班牙
- 德國
- 英國
- 法國
- 義大利
- 波蘭
- 荷蘭
- 瑞典
- 亞太地區
- 中國
- 澳洲
- 印度
- 日本
- 韓國
- 新加坡
- 印尼
- 菲律賓
- 中東和非洲
- 沙烏地阿拉伯
- 阿拉伯聯合大公國
- 南非
- 埃及
- 阿曼
- 摩洛哥
- 拉丁美洲
- 巴西
- 智利
- 阿根廷
- 哥倫比亞
第10章:公司簡介
- Anthesis
- Astatine Ltd.
- Aurora Energy Research
- CFP FlexPower GmbH
- cQuant.io
- Ecohz
- Enel Spa
- ENGIE
- FlexiDAO
- Kebola
- KYOS
- LevelTen Energy
- Next Kraftwerke
- Noble Green Energy
- Path Energy
- Pexapark
- Power Ledger
- REsurety
- RWE
- Schneider Electric
- Statkraft
- Synergy Solar Solutions
- Veyt
- Zeigo
The Global Power Purchase Agreement Platform Market was valued at USD 2.4 billion in 2025 and is estimated to grow at a CAGR of 14.6% to reach USD 9.5 billion by 2035.
The market is driven by the increasing digitalization and transparency of renewable energy procurement processes. Organizations are leveraging PPA platforms to assess pricing, compare renewable energy sources, manage negotiation workflows, and monitor long-term contract performance. Digital platforms enhance efficiency, minimize transaction friction, and support corporate and utility decarbonization initiatives across regions. A PPA platform is essentially a software-enabled marketplace that connects renewable energy developers with corporate, industrial, and utility buyers. These platforms streamline procurement by offering pricing tools, risk assessment, contract standardization, and project evaluation capabilities. By improving buyer-seller matchmaking, these platforms boost project bankability, optimize pricing strategies, evaluate buyer creditworthiness, and track deal stages, creating a more efficient renewable energy ecosystem.
| Market Scope | |
|---|---|
| Start Year | 2025 |
| Forecast Year | 2026-2035 |
| Start Value | $2.4 Billion |
| Forecast Value | $9.5 Billion |
| CAGR | 14.6% |
The PPA valuation and risk management segment held a 30% share in 2025 and is expected to grow at a CAGR of 13.5% through 2035. This segment focuses on evaluating the financial, operational, and regulatory risks associated with long-term renewable energy contracts. Platforms in this category offer advanced forecasting, modeling, and analytics to assess credit risk, price volatility, project viability, and overall contract performance.
The utility segment was valued at USD 710.2 million in 2025. Utilities are increasingly adopting PPA platforms to meet regulatory requirements and sustainability goals while simplifying transaction processes and securing cost-effective renewable energy. Rising corporate energy demand, grid decarbonization policies, and renewable energy mandates are driving higher adoption across this sector.
U.S. Power Purchase Agreement Platform Market held 74% share in 2025, generating USD 734.2 million. Growth is expected to accelerate as corporations, utilities, and large-scale energy consumers increase renewable energy procurement to achieve sustainability targets and decarbonization commitments.
Major players in the Power Purchase Agreement Platform Market include Anthesis, Astatine, Aurora Energy Research, CFP FlexPower, cQuant.io, Ecohz, Enel Spa, ENGIE, FlexiDAO, Kebola, KYOS, LevelTen Energy, Next Kraftwerke, Noble Green Energy, Path Energy, Pexapark, Power Ledger, REsurety, RWE, Schneider Electric, Statkraft, Synergy Solar Solutions, Veyt, and Zeigo. Companies in the Power Purchase Agreement (PPA) Platform Market are implementing several strategies to strengthen their market presence. They are investing in advanced analytics and AI-powered platforms to enhance pricing accuracy, contract management, and risk assessment. Partnerships with renewable developers, utilities, and corporate buyers allow broader market access and faster deal closure. Companies are also expanding geographically to capture emerging renewable markets and provide localized support. Integration with IoT and blockchain solutions enhances transparency, operational efficiency, and trust in long-term contracts.
Table of Contents
Chapter 1 Methodology & Scope
- 1.1 Research design
- 1.1.1 Research approach
- 1.1.2 Data collection methods
- 1.2 Base estimates and calculations
- 1.2.1 Base year calculation
- 1.2.2 Market estimates & forecast parameters
- 1.3 Forecast
- 1.3.1 Key trends for market estimates
- 1.3.2 Quantified market impact analysis
- 1.3.2.1 Mathematical impact of growth parameters on forecast
- 1.3.3 Scenario analysis framework
- 1.4 Primary research and validation
- 1.4.1 Some of the primary sources (but not limited to)
- 1.5 Data mining sources
- 1.5.1 Paid Sources
- 1.5.2 Sources, by region
- 1.6 Research trail & scoring components
- 1.6.1 Research trail components
- 1.6.2 Scoring components
- 1.7 Research transparency addendum
- 1.7.1 Source attribution framework
- 1.7.2 Quality assurance metrics
- 1.7.3 Our commitment to trust
- 1.8 Market definitions
Chapter 2 Executive Summary
- 2.1 Industry synopsis, 2022 - 2035
- 2.1.1 Business trends
- 2.1.2 Solution trends
- 2.1.3 Deployment trends
- 2.1.4 End use trends
- 2.1.5 Application trends
- 2.1.6 Regional trends
Chapter 3 Industry Insights
- 3.1 Industry ecosystem analysis
- 3.1.1 Raw material availability & sourcing analysis
- 3.1.2 Manufacturing capacity assessment
- 3.1.3 Supply chain resilience & risk factors
- 3.1.4 Distribution network analysis
- 3.2 Regulatory landscape
- 3.3 Industry impact forces
- 3.3.1 Growth drivers
- 3.3.2 Industry pitfalls & challenges
- 3.4 Growth potential analysis
- 3.5 Porter's analysis
- 3.5.1 Bargaining power of suppliers
- 3.5.2 Bargaining power of buyers
- 3.5.3 Threat of new entrants
- 3.5.4 Threat of substitutes
- 3.6 PESTEL analysis
- 3.6.1 Political factors
- 3.6.2 Economic factors
- 3.6.3 Social factors
- 3.6.4 Technological factors
- 3.6.5 Legal factors
- 3.6.6 Environmental factors
- 3.7 Cost structure analysis of power purchase agreement (PPA) platform
- 3.8 Emerging opportunities & trends
- 3.9 Investment outlook & digital transformation
- 3.10 Sustainability & industry 4.0 integration
Chapter 4 Competitive Landscape, 2025
- 4.1 Introduction
- 4.2 Company market share analysis, by region, 2025
- 4.2.1 North America
- 4.2.2 Europe
- 4.2.3 Asia Pacific
- 4.2.4 Middle East & Africa
- 4.2.5 Latin America
- 4.3 Strategic dashboard
- 4.4 Strategic initiatives
- 4.4.1 Key partnerships & collaborations
- 4.4.2 Major M&A activities
- 4.4.3 Product innovations & launches
- 4.4.4 Market expansion strategies
- 4.5 Competitive benchmarking
- 4.6 Innovation & sustainability landscape
Chapter 5 Market Size and Forecast, By Solution, 2022 - 2035 (USD Million)
- 5.1 Key trends
- 5.2 PPA valuation & risk management
- 5.3 Contract & portfolio management
- 5.4 Marketplace/ tendering platforms
- 5.5 Distributed energy/ microgrid PPA platforms
Chapter 6 Market Size and Forecast, By Deployment, 2022 - 2035 (USD Million)
- 6.1 Key trends
- 6.2 Cloud
- 6.3 On-premises
Chapter 7 Market Size and Forecast, By End Use, 2022 - 2035 (USD Million)
- 7.1 Key trends
- 7.2 Industrial
- 7.3 Energy developers
- 7.4 Utility
- 7.5 Financial institutions
Chapter 8 Market Size and Forecast, By Application, 2022 - 2035 (USD Million)
- 8.1 Key trends
- 8.2 Renewable energy procurement
- 8.3 Financial risk & valuation
- 8.4 Portfolio optimization & reporting
Chapter 9 Market Size and Forecast, By Region, 2022 - 2035 (USD Million)
- 9.1 Key trends
- 9.2 North America
- 9.2.1 U.S.
- 9.2.2 Canada
- 9.2.3 Mexico
- 9.3 Europe
- 9.3.1 Spain
- 9.3.2 Germany
- 9.3.3 UK
- 9.3.4 France
- 9.3.5 Italy
- 9.3.6 Poland
- 9.3.7 Netherlands
- 9.3.8 Sweden
- 9.4 Asia Pacific
- 9.4.1 China
- 9.4.2 Australia
- 9.4.3 India
- 9.4.4 Japan
- 9.4.5 South Korea
- 9.4.6 Singapore
- 9.4.7 Indonesia
- 9.4.8 Philippines
- 9.5 Middle East & Africa
- 9.5.1 Saudi Arabia
- 9.5.2 UAE
- 9.5.3 South Africa
- 9.5.4 Egypt
- 9.5.5 Oman
- 9.5.6 Morocco
- 9.6 Latin America
- 9.6.1 Brazil
- 9.6.2 Chile
- 9.6.3 Argentina
- 9.6.4 Colombia
Chapter 10 Company Profiles
- 10.1 Anthesis
- 10.2 Astatine Ltd.
- 10.3 Aurora Energy Research
- 10.4 CFP FlexPower GmbH
- 10.5 cQuant.io
- 10.6 Ecohz
- 10.7 Enel Spa
- 10.8 ENGIE
- 10.9 FlexiDAO
- 10.10 Kebola
- 10.11 KYOS
- 10.12 LevelTen Energy
- 10.13 Next Kraftwerke
- 10.14 Noble Green Energy
- 10.15 Path Energy
- 10.16 Pexapark
- 10.17 Power Ledger
- 10.18 REsurety
- 10.19 RWE
- 10.20 Schneider Electric
- 10.21 Statkraft
- 10.22 Synergy Solar Solutions
- 10.23 Veyt
- 10.24 Zeigo
 2026年全球可再生能源購電合約市場報告
 西班牙電力:市場佔有率分析、行業趨勢和統計數據、成長預測(2026-2031 年)2026年全球能源電力人工智慧(AI)市場報告
 80 PLUS 白金電源市場按功率範圍、模組化設計、外形規格、散熱方式、價格範圍、最終用戶和配銷通路分類 - 全球預測(2026-2032 年)日本電力:市場佔有率分析、產業趨勢與統計、成長預測(2026-2031)電力:市場佔有率分析、產業趨勢與統計、成長預測(2026-2031)馬來西亞電力市場-佔有率分析、產業趨勢與統計、成長預測(2026-2031)
 電力交易市場-全球產業規模、佔有率、趨勢、機會和預測,按類型(日前交易、日內交易)、應用(工業、商業、住宅)、地區和競爭格局分類,2021-2031年預測
 印度電力與再生能源最新動態:2025年第三季度
 GMIPulse - 能源與電力市場情報訂閱