


 |
市場調查報告書
商品編碼
1906017
馬來西亞電力市場-佔有率分析、產業趨勢與統計、成長預測(2026-2031)Malaysia Power - Market Share Analysis, Industry Trends & Statistics, Growth Forecasts (2026 - 2031) |
||||||
※ 本網頁內容可能與最新版本有所差異。詳細情況請與我們聯繫。
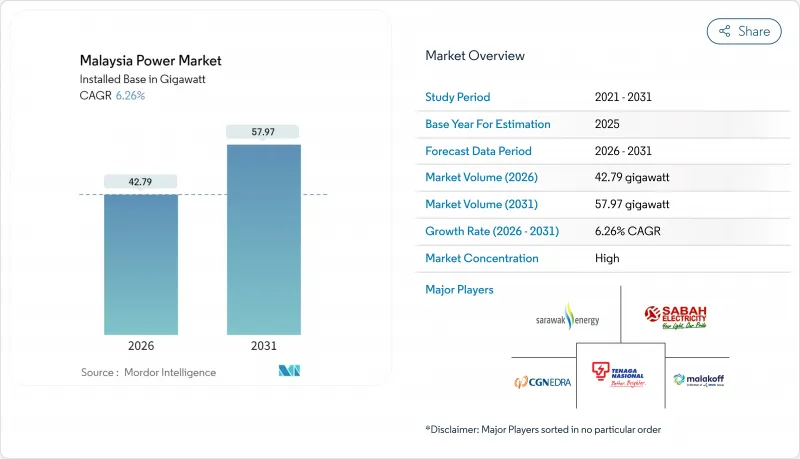
預計到 2026 年,馬來西亞電力市場規模將達到 42.79 吉瓦。
這意味著從 2025 年的 40.27 吉瓦成長到 2031 年的 57.97 吉瓦,2026 年至 2031 年的複合年成長率為 6.26%。
超大規模資料中心叢集新增11吉瓦的用電需求,僅在兩年內就加倍,迫使馬來西亞國家能源公司(TNB)加速對發電和輸電的投資。 2024年,火力發電技術佔馬來西亞電力市場的75.6%,但預計到2030年,可再生能源將以最快的速度成長,從而將資金重新分配到太陽能、水力發電和電池計劃,而煤炭投資則會減少。第三方准入規則正在將採購權轉移到商業用戶手中,而關稅和補貼改革則透過將價格與成本回收相匹配,改善了分散式太陽能發電的經濟效益。檳城、雪蘭莪和柔佛州的半導體製造地支撐著持續的工業需求,而天然氣供應限制以及東馬脆弱的輸電網面臨的限電風險則構成了關鍵的不確定性。
馬來西亞電力市場趨勢與分析
工業用電需求快速成長
英飛凌在吉靈投資20億歐元建設的碳化矽工廠,標誌著馬來西亞電力市場結構從傳統石化產業向精密製造業的轉型,而精密製造業正是馬來西亞當前電力市場的基石。國有電力供應商TNB已確定僅資料中心總合需要11吉瓦的裝置容量,這迫使其撥出馬幣億令吉資本支出儲備中的30%來應對意外的負載成長。儘管預計到2030年,工業需求仍將佔總消費量的一半,但其中半導體和雲端運算工作負載的需求日益成長,而這些工作負載需要低碳電力。構成比和輸電發展若延誤,可能會導致這些投資被擁有更先進可再生能源採購框架的區域競爭對手搶走。因此,地方政府正在加速變電站升級改造,並推廣電池儲能技術的應用,以維持充足的備用容量。
可再生能源引進目標
國家能源轉型藍圖設定了2025年可再生能源裝置容量佔比達到31%,2035年達到40%的目標。實現這些目標需要每年新增約1.5吉瓦的裝置容量,比以往的建造速度顯著提高。第五輪大型太陽能光電競標於2024年分配給馬來西亞競標2吉瓦,既確保了國產化率,也縮小了開發商的選擇範圍。國家能源公司(TNB)在水力發電水庫上建造的2.5吉瓦浮體式太陽能發電廠計畫將利用現有的輸電走廊,最大限度地減少土地使用衝突。同時,砂拉越能源公司7,300兆瓦的水力發電裝置容量使東馬成為潛在的清潔能源出口地區,一旦跨境輸電線路建成。 2050年實現70%的可再生能源比例意味著幾乎完全淘汰燃煤發電。氫能複合循環燃氣渦輪機被視為一種過渡技術,但燃料供應不穩定構成了一項挑戰。
天然氣供應受限和價格波動
國內天然氣產量已趨於穩定,而馬來西亞國家石油公司(Petronas)優先發展液化天然氣(LNG)出口,導致燃料週期性短缺,迫使發電企業轉向高成本更高的柴油。 2022年全球LNG價格飆升時,馬來西亞的成本轉嫁機制無法應付燃料成本的上漲,擠壓了獨立發電公司(IPP)的利潤空間。規劃中的氫能渦輪機旨在逐步以綠色氫氣取代天然氣,但工業規模的氫能基礎設施仍處於起步階段。除非在儲氣、進口和定價方面進行協調一致的改革,否則對天然氣的依賴將抑制對靈活火力資產的投資,並拖慢馬來西亞電力市場擴張的步伐。
細分市場分析
預計馬來西亞可再生能源市場規模將以22.89%的複合年成長率成長,到2025年將削弱該國目前火力發電技術在電力市場74.92%的佔有率。太陽能發電正推動可再生能源的蓬勃發展,這得益於國家能源公司(TNB)已建成的2.5吉瓦浮體式光伏電站以及在第五輪大型太陽能競標中分配的2吉瓦容量。水力發電在馬來西亞東部仍發揮重要作用,但其擴張受到環境評估和社區諮詢的限制。煤炭發電預計將大幅下降,到2030年將有9.1吉瓦的煤炭機組退役。同時,氫能燃氣渦輪機正在提高備用容量,並為電網未來的燃料轉換做好準備。電池儲能是關鍵因素。充足的儲能容量將提高光伏發電的滲透率,而儲能容量不足則會延長中負載燃氣電廠的運作壽命。
在儲能技術引進之前,太陽能光電發電的平準化成本在2024年就已經低於燃氣發電的邊際成本,這促使獨立發電商(IPP)在公共產業競標中增加購電協議(PPA)。砂拉越的水力資源能夠提供接近基本負載的電力,且變動成本低,一旦併網,該州有望成為電力出口州。風能和地熱能仍處於試驗階段,而生質能的擴張則因原料價格上漲而放緩。這種發電結構的變化將影響馬來西亞電力市場的發電調度、排放強度和投資分配。
馬來西亞電力市場報告按能源類型(火力發電、核能、可再生能源)和終端用戶(電力公司、商業/工業用戶、住宅)進行細分。市場規模和預測以裝置容量(吉瓦)為單位。
其他福利:
- Excel格式的市場預測(ME)表
- 3個月的分析師支持
目錄
第1章 引言
- 研究假設和市場定義
- 調查範圍
第2章調查方法
第3章執行摘要
第4章 市場情勢
- 市場概覽
- 市場促進因素
- 工業用電需求快速成長
- 可再生能源引進目標(2025年達31%,2035年達40%)
- 老舊燃煤發電廠退役後,興建替代設施
- 推動輸配電網路現代化,促進對輸配電設施的投資
- 第三方接取規則支援企業間購電協定 (PPA)
- 超大規模資料中心叢集會形成熱點
- 市場限制
- 天然氣供應受限和價格波動
- 改革電費
- 大規模可再生能源發電用地及許可證取得障礙
- 東馬脆弱的電網面臨限電風險
- 供應鏈分析
- 監管環境
- 技術展望(智慧電網、氫能相容型燃氣渦輪機聯合循環發電系統、電池儲能系統)
- 波特五力模型
- 新進入者的威脅
- 供應商的議價能力
- 買方的議價能力
- 替代品的威脅
- 競爭對手之間的競爭
- PESTEL 分析
第5章 市場規模與成長預測
- 透過電源
- 熱感(煤炭、天然氣、石油和天然氣、柴油)
- 核能
- 可再生能源(太陽能、風能、水能、地熱能、生質能/廢棄物、潮汐能)
- 最終用戶
- 公用事業
- 商業和工業
- 住宅
- 按輸配電和電壓等級(僅定性分析)
- 高壓輸電(230千伏特或更高)
- 二級電網(69-161千伏特)
- 中壓配電(13.2 至 34.5 kV)
- 低壓配電(1kV或以下)
第6章 競爭情勢
- 市場集中度
- 策略性舉措(併購、夥伴關係、購電協議)
- 市場佔有率分析(主要企業的市場排名和佔有率)
- 公司簡介
- Tenaga Nasional Berhad(TNB)
- Sarawak Energy Berhad
- Sabah Electricity Sdn Bhd(SESB)
- Edra Power Holdings
- Malakoff Corporation Berhad
- YTL Power International
- Genting Sanyen Power
- Petronas Power Sdn Bhd
- Cypark Resources Berhad
- Solarvest Holdings Berhad
- ERS Energy Sdn Bhd
- Verdant Solar
- LYS Energy Group
- Pathgreen Energy Sdn Bhd
- Sunway Construction Group Bhd(RE EPC)
- JinkoSolar(Malaysia Module Fab)
- First Solar Malaysia
- KEPCO Engineering & Construction
- Huawei Digital Power Malaysia
- Siemens Energy Malaysia
第7章 市場機會與未來展望
Malaysia Power Market size in 2026 is estimated at 42.79 gigawatt, growing from 2025 value of 40.27 gigawatt with 2031 projections showing 57.97 gigawatt, growing at 6.26% CAGR over 2026-2031.
Hyperscale data-center clusters account for 11 GW of new load applications, a figure that has doubled in only two years and is forcing Tenaga Nasional Berhad (TNB) to accelerate generation and grid investments. While thermal technologies maintained 75.6% of the Malaysian power market in 2024, renewables are the fastest-growing through 2030 and will re-allocate capital toward solar, hydro, and battery projects at the expense of coal. Third-party access rules are shifting procurement power to corporate consumers, and tariff-subsidy reforms are aligning prices with cost recovery, which, in turn, improves the economics of distributed solar. Semiconductor fabrication and cloud infrastructure hubs in Penang, Selangor, and Johor underpin sustained industrial demand, yet natural-gas supply constraints and curtailment risk in weak East Malaysia grids serve as headline uncertainties.
Malaysia Power Market Trends and Insights
Industrial Electricity-Demand Surge
Infineon's EUR 2 billion silicon-carbide fab in Kulim exemplifies the structural shift from legacy petrochemicals toward precision manufacturing that now underpins the Malaysian power market. TNB has confirmed that data-center applications alone total 11 GW, compelling the utility to reserve 30% of its RM 16.3 billion contingent capital expenditure for unanticipated load growth. Industrial demand is expected to maintain half of total consumption through 2030, but the composition tilts toward semiconductor and cloud workloads that require low-carbon electricity. Any lapse in generation or transmission build-out risks divesting these investments to regional competitors with more advanced renewable procurement frameworks. Consequently, local authorities are fast-tracking substation upgrades and incentivizing battery storage to keep reserve margins adequate.
Renewable-Energy Capacity Targets
The National Energy Transition Roadmap sets milestones of 31% renewable capacity by 2025 and 40% by 2035. Achieving these goals requires annual additions near 1.5 GW, notably faster than historical build-out rates. Large-Scale Solar Round 5 allocated 2 GW in 2024 to Malaysian-controlled bidders, favoring domestic content capture but narrowing the developer field. TNB's 2.5 GW floating-solar program across hydro reservoirs leverages existing transmission corridors and minimizes land-use conflicts, while Sarawak Energy's 7,300 MW hydro fleet positions East Malaysia as a potential clean-power exporter once cross-border interconnections advance. The 70% renewable aspiration by 2050 implies near-zero coal, with hydrogen-ready combined-cycle gas turbines providing a bridge technology, albeit with fuel-supply uncertainties.
Natural-Gas Supply Constraints and Price Volatility
Domestic gas production has plateaued, and Petronas prioritizes LNG exports, resulting in periodic fuel shortages that force generators to switch to costlier diesel back-up.When global LNG prices spiked in 2022, Malaysia's tariff-pass-through mechanism lagged fuel costs, compressing IPP margins. Planned hydrogen-ready turbines assume green hydrogen will gradually displace gas, yet industrial-scale hydrogen infrastructure remains nascent. Unless coordinated storage, import, and pricing reforms materialize, gas exposure will weigh on Malaysia's power market expansion speed by suppressing investor appetite for flexible thermal assets.
Other drivers and restraints analyzed in the detailed report include:
- Aging Coal-Fleet Retirements Triggering Replacement Build-Outs
- Hyperscale Data-Center Clusters Driving Load Pockets
- Electricity-Tariff Subsidy Reforms
For complete list of drivers and restraints, kindly check the Table Of Contents.
Segment Analysis
The Malaysian power market size for renewables is projected to rise at a 22.89% CAGR, eating into thermal technology's 74.92% Malaysia power market share in Malaysia in 2025. Solar leads the renewable surge, propelled by TNB's 2.5 GW floating-solar roll-out and 2 GW of allocated capacity under Large-Scale Solar Round 5. Hydro remains pivotal in East Malaysia, yet expansion is bound by environmental assessment and community engagement. Coal will decline sharply, with 9.1 GW scheduled to retire by 2030, while hydrogen-ready gas turbines pick up reserve margins and prepare the grid for future fuel transitions. Battery storage adoption becomes a gating factor: adequate storage unlocks higher solar penetration, while shortfalls would keep mid-merit gas plants online longer.
Solar's levelized cost fell below marginal gas generation in 2024, even before storage, encouraging IPPs to stack corporate PPAs on top of utility tenders. Hydro assets in Sarawak supply near-baseload output at low variable cost, positioning the state as a potential exporter pending interconnection. Wind and geothermal remain exploratory, and biomass expansion slows due to rising feedstock prices. The evolving mix will influence dispatch order, emissions intensity, and investment allocation across the Malaysia power market.
The Malaysia Power Market Report is Segmented by Power Source (Thermal, Nuclear, and Renewables) and End-User (Utilities, Commercial and Industrial, and Residential). The Market Sizes and Forecasts are Provided in Terms of Installed Capacity (GW).
List of Companies Covered in this Report:
- Tenaga Nasional Berhad (TNB)
- Sarawak Energy Berhad
- Sabah Electricity Sdn Bhd (SESB)
- Edra Power Holdings
- Malakoff Corporation Berhad
- YTL Power International
- Genting Sanyen Power
- Petronas Power Sdn Bhd
- Cypark Resources Berhad
- Solarvest Holdings Berhad
- ERS Energy Sdn Bhd
- Verdant Solar
- LYS Energy Group
- Pathgreen Energy Sdn Bhd
- Sunway Construction Group Bhd (RE EPC)
- JinkoSolar (Malaysia Module Fab)
- First Solar Malaysia
- KEPCO Engineering & Construction
- Huawei Digital Power Malaysia
- Siemens Energy Malaysia
Additional Benefits:
- The market estimate (ME) sheet in Excel format
- 3 months of analyst support
TABLE OF CONTENTS
1 Introduction
- 1.1 Study Assumptions & Market Definition
- 1.2 Scope of the Study
2 Research Methodology
3 Executive Summary
4 Market Landscape
- 4.1 Market Overview
- 4.2 Market Drivers
- 4.2.1 Industrial electricity-demand surge
- 4.2.2 Renewable-energy capacity targets (31 % by 2025; 40 % by 2035)
- 4.2.3 Aging coal-fleet retirements triggering replacement build-outs
- 4.2.4 Grid-modernisation & T&D capex push
- 4.2.5 Corporate PPAs enabled by Third-Party Access rules
- 4.2.6 Hyperscale data-centre clusters driving load pockets
- 4.3 Market Restraints
- 4.3.1 Natural-gas supply constraints & price volatility
- 4.3.2 Electricity-tariff subsidy reforms
- 4.3.3 Land & permitting hurdles for utility-scale RE
- 4.3.4 Curtailment risk in East-Malaysia weak grids
- 4.4 Supply-Chain Analysis
- 4.5 Regulatory Landscape
- 4.6 Technological Outlook (Smart grid, hydrogen-ready CCGT, BESS)
- 4.7 Porters Five Forces
- 4.7.1 Threat of New Entrants
- 4.7.2 Bargaining Power of Suppliers
- 4.7.3 Bargaining Power of Buyers
- 4.7.4 Threat of Substitutes
- 4.7.5 Competitive Rivalry
- 4.8 PESTLE Analysis
5 Market Size & Growth Forecasts
- 5.1 By Power Source
- 5.1.1 Thermal (Coal, Natural Gas, Oil and Diesel)
- 5.1.2 Nuclear
- 5.1.3 Renewables (Solar, Wind, Hydro, Geothermal, Biomass & Waste, Tidal)
- 5.2 By End User
- 5.2.1 Utilities
- 5.2.2 Commercial and Industrial
- 5.2.3 Residential
- 5.3 By T&D Voltage Level (Qualitative Analysis only)
- 5.3.1 High-Voltage Transmission (Above 230 kV)
- 5.3.2 Sub-Transmission (69 to 161 kV)
- 5.3.3 Medium-Voltage Distribution (13.2 to 34.5 kV)
- 5.3.4 Low-Voltage Distribution (Up to 1 kV)
6 Competitive Landscape
- 6.1 Market Concentration
- 6.2 Strategic Moves (M&A, Partnerships, PPAs)
- 6.3 Market Share Analysis (Market Rank/Share for key companies)
- 6.4 Company Profiles (includes Global level Overview, Market level overview, Core Segments, Financials as available, Strategic Information, Products & Services, and Recent Developments)
- 6.4.1 Tenaga Nasional Berhad (TNB)
- 6.4.2 Sarawak Energy Berhad
- 6.4.3 Sabah Electricity Sdn Bhd (SESB)
- 6.4.4 Edra Power Holdings
- 6.4.5 Malakoff Corporation Berhad
- 6.4.6 YTL Power International
- 6.4.7 Genting Sanyen Power
- 6.4.8 Petronas Power Sdn Bhd
- 6.4.9 Cypark Resources Berhad
- 6.4.10 Solarvest Holdings Berhad
- 6.4.11 ERS Energy Sdn Bhd
- 6.4.12 Verdant Solar
- 6.4.13 LYS Energy Group
- 6.4.14 Pathgreen Energy Sdn Bhd
- 6.4.15 Sunway Construction Group Bhd (RE EPC)
- 6.4.16 JinkoSolar (Malaysia Module Fab)
- 6.4.17 First Solar Malaysia
- 6.4.18 KEPCO Engineering & Construction
- 6.4.19 Huawei Digital Power Malaysia
- 6.4.20 Siemens Energy Malaysia
7 Market Opportunities & Future Outlook
- 7.1 White-space & Unmet-Need Assessment
 2026年人工智慧(AI)資料中心熱能儲存全球市場報告2026年全球太陽能人工智慧市場報告2026年全球可再生能源購電合約市場報告
 人工智慧在能源與電力市場的應用:策略性洞察與預測(2026-2031)
 可調可再生能源市場規模、佔有率和趨勢分析報告:按技術、最終用途、地區和細分市場分類,預測至2026-2033年
 西班牙電力:市場佔有率分析、行業趨勢和統計數據、成長預測(2026-2031 年)2026年全球能源電力人工智慧(AI)市場報告
 80 PLUS 白金電源市場按功率範圍、模組化設計、外形規格、散熱方式、價格範圍、最終用戶和配銷通路分類 - 全球預測(2026-2032 年)日本電力:市場佔有率分析、產業趨勢與統計、成長預測(2026-2031)電力:市場佔有率分析、產業趨勢與統計、成長預測(2026-2031)