


 |
市場調查報告書
商品編碼
1858824
消費品設計數位孿生市場機會、成長促進因素、產業趨勢分析及預測(2025-2034年)Digital Twin for Consumer Product Design Market Opportunity, Growth Drivers, Industry Trend Analysis, and Forecast 2025 - 2034 |
||||||
2024 年全球消費品設計數位孿生市場價值為 34 億美元,預計到 2034 年將以 18.6% 的複合年成長率成長至 188 億美元。
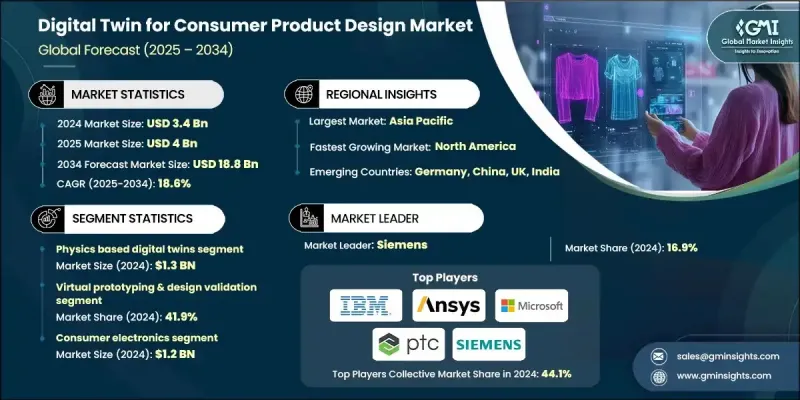
這一成長動能源自於對更客製化、更有效率、更永續的產品開發週期日益成長的需求。數位孿生作為現實世界產品的虛擬對應物,使設計團隊和製造商能夠在投入實際生產之前,在虛擬環境中模擬、測試和最佳化產品。這不僅可以縮短開發時間和降低成本,還有助於減少材料浪費。在快速發展的產業,例如家電、時尚和個人科技領域,對數位孿生解決方案的需求尤其強勁,因為這些領域對持續創新和卓越用戶體驗的需求龐大。這些虛擬模型還可以透過嵌入式物聯網技術實現效能預測、即時資料整合和上市後改進。由於所需的實體迭代次數減少,企業可以更快地迭代,並向市場推出更完善的產品。隨著各行業不斷投資於能夠改善設計驗證、製造效率和客戶滿意度的技術,這一趨勢正在加速發展,使數位孿生成為下一代產品設計和創新中的關鍵資產。
| 市場範圍 | |
|---|---|
| 起始年份 | 2024 |
| 預測年份 | 2025-2034 |
| 起始值 | 34億美元 |
| 預測值 | 188億美元 |
| 複合年成長率 | 18.6% |
2024年,基於實體的數位孿生技術市場規模達13億美元。這類數位孿生技術提供高度精確的確定性建模,能夠預測產品在不同實際條件下的表現表現。它在需要嚴格安全標準或法規核准的場景中尤其重要。與依賴歷史資料的系統不同,基於物理的模型從零開始模擬物理行為,因此非常適合早期開發階段的產品。這些模型可用於應力分析、熱性能和結構耐久性等複雜任務,為設計過程提供至關重要的洞察。
2024年,虛擬原型和設計驗證領域佔據了41.9%的市場。這個領域凸顯了數位孿生技術的核心實用性,它減少了對實體原型的需求,並簡化了整個開發週期。透過虛擬原型,製造商可以測試多種設計方案,並在各種模擬條件下評估其效能,從而在生產開始前及早發現問題並進行最佳化。這種數位化優先的方法正在幫助企業縮短開發週期,並做出更明智、數據驅動的設計決策。
2024年,美國消費品設計數位孿生市佔率高達76%。這一領先地位得益於公共和私營部門對先進製造技術的巨額投資以及強大的數位基礎設施。此外,美國還擁有完善的法律框架,為智慧財產權和創新提供了有力支持。憑藉著創投管道和來自頂尖教育機構的高技能專業人才,美國已成為數位孿生解決方案應用和開發的領導者。各行各業的消費品公司都在積極應用這些技術,以改善產品開發、最佳化品質控制流程並提升使用者整體滿意度。
推動消費品設計數位孿生市場發展的關鍵企業包括西門子、亞馬遜網路服務 (AWS)、Akselos、Bosch、Bentley、Cosmo Tech、達梭系統、PTC、SAP、Ansys、Altair、IBM、AVEVA、微軟和Hexagon。為了鞏固其在全球消費品設計數位孿生市場的地位,各公司正採取多種策略措施。許多公司投資於人工智慧和機器學習的整合,以增強模擬能力並即時提供預測性洞察。與物聯網和雲端服務供應商的合作有助於確保實體產品與其數位對應物之間無縫的資料流。各公司也致力於透過開發用戶友善平台和提供從建模到分析的端到端解決方案來擴展其服務組合。收購利基新創公司能夠幫助企業獲得專業技術並加快創新速度。
目錄
第1章:方法論與範圍
第2章:執行概要
第3章:行業洞察
- 產業生態系分析
- 供應商格局
- 利潤率
- 每個階段的價值增加
- 影響價值鏈的因素
- 產業影響因素
- 成長促進因素
- 加快產品上市時間的要求
- 消費者個性化需求
- 監理合規性和安全性
- 產業陷阱與挑戰
- 資料整合
- 高昂的實施成本
- 機會
- 大規模個人化產品開發
- 數據驅動的設計最佳化
- 成長促進因素
- 成長潛力分析
- 未來市場趨勢
- 技術與創新格局
- 當前技術趨勢
- 新興技術
- 價格趨勢
- 依設備類型
- 原料成本
- 監管環境
- 標準和合規要求
- 區域監理框架
- 認證標準
- 波特的分析
- PESTEL 分析
第4章:競爭格局
- 介紹
- 公司市佔率分析
- 按地區
- 公司矩陣分析
- 主要市場參與者的競爭分析
- 競爭定位矩陣
- 關鍵進展
- 併購
- 合作夥伴關係與合作
- 新產品發布
- 擴張計劃
第5章:市場估算與預測:依技術類型分類,2021-2034年
- 主要趨勢
- 基於物理的數位孿生
- 數據驅動的數位孿生
- 混合數位孿生
- 降階模型
第6章:市場估算與預測:依部署模式分類,2021-2034年
- 主要趨勢
- 基於雲端的數位孿生
- 邊緣運算數位孿生
- 混合雲端邊緣
- 其他(現場等)
第7章:市場估計與預測:依應用領域分類,2021-2034年
- 主要趨勢
- 虛擬原型製作與設計驗證
- 製造流程最佳化
- 預測性維護與生命週期管理
- 個性化與大規模客製化
- 供應鏈與永續性追蹤
第8章:市場估算與預測:依最終用途產業分類,2021-2034年
- 主要趨勢
- 消費性電子產品
- 智慧型手機和穿戴式裝置
- 物聯網設備整合
- 性能測試與可靠性
- 使用者體驗模擬
- 汽車
- 電動汽車零件
- 自動駕駛車輛系統整合
- 電池管理系統
- 時尚與服裝
- 虛擬服裝設計
- 材料行為模擬
- 家用電器
- 其他(半導體和硬體等)
第9章:市場估計與預測:依地區分類,2021-2034年
- 主要趨勢
- 北美洲
- 美國
- 加拿大
- 歐洲
- 德國
- 英國
- 法國
- 西班牙
- 義大利
- 亞太地區
- 中國
- 日本
- 印度
- 澳洲
- 韓國
- 拉丁美洲
- 巴西
- 墨西哥
- 阿根廷
- 中東和非洲
- 南非
- 沙烏地阿拉伯
- 阿拉伯聯合大公國
第10章:公司簡介
- Akselos
- Altair
- Amazon Web Services
- Ansys
- AVEVA
- Bentley
- Bosch
- Cosmo Tech
- Dassault
- Hexagon
- IBM
- Microsoft
- PTC
- SAP
- Siemens
The Global Digital Twin for Consumer Product Design Market was valued at USD 3.4 billion in 2024 and is estimated to grow at a CAGR of 18.6% to reach USD 18.8 billion by 2034.
This surge is being fueled by increasing demands for more customized, efficient, and sustainable product development cycles. Digital twins, which serve as virtual counterparts to real-world products, allow design teams and manufacturers to simulate, test, and optimize products in a virtual environment before committing to physical production. This not only reduces development time and costs but also helps cut material waste. The demand for digital twin solutions is especially strong in fast-evolving sectors like home appliances, fashion, and personal tech, where the pressure for constant innovation and superior user experience is high. These virtual models also enable performance predictions, real-time data integration, and post-launch improvements through embedded IoT technologies. With fewer physical iterations needed, companies can iterate faster and deliver more refined products to the market. The trend is gaining momentum as industries continue to invest in technologies that improve design validation, manufacturing efficiency, and customer satisfaction, making digital twins a key asset in the next generation of product design and innovation.
| Market Scope | |
|---|---|
| Start Year | 2024 |
| Forecast Year | 2025-2034 |
| Start Value | $3.4 Billion |
| Forecast Value | $18.8 Billion |
| CAGR | 18.6% |
In 2024, the physics-based digital twins segment generated USD 1.3 billion. This type of digital twin technology offers highly accurate, deterministic modeling that predicts how a product will behave under different real-world conditions. It's especially valuable in scenarios requiring strict safety standards or regulatory approvals. Unlike systems that depend on historical data, physics-based models simulate physical behaviors from the ground up, making them ideal for products in early development stages. These models are used for complex tasks like stress analysis, thermal performance, and structural durability, providing vital insights during the design process.
The virtual prototyping and design validation segment held a 41.9% share in 2024. This segment highlights the core utility of digital twin technology, cutting down on the need for physical prototypes and streamlining the entire development cycle. Through virtual prototyping, manufacturers can test multiple design variations and assess performance across a range of simulated conditions, enabling early identification of issues and optimization before production begins. This digital-first approach is helping companies reduce development timelines and make smarter, data-driven design decisions.
United States Digital Twin for Consumer Product Design Market held a 76% share in 2024. This dominance is backed by heavy public and private sector investments in advanced manufacturing technologies and a strong foundation in digital infrastructure. The country also benefits from a well-established legal framework supporting intellectual property rights and innovation. Access to venture capital and a pool of highly skilled professionals from top-tier educational institutions has positioned the U.S. as a leader in the adoption and development of digital twin solutions. Companies across various consumer-focused sectors are actively implementing these technologies to improve product development, refine quality control processes, and enhance overall user satisfaction.
Key players shaping the Digital Twin for Consumer Product Design Market include Siemens, Amazon Web Services, Akselos, Bosch, Bentley, Cosmo Tech, Dassault, PTC, SAP, Ansys, Altair, IBM, AVEVA, Microsoft, and Hexagon. To strengthen their position in the Global Digital Twin for Consumer Product Design Market, companies are adopting multiple strategic approaches. Many are investing in AI and machine learning integration to enhance simulation capabilities and deliver predictive insights in real time. Partnerships with IoT and cloud service providers help ensure seamless data flow between physical products and their digital counterparts. Firms are also focusing on expanding their service portfolios by developing user-friendly platforms and offering end-to-end solutions, from modeling to analysis. Acquisitions of niche startups allow access to specialized technologies and faster innovation.
Table of Contents
Chapter 1 Methodology and Scope
- 1.1 Market scope and definition
- 1.2 Research design
- 1.2.1 Research approach
- 1.2.2 Data collection methods
- 1.3 Data mining sources
- 1.3.1 Global
- 1.3.2 Regional
- 1.4 Base estimates and calculations
- 1.4.1 Base year calculation
- 1.4.2 Key trends for market estimation
- 1.5 Primary research and validation
- 1.5.1 Primary sources
- 1.6 Forecast model
- 1.7 Research assumptions and limitations
Chapter 2 Executive Summary
- 2.1 Industry 3600 synopsis
- 2.2 Key market trends
- 2.2.1 Regional
- 2.2.2 Technology type
- 2.2.3 Deployment model
- 2.2.4 Application
- 2.2.5 End use industry
- 2.3 CXO perspectives: strategic imperatives
- 2.3.1 Key decision points for industry executives
- 2.3.2 Critical success factors for market players
- 2.4 Future outlook and strategic recommendations
Chapter 3 Industry Insights
- 3.1 Industry ecosystem analysis
- 3.1.1 Supplier landscape
- 3.1.2 Profit margin
- 3.1.3 Value addition at each stage
- 3.1.4 Factor affecting the value chain
- 3.2 Industry impact forces
- 3.2.1 Growth drivers
- 3.2.1.1 Accelerated time-to-market demands
- 3.2.1.2 Consumer personalization requirements
- 3.2.1.3 Regulatory compliance and safety
- 3.2.2 Industry pitfalls & challenges
- 3.2.2.1 Data integration
- 3.2.2.2 High implementation costs
- 3.2.3 Opportunities
- 3.2.3.1 Personalized product development at scale
- 3.2.3.2 Data-driven design optimization
- 3.2.1 Growth drivers
- 3.3 Growth potential analysis
- 3.4 Future market trends
- 3.5 Technology and innovation landscape
- 3.5.1 Current technological trends
- 3.5.2 Emerging technologies
- 3.6 Price trends
- 3.6.1 By equipment type
- 3.6.2 Raw material cost
- 3.7 Regulatory landscape
- 3.7.1 Standards and compliance requirements
- 3.7.2 Regional regulatory frameworks
- 3.7.3 Certification standards
- 3.8 Porter's analysis
- 3.9 PESTEL analysis
Chapter 4 Competitive Landscape, 2024
- 4.1 Introduction
- 4.2 Company market share analysis
- 4.2.1 By region
- 4.2.1.1 North America
- 4.2.1.2 Europe
- 4.2.1.3 Asia Pacific
- 4.2.1.4 Latin America
- 4.2.1.5 Middle East and Africa
- 4.2.1 By region
- 4.3 Company matrix analysis
- 4.4 Competitive analysis of major market players
- 4.5 Competitive positioning matrix
- 4.6 Key developments
- 4.6.1 Mergers & acquisitions
- 4.6.2 Partnerships & collaborations
- 4.6.3 New product launches
- 4.6.4 Expansion plans
Chapter 5 Market Estimates and Forecast, By Technology Type, 2021 - 2034 (USD Billion) (Units)
- 5.1 Key trends
- 5.2 Physics-based digital twins
- 5.3 Data-driven digital twins
- 5.4 Hybrid digital twins
- 5.5 Reduced order models
Chapter 6 Market Estimates and Forecast, By Deployment Model, 2021 - 2034 (USD Billion) (Units)
- 6.1 Key trends
- 6.2 Cloud-based digital twins
- 6.3 Edge computing digital twins
- 6.4 Hybrid cloud-edge
- 6.5 Others (on-premises etc.)
Chapter 7 Market Estimates and Forecast, By Application, 2021 - 2034 (USD Billion) (Units)
- 7.1 Key trends
- 7.2 Virtual prototyping & design validation
- 7.3 Manufacturing process optimization
- 7.4 Predictive maintenance & lifecycle management
- 7.5 Personalization & mass customization
- 7.6 Supply chain & sustainability tracking
Chapter 8 Market Estimates and Forecast, By End Use Industry, 2021 - 2034 (USD Billion) (Units)
- 8.1 Key trends
- 8.2 Consumer electronics
- 8.2.1 Smartphone & wearable device
- 8.2.2 IoT device integration
- 8.2.3 Performance testing & reliability
- 8.2.4 User experience simulation
- 8.3 Automotive
- 8.3.1 Electric vehicle component
- 8.3.2 Autonomous vehicle system integration
- 8.3.3 Battery management system
- 8.4 Fashion & apparel
- 8.4.1 Virtual garment design
- 8.4.2 Material behavior simulation
- 8.5 Home appliances
- 8.6 Others (semiconductor & hardware etc.)
Chapter 9 Market Estimates and Forecast, By Region, 2021 - 2034 (USD Billion) (Units)
- 9.1 Key trends
- 9.2 North America
- 9.2.1 U.S.
- 9.2.2 Canada
- 9.3 Europe
- 9.3.1 Germany
- 9.3.2 UK
- 9.3.3 France
- 9.3.4 Spain
- 9.3.5 Italy
- 9.4 Asia Pacific
- 9.4.1 China
- 9.4.2 Japan
- 9.4.3 India
- 9.4.4 Australia
- 9.4.5 South Korea
- 9.5 Latin America
- 9.5.1 Brazil
- 9.5.2 Mexico
- 9.5.3 Argentina
- 9.6 Middle East and Africa
- 9.6.1 South Africa
- 9.6.2 Saudi Arabia
- 9.6.3 UAE
Chapter 10 Company Profiles
- 10.1 Akselos
- 10.2 Altair
- 10.3 Amazon Web Services
- 10.4 Ansys
- 10.5 AVEVA
- 10.6 Bentley
- 10.7 Bosch
- 10.8 Cosmo Tech
- 10.9 Dassault
- 10.10 Hexagon
- 10.11 IBM
- 10.12 Microsoft
- 10.13 PTC
- 10.14 SAP
- 10.15 Siemens
 消費性電子及電器產品市場-全球產業規模、佔有率、趨勢、機會及預測:按類型、應用、通路、地區及競爭格局分類,2021-2031年消費性電子零售市場-全球產業規模、佔有率、趨勢、機會與預測:按零售通路、應用、通路、地區和競爭對手分類,2021-2031年
 家用電子電器觸控顯示模組市場(按觸控技術、面板類型、顯示尺寸和應用分類)—全球預測,2026-2032年電子雨傘市場:依產品類型、技術、應用、最終用戶、通路分類,全球預測(2026-2032年)
 3C電子塗料市場規模、佔有率及成長分析(按產品類型、應用、功能和地區分類)-產業預測(2026-2033年)
 奢侈電子手錶市場規模、佔有率、成長及全球產業分析:依類型、應用和地區劃分的洞察,以及2024-2032年預測
 印尼家用電器市場
 消費性電子產品用熱塑性聚氨酯(TPU):全球市場佔有率和排名、總收入和需求預測(2025-2031年)馬來西亞家電市場
 2032 年可修復和模組化小工具市場預測:按產品類型、可修復性等級、銷售管道和地區進行的全球分析