


 |
市場調查報告書
商品編碼
1858817
最後一公里配送車輛市場機會、成長促進因素、產業趨勢分析及預測(2025-2034年)Last Mile Delivery Vehicle Market Opportunity, Growth Drivers, Industry Trend Analysis, and Forecast 2025 - 2034 |
||||||
2024 年全球最後一公里配送車輛市場價值為 1,641 億美元,預計到 2034 年將以 7.6% 的複合年成長率成長至 3,334 億美元。
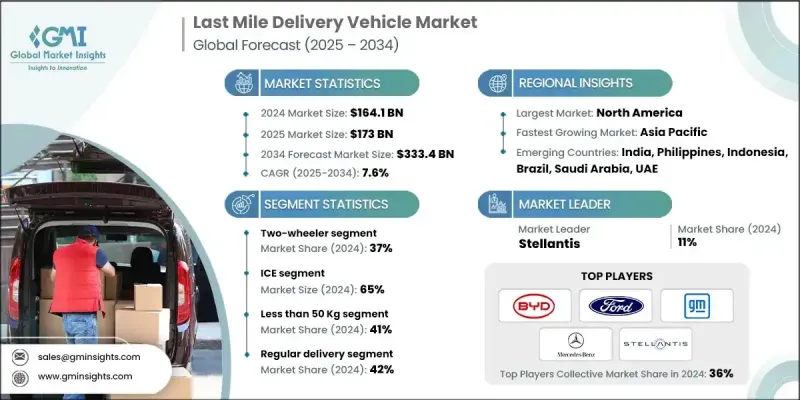
電子商務的蓬勃發展、城市化進程的加速以及對快速配送需求的日益成長,正在改變市場格局。小型卡車、輕型商用貨車、三輪車和貨運二輪車等車輛正幫助服務提供者提升配送速度、應對堵塞路況並降低燃油和維護成本。即時車輛追蹤、先進的遠端資訊處理技術和預測性維護是營運商最佳化營運績效的關鍵工具。策略性佈局的加油站和配送中心也提高了車輛利用率,最大限度地減少了車輛閒置時間。隨著消費者行為傾向於更快、更靈活的選擇,市場參與者正在迅速調整,以滿足城市中心和郊區不斷成長的物流需求。
| 市場範圍 | |
|---|---|
| 起始年份 | 2024 |
| 預測年份 | 2025-2034 |
| 起始值 | 1641億美元 |
| 預測值 | 3334億美元 |
| 複合年成長率 | 7.6% |
儘管疫情期間製造業受到衝擊,但線上零售的激增卻大幅提升了對配送車隊的投資。訂閱式租賃、遠端診斷和車隊共享解決方案正蓬勃發展,以確保靈活性和營運可靠性。醫療保健、食品雜貨和電商配送需求的成長推動了小型配送車輛的廣泛應用。營運商和原始設備製造商(OEM)正在將物聯網平台、微出行創新和智慧車隊系統融入車輛中,以簡化物流並支援城市交通策略。
2024年,二輪車市佔率達到37%,預計到2034年將以6.8%的複合年成長率成長。這些車輛因其價格實惠、在交通堵塞中快速穿梭以及營運成本低廉而被廣泛使用。食品配送、包裹物流和雜貨配送等行業的企業仍然傾向於使用自行車和踏板車進行短途出行。在亞太等地區,由於成本優勢和更便利的操控性,二輪車仍然佔據主導地位。隨著電動二輪車的普及,營運商也開始優先考慮車隊的永續性和低排放。
2024年,內燃機(ICE)汽車市佔率達到65%,預計到2034年將以7.1%的複合年成長率成長。由於續航里程更長、加油更快、有效載荷能力強,內燃機汽車仍深受車隊營運商的青睞。內燃機車型供應充足,並有全球基礎設施支持,使其成為日常大批量配送的理想選擇,尤其適用於充電網路覆蓋有限的地區。
預計到2024年,常規配送服務市佔率將達到42%。此領域涵蓋包裹、食品雜貨和家居用品等日常物流服務。其穩定成長得益於持續的需求、可預測的配送路線以及消費者對定期配送的普遍依賴。企業之所以青睞定期配送,是因為其成本效益高且路線規劃更便捷,這也使得該領域在車輛利用率方面始終處於領先地位。
2024年,美國末端配送車輛市場規模將達535億美元,佔85%的市場。其領先地位得益於完善的電子商務生態系統和對綠色交通日益成長的投資。主要物流供應商正積極部署電動貨車、貨運自行車和電動三輪車,作為其永續配送策略的一部分。政府政策,包括針對電動車的稅收減免和補貼計劃,正在加速車隊電氣化進程,並鼓勵營運商從燃油車過渡到電動車型。
全球末端配送車輛產業的主要參與者包括塔塔汽車、賓士、GreenPower Motor、Stellantis、Rivian、通用汽車、Mahindra Electric、福特、Xos 和比亞迪。為了在末端配送車輛市場站穩腳跟,各公司正致力於融合電氣化、數位化和靈活的商業模式。他們正對電池技術、即時車輛智慧和互聯平台進行策略性投資,以最佳化車隊營運。領先的製造商正在推出專為短程配送設計的電動車,同時與物流公司合作進行試點部署。遠端資訊處理系統正被整合到車輛中,用於預測性維護和路線最佳化。此外,訂閱模式和車輛租賃方案也正在推出,以吸引尋求可擴展、低成本進入配送服務的中小企業和零工經濟從業者。
目錄
第1章:方法論
- 市場範圍和定義
- 研究設計
- 研究方法
- 資料收集方法
- 資料探勘來源
- 全球的
- 地區/國家
- 基準估算和計算
- 基準年計算
- 市場估算的關鍵趨勢
- 初步研究和驗證
- 原始資料
- 預測模型
- 研究假設和局限性
第2章:執行概要
第3章:行業洞察
- 產業生態系分析
- 供應商格局
- 利潤率分析
- 成本結構
- 每個階段的價值增加
- 影響價值鏈的因素
- 中斷
- 產業影響因素
- 成長促進因素
- 電子商務和當日送達的成長
- 政府激勵措施和城市低排放政策
- 城市人口成長與交通堵塞
- 電池技術和快速充電解決方案的進步。
- 產業陷阱與挑戰
- 車輛和基礎設施的前期投資額很高。
- 充電基礎設施有限,車輛續航里程也有限。
- 市場機遇
- 電氣化和混合動力汽車的普及率上升。
- 互聯車隊管理解決方案需求激增。
- 來自亞太和拉丁美洲等新興市場的需求成長。
- 物流供應商與汽車製造商之間以永續發展為重點的合作關係日益增多。
- 成長促進因素
- 成長潛力分析
- 監管環境
- 北美洲
- 歐洲
- 亞太地區
- 拉丁美洲
- 中東和非洲
- 波特的分析
- PESTEL 分析
- 技術與創新格局
- 當前技術趨勢
- 新興技術
- 價格趨勢
- 按地區
- 依產品
- 生產統計
- 生產中心
- 消費中心
- 進出口
- 成本細分分析
- 專利分析
- 永續性和環境方面
- 永續實踐
- 減少廢棄物策略
- 生產中的能源效率
- 環保舉措
- 碳足跡考量
- 市場採納統計數據
- 電動送貨車部署率
- 車隊電氣化進展
- 充電基礎設施建設
- 技術特性採納
- 區域採用模式
- 客戶滿意度指標
- 營運績效衡量
- 電子商務與配送市場整合
- 線上零售成長的影響
- 最後一公里配送車輛需求分析
- 配送速度和效率要求
- 顧客期望的演變
- 旺季需求管理
- 城市配送密度最佳化
- 永續性消費者偏好
- 投資環境分析
- 汽車製造商投資
- 車隊營運商資本配置
- 政府基礎建設資金
- 私人充電網路投資
- 創投於配送技術
- 依投資類型進行投資報酬率分析
- 綠色債券和永續融資
- 客戶行為分析
- 車隊營運商決策因素
- 車輛選擇標準
- 技術採納偏好
- 總擁有成本優先級
- 服務和支援要求
- 永續發展承諾的影響
- 區域偏好差異
- 商業模式演變
- 傳統汽車銷售模式
- 車輛即服務 (VaaS) 模型
- 租賃和融資解決方案
- 整合車隊解決方案
- 收費即服務模式
- 績效合約
- 性能和品質標準
- 商用車性能指標
- 電池性能和耐用性
- 充電速度和效率
- 可靠性和可用性標準
- 安全要求
- 環境績效標準
- 風險評估框架
- 技術採用風險
- 電池效能和衰減風險
- 充電基礎設施可用性風險
- 監理合規風險
- 市場需求波動
- 供應鏈中斷風險
- 競爭性技術風險
第4章:競爭格局
- 介紹
- 公司市佔率分析
- 北美洲
- 歐洲
- 亞太地區
- 拉丁美洲
- MEA
- 主要市場參與者的競爭分析
- 競爭定位矩陣
- 戰略展望矩陣
- 關鍵進展
- 併購
- 合作夥伴關係與合作
- 新產品發布
- 擴張計劃和資金
第5章:市場估價與預測:依車輛類型分類,2021-2034年
- 主要趨勢
- 二輪車
- 自行車/自行車
- 踏板車
- 摩托車
- 三輪車
- 自動人力車
- 三輪車
- 輕型商用三輪車
- 四輪車
- 微型商用車
- 輕型商用車(LCV)
- 中型商用車
- 專業四輪車
- 微型移動性
- 個人出行
- 貨物微型移動
第6章:市場估算與預測:依最終用途分類,2021-2034年
- 主要趨勢
- 物流與運輸服務
- 零售和電子商務公司
- 餐飲服務及餐飲業
- 醫療保健和製藥業
- 政府及公共服務
- 公用事業和現場服務
- 其他
第7章:市場估算與預測:依酬載能力分類,2021-2034年
- 主要趨勢
- 不足50公斤
- 50-500公斤
- 500-1500公斤
- 超過1500公斤
第8章:市場估算與預測:以交付方式分類,2021-2034年
- 主要趨勢
- 定期配送
- 當日送達
- 快遞
第9章:市場估算與預測:以推進方式分類,2021-2034年
- 主要趨勢
- 冰
- 電的
- 混合
第10章:市場估計與預測:依地區分類,2021-2034年
- 主要趨勢
- 北美洲
- 美國
- 加拿大
- 歐洲
- 德國
- 英國
- 法國
- 義大利
- 西班牙
- 俄羅斯
- 北歐
- 亞太地區
- 中國
- 印度
- 日本
- 澳洲
- 韓國
- 菲律賓
- 印尼
- 拉丁美洲
- 巴西
- 墨西哥
- 阿根廷
- MEA
- 南非
- 沙烏地阿拉伯
- 阿拉伯聯合大公國
第11章:公司簡介
- 全球參與者
- Arrival Limited
- BYD
- Ford
- General Motors
- GreenPower Motor Company
- Mercedes-Benz
- Nissan
- Rivian
- Stellantis
- Workhorse
- 區域玩家
- Bollinger Motors
- Canoo
- Chanje Energy
- Isuzu Motors
- Lightning eMotors
- Mahindra Electric
- Renault
- Tata Motors
- Volkswagen
- 新興參與者
- Alke
- Cenntro Electric
- Einride
- Goupil
- SEA Electric
- StreetScooter
- Tevva Motors
- Volta Trucks
- Xos
The Global Last Mile Delivery Vehicle Market was valued at USD 164.1 billion in 2024 and is estimated to grow at a CAGR of 7.6% to reach USD 333.4 billion by 2034.
Rising e-commerce activity, dense urbanization, and increasing demand for rapid delivery are transforming the market landscape. Vehicles like small trucks, light commercial vans, three-wheelers, and cargo two-wheelers are helping service providers enhance delivery speed, navigate traffic, and cut down on fuel and maintenance costs. Real-time vehicle tracking, advanced telematics, and predictive maintenance are key tools operators are turning to for optimizing performance. Strategically located refueling stations and depot hubs are also improving vehicle utilization and minimizing idle time. With consumer behavior favoring faster and more flexible options, market players are adapting quickly to meet growing logistics expectations in city centers and suburban areas alike.
| Market Scope | |
|---|---|
| Start Year | 2024 |
| Forecast Year | 2025-2034 |
| Start Value | $164.1 Billion |
| Forecast Value | $333.4 Billion |
| CAGR | 7.6% |
Despite manufacturing disruptions during the pandemic, the surge in online retail has sharply increased investments in delivery vehicle fleets. Subscription-based leasing, remote diagnostics, and fleet-sharing solutions are gaining momentum to ensure flexibility and operational reliability. Growing demand for healthcare, food, grocery, and e-commerce deliveries has driven the widespread use of compact delivery vehicles. Operators and OEMs are now embedding IoT platforms, micro-mobility innovations, and intelligent fleet systems to streamline logistics and support urban transportation strategies.
The two-wheeler segment held a 37% share in 2024 and is projected to grow at a CAGR of 6.8% through 2034. These vehicles are widely used due to their affordability, quick navigation in traffic, and low operating costs. Businesses involved in food delivery, parcel logistics, and grocery distribution continue to favor bikes and scooters for short-distance trips. In regions like Asia Pacific, they remain dominant due to cost advantages and easier maneuverability. With electric variants gaining traction, operators are also prioritizing sustainability and low emissions across fleets.
The internal combustion engines (ICE) segment held a 65% share in 2024 and is expected to grow at a CAGR of 7.1% through 2034. These vehicles remain favored by fleet operators thanks to their longer range, quick refueling, and strong payload capacity. ICE models are widely available and supported by global infrastructure, making them ideal for high-volume daily deliveries, especially in areas with limited charging networks.
The regular delivery services segment accounted for a 42% share in 2024. This segment includes routine logistics such as parcels, groceries, and household items. Its steady growth is driven by recurring demand, predictable delivery routes, and widespread consumer reliance on scheduled shipments. Companies prefer regular delivery schedules for their cost-effectiveness and easier route planning, keeping the segment at the forefront of vehicle utilization.
U.S. Last Mile Delivery Vehicle Market generated USD 53.5 billion in 2024 and held an 85% share. Its leadership is supported by a well-developed e-commerce ecosystem and increasing investment in green transportation. Major logistics providers are actively deploying electric vans, cargo bikes, and e-trikes as part of sustainable delivery strategies. Government policies, including tax breaks and grant programs for EVs, are accelerating fleet electrification and encouraging operators to transition from ICE to electric models.
Key players active in the Global Last Mile Delivery Vehicle Industry include Tata Motors, Mercedes-Benz, GreenPower Motor, Stellantis, Rivian, General Motors, Mahindra Electric, Ford, Xos, and BYD. To secure a stronger foothold in the last mile delivery vehicle market, companies are focusing on a mix of electrification, digitalization, and flexible business models. Strategic investments are being made in battery technology, real-time vehicle intelligence, and connected platforms to optimize fleet operations. Leading manufacturers are rolling out purpose-built EVs designed for short-haul deliveries, while also partnering with logistics firms for pilot deployments. Telematics systems are being integrated for predictive maintenance and route optimization. Subscription models and vehicle leasing plans are also being introduced to attract SMEs and gig-economy drivers looking for scalable, low-cost entry into delivery services.
Table of Contents
Chapter 1 Methodology
- 1.1 Market scope and definition
- 1.2 Research design
- 1.2.1 Research approach
- 1.2.2 Data collection methods
- 1.3 Data mining sources
- 1.3.1 Global
- 1.3.2 Regional/Country
- 1.4 Base estimates and calculations
- 1.4.1 Base year calculation
- 1.4.2 Key trends for market estimation
- 1.5 Primary research and validation
- 1.5.1 Primary sources
- 1.6 Forecast model
- 1.7 Research assumptions and limitations
Chapter 2 Executive Summary
- 2.1 Industry 3600 synopsis, 2021 - 2034
- 2.2 Key market trends
- 2.2.1 Regional
- 2.2.2 Vehicle
- 2.2.3 Payload Capacity
- 2.2.4 End Use
- 2.2.5 Delivery Mode
- 2.2.6 Propulsion
- 2.3 TAM Analysis, 2025-2034
- 2.4 CXO perspectives: Strategic imperatives
- 2.4.1 Executive decision points
- 2.4.2 Critical success factors
- 2.5 Future outlook and strategic recommendations
Chapter 3 Industry Insights
- 3.1 Industry ecosystem analysis
- 3.1.1 Supplier landscape
- 3.1.2 Profit margin analysis
- 3.1.3 Cost structure
- 3.1.4 Value addition at each stage
- 3.1.5 Factor affecting the value chain
- 3.1.6 Disruptions
- 3.2 Industry impact forces
- 3.2.1 Growth drivers
- 3.2.1.1 Growth of e-commerce & same-day deliveries
- 3.2.1.2 Government incentives & urban low-emission policies
- 3.2.1.3 Urban population growth & traffic congestion
- 3.2.1.4 Advancements in battery technology and fast-charging solutions.
- 3.2.2 Industry pitfalls & challenges
- 3.2.2.1 High initial investment in vehicles and infrastructure.
- 3.2.2.2 Limited charging infrastructure and restricted vehicle range.
- 3.2.3 Market opportunities
- 3.2.3.1 Rise in electrification and hybrid vehicle adoption.
- 3.2.3.2 Surge in connected fleet management solutions.
- 3.2.3.3 Rise in demand from emerging markets like Asia-Pacific and Latin America.
- 3.2.3.4 Increase in sustainability-focused partnerships between logistics providers and OEMs.
- 3.2.1 Growth drivers
- 3.3 Growth potential analysis
- 3.4 Regulatory landscape
- 3.4.1 North America
- 3.4.2 Europe
- 3.4.3 Asia Pacific
- 3.4.4 Latin America
- 3.4.5 Middle East & Africa
- 3.5 Porter's analysis
- 3.6 PESTEL analysis
- 3.7 Technology and Innovation landscape
- 3.7.1 Current technological trends
- 3.7.2 Emerging technologies
- 3.8 Price trends
- 3.8.1 By region
- 3.8.2 By product
- 3.9 Production statistics
- 3.9.1 Production hubs
- 3.9.2 Consumption hubs
- 3.9.3 Export and import
- 3.10 Cost breakdown analysis
- 3.11 Patent analysis
- 3.12 Sustainability and environmental aspects
- 3.12.1 Sustainable practices
- 3.12.2 Waste reduction strategies
- 3.12.3 Energy efficiency in production
- 3.12.4 Eco-friendly initiatives
- 3.12.5 Carbon footprint considerations
- 3.13 Market adoption statistics
- 3.13.1 Electric delivery vehicle deployment rates
- 3.13.2 Fleet electrification progress
- 3.13.3 Charging infrastructure development
- 3.13.4 Technology feature adoption
- 3.13.5 Regional adoption patterns
- 3.13.6 Customer satisfaction metrics
- 3.13.7 Operational performance measurements
- 3.14 E-commerce & delivery market integration
- 3.14.1 Online retail growth impact
- 3.14.2 Last mile delivery vehicle demand analysis
- 3.14.3 Delivery speed & efficiency requirements
- 3.14.4 Customer expectation evolution
- 3.14.5 Peak season demand management
- 3.14.6 Urban delivery density optimization
- 3.14.7 Sustainability consumer preferences
- 3.15 Investment landscape analysis
- 3.15.1 Vehicle manufacturer investment
- 3.15.2 Fleet operator capital allocation
- 3.15.3 Government infrastructure funding
- 3.15.4 Private charging network investment
- 3.15.5 Venture capital in delivery technology
- 3.15.6 ROI analysis by investment type
- 3.15.7 Green bond & sustainable financing
- 3.16 Customer behavior analysis
- 3.16.1 Fleet operator decision factors
- 3.16.2 Vehicle selection criteria
- 3.16.3 Technology adoption preferences
- 3.16.4 Total cost of ownership priorities
- 3.16.5 Service & support requirements
- 3.16.6 Sustainability commitment influence
- 3.16.7 Regional preference variations
- 3.17 Business model evolution
- 3.17.1 Traditional vehicle sales models
- 3.17.2 Vehicle-as-a-service (VaaS) models
- 3.17.3 Leasing & financing solutions
- 3.17.4 Integrated fleet solutions
- 3.17.5 Charging-as-a-service models
- 3.17.6 Performance-based contracting
- 3.18 Performance & quality standards
- 3.18.1 Commercial vehicle performance metrics
- 3.18.2 Battery performance & durability
- 3.18.3 Charging speed & efficiency
- 3.18.4 Reliability & availability standards
- 3.18.5 Safety & security requirements
- 3.18.6 Environmental performance standards
- 3.19 Risk assessment framework
- 3.19.1 Technology adoption risks
- 3.19.2 Battery performance & degradation risks
- 3.19.3 Charging infrastructure availability risks
- 3.19.4 Regulatory compliance risks
- 3.19.5 Market demand volatility
- 3.19.6 Supply chain disruption risks
- 3.19.7 Competitive technology risks
Chapter 4 Competitive Landscape, 2024
- 4.1 Introduction
- 4.2 Company market share analysis
- 4.2.1 North America
- 4.2.2 Europe
- 4.2.3 Asia Pacific
- 4.2.4 LATAM
- 4.2.5 MEA
- 4.3 Competitive analysis of major market players
- 4.4 Competitive positioning matrix
- 4.5 Strategic outlook matrix
- 4.6 Key developments
- 4.6.1 Mergers & acquisitions
- 4.6.2 Partnerships & collaborations
- 4.6.3 New Product Launches
- 4.6.4 Expansion Plans and funding
Chapter 5 Market Estimates & Forecast, By Vehicle, 2021-2034 ($Bn, Units)
- 5.1 Key trends
- 5.2 Two-Wheeler
- 5.2.1 Bikes/Bicycles
- 5.2.2 Scooters
- 5.2.3 Motorcycles
- 5.3 Three-Wheeler
- 5.3.1 Auto Rickshaws
- 5.3.2 Tricycles
- 5.3.3 Light Commercial Three-Wheelers
- 5.4 Four-Wheeler
- 5.41 Micro Commercial Vehicles
- 5.4.2 Light Commercial Vehicles (LCV)
- 5.4.3 Medium Commercial Vehicles
- 5.4.4 Specialized Four-Wheelers
- 5.5 Micro Mobility
- 5.5.1 Personal Mobility
- 5.5.2 Cargo Micro Mobility
Chapter 6 Market Estimates & Forecast, By End Use, 2021-2034 ($Bn, Units)
- 6.1 Key trends
- 6.2 Logistics & Transportation Services
- 6.3 Retail & E-commerce Companies
- 6.4 Food Service & Restaurant Industry
- 6.5 Healthcare & Pharmaceutical Industry
- 6.6 Government & Public Services
- 6.7 Utilities & Field Services
- 6.8 Others
Chapter 7 Market Estimates & Forecast, By Payload Capacity, 2021-2034 ($Bn, Units)
- 7.1 Key trends
- 7.2 Less than 50 Kg
- 7.3 50-500 Kg
- 7.4 500- 1500 Kg
- 7.5 More than 1500 Kg
Chapter 8 Market Estimates & Forecast, By Delivery Mode, 2021-2034 ($Bn, Units)
- 8.1 Key trends
- 8.2 Regular Delivery
- 8.3 Same-Day Delivery
- 8.4 Express Delivery
Chapter 9 Market Estimates & Forecast, By Propulsion, 2021-2034 ($Bn, Units)
- 9.1 Key trends
- 9.2 ICE
- 9.3 Electric
- 9.4 Hybrid
Chapter 10 Market Estimates & Forecast, By Region, 2021 - 2034 ($Bn, Units)
- 10.1 Key trends
- 10.2 North America
- 10.2.1 US
- 10.2.2 Canada
- 10.3 Europe
- 10.3.1 Germany
- 10.3.2 UK
- 10.3.3 France
- 10.3.4 Italy
- 10.3.5 Spain
- 10.3.6 Russia
- 10.3.7 Nordics
- 10.4 Asia Pacific
- 10.4.1 China
- 10.4.2 India
- 10.4.3 Japan
- 10.4.4 Australia
- 10.4.5 South Korea
- 10.4.6 Philippines
- 10.4.7 Indonesia
- 10.5 Latin America
- 10.5.1 Brazil
- 10.5.2 Mexico
- 10.5.3 Argentina
- 10.6 MEA
- 10.6.1 South Africa
- 10.6.2 Saudi Arabia
- 10.6.3 UAE
Chapter 11 Company Profiles
- 11.1 Global Players
- 11.1.1 Arrival Limited
- 11.1.2 BYD
- 11.1.3 Ford
- 11.1.4 General Motors
- 11.1.5 GreenPower Motor Company
- 11.1.6 Mercedes-Benz
- 11.1.7 Nissan
- 11.1.8 Rivian
- 11.1.9 Stellantis
- 11.1.10 Workhorse
- 11.2 Regional Players
- 11.2.1 Bollinger Motors
- 11.2.2 Canoo
- 11.2.3 Chanje Energy
- 11.2.4 Isuzu Motors
- 11.2.5 Lightning eMotors
- 11.2.6 Mahindra Electric
- 11.2.7 Renault
- 11.2.8 Tata Motors
- 11.2.9 Volkswagen
- 11.3 Emerging Players
- 11.3.1 Alke
- 11.3.2 Cenntro Electric
- 11.3.3 Einride
- 11.3.4 Goupil
- 11.3.5 SEA Electric
- 11.3.6 StreetScooter
- 11.3.7 Tevva Motors
- 11.3.8 Volta Trucks
- 11.3.9 Xos
 2026-2030年全球最後一公里配送市場
 法國最後一公里配送:市場佔有率分析、產業趨勢與統計、成長預測(2026-2031)
 日本最後一公里配送市場規模、佔有率、趨勢及預測(按服務類型、技術、應用和地區分類,2026-2034年)
 2032年全球自動駕駛城市最後一公里配送市場預測:按車輛類型、經營模式、企業規模、技術、最終用戶和地區分類的分析全球都市區最後100公尺配送市場:未來預測(至2032年)-依車輛類型、配送範圍、配送方式、企業規模、技術、最終用戶及地區進行分析
 末端配送市場:依服務類型、車輛類型、配送方式及應用程式劃分-全球預測至2035年
 最後一公里配送市場規模、佔有率和成長分析(按配送方式、目的地、服務類型、車輛類型、營運類型、應用和地區分類)-2026-2033年產業預測2032年末端物流市場預測:按配送類型、車輛類型、履約模式、技術、最終用戶和地區分類的全球分析2032年末端配送機器人市場預測:全球分析(按產品、車輛類型、續航里程、負載容量、自主程度、應用、最終用戶和地區分類)
 食品低溫運輸最後一公里配送市場(依運輸方式、服務類型、溫度範圍、配送類型和最終用戶分類)-全球預測,2025-2032年