


 |
市場調查報告書
商品編碼
1844289
電動最後一哩配送車輛市場機會、成長動力、產業趨勢分析及 2025 - 2034 年預測Electric Last Mile Delivery Vehicle Market Opportunity, Growth Drivers, Industry Trend Analysis, and Forecast 2025 - 2034 |
||||||
2024 年全球電動最後一哩外送車輛市場價值為 213 億美元,預計到 2034 年將以 18.3% 的複合年成長率成長至 1035 億美元。
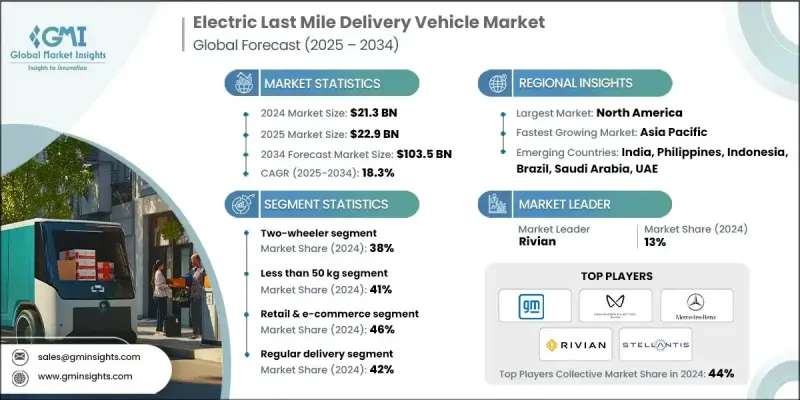
推動這一成長的因素包括:對環保城市配送方案的需求不斷成長、排放法規日益嚴格以及電子商務活動日益活躍。小型貨車、小型貨運三輪車和輕型自行車等電動配送車輛正成為車隊營運商不可或缺的一部分,他們致力於提高配送效率,同時降低排放和維護成本。減少城市排放的監管壓力也迫使車隊營運商轉向電動貨車、混合動力卡車和緊湊型配送車輛。基於人工智慧的預測性維護、基於物聯網的車輛追蹤以及先進的遠端資訊處理等技術正成為最佳化車隊性能和減少車輛停機時間的關鍵。快速充電和電池更換系統等充電基礎設施創新也在支援交通繁忙的城市環境中延長配送班次方面發揮關鍵作用。電動微型交通工具在零售、醫療保健物流和食品雜貨配送的應用日益增多,尤其是在人口密集的城市環境中,這極大地促進了市場格局的發展。
| 市場範圍 | |
|---|---|
| 起始年份 | 2024 |
| 預測年份 | 2025-2034 |
| 起始值 | 213億美元 |
| 預測值 | 1035億美元 |
| 複合年成長率 | 18.3% |
2024年,電動二輪車市場佔了38%的市場佔有率,預計到2034年將以18%的複合年成長率成長。這類車輛因其價格實惠、操控靈活以及在擁擠的城市環境中易於操作而特別吸引人。新創公司和小型配送企業青睞電動二輪車,因為它們運作成本低,並且在短途路線上配送速度更快。電動二輪車體積小巧,能夠在交通密集的地區順暢行駛,幫助企業最大限度地提高配送速度和效率。
2024年,設計載重低於50公斤的車輛佔有率為41%。城市擁塞以及對靈活、低成本物流解決方案的需求推動了輕型車輛(例如緊湊型踏板車和三輪車)的普及。這些車輛對基礎設施的要求極低,由於電池容量較小,前期投入和運行成本也較低,是小型零售商和大型電商企業在排放管制區域最佳化最後一哩配送業務的首選。
美國電動最後一哩配送車輛市場佔86%的市場佔有率,2024年市場規模達68億美元。聯邦政府的電動車激勵措施、城市配送基礎設施的改善以及強勁的電商活動等因素正在推動市場向前發展。電氣化、車隊數位化以及基於人工智慧的路線規劃和即時追蹤等智慧技術的投資正在進一步推動該行業的發展。車隊營運商擴大利用這些工具來降低營運成本並提高最後一哩網路的能源效率。
全球電動最後一哩送貨車市場的一些領先公司包括馬恆達電氣、Xos、塔塔汽車、福特汽車公司、梅賽德斯-奔馳、Rivian、比亞迪、GreenPower 汽車公司、Stellantis 和通用汽車。為了擴大影響力,電動最後一哩送貨車領域的主要公司正專注於多項策略性舉措。這些措施包括與電子商務平台、物流公司和政府機構建立策略聯盟和合作夥伴關係,以支持大規模電氣化。許多公司都在加大研發投入,以推出具有改進的電池性能、更大的續航里程和更智慧的遠端資訊處理系統的新型電動車。此外,他們正在擴大生產能力以滿足不斷成長的需求,同時也與充電基礎設施供應商合作部署快速充電和電池更換解決方案。原始設備製造商也強調整合人工智慧和物聯網的數位車隊管理工具,以實現預測性維護和營運效率,幫助他們向車隊客戶提供增值服務並提高品牌忠誠度。
目錄
第1章:方法論
- 市場範圍和定義
- 研究設計
- 研究方法
- 資料收集方法
- 資料探勘來源
- 全球的
- 地區/國家
- 基礎估算與計算
- 基準年計算
- 市場評估的主要趨勢
- 初步研究和驗證
- 主要來源
- 預測模型
- 研究假設和局限性
第 2 章:執行摘要
第3章:行業洞察
- 產業生態系統分析
- 供應商格局
- 利潤率分析
- 成本結構
- 每個階段的增值
- 影響價值鏈的因素
- 中斷
- 產業衝擊力
- 成長動力
- 電子商務需求和網上購物增加。
- 政府激勵措施和排放法規激增。
- 都市化進程加快,低排放區擴大。
- 燃料和維修成本降低,從而節省成本。
- 電池技術和快速充電解決方案的進步。
- 產業陷阱與挑戰
- 車輛和基礎設施的初始投資較高。
- 充電基礎設施有限,車輛行駛里程受限。
- 市場機會
- 物流公司擴大車隊電氣化計畫。
- 將再生能源融入充電基礎設施。
- 新興城市市場的需求上升。
- 貨運自行車和微型移動解決方案的採用量激增。
- 人工智慧、物聯網和遠端資訊處理整合在車隊最佳化方面的成長。
- 成長動力
- 成長潛力分析
- 監管格局
- 北美洲
- 歐洲
- 亞太地區
- 拉丁美洲
- 中東和非洲
- 波特的分析
- PESTEL分析
- 技術和創新格局
- 當前的技術趨勢
- 新興技術
- 價格趨勢
- 按地區
- 按產品
- 生產統計
- 生產中心
- 消費中心
- 匯出和匯入
- 成本分解分析
- 專利分析
- 永續性和環境方面
- 永續實踐
- 減少廢棄物的策略
- 生產中的能源效率
- 環保舉措
- 碳足跡考慮
- 市場採用統計數據
- 電動送貨車部署率
- 車隊電氣化進展
- 充電基礎設施建設
- 技術特性採用
- 區域採用模式
- 客戶滿意度指標
- 營運績效衡量
- 電子商務與配送市場整合
- 線上零售成長的影響
- 最後一哩配送需求分析
- 配送速度及效率要求
- 顧客期望的演變
- 旺季需求管理
- 城市配送密度最佳化
- 永續性消費者偏好
- 投資格局分析
- 汽車製造商投資
- 車隊營運商資本配置
- 政府基礎建設資金
- 私人充電網路投資
- 配送技術領域的創投
- 以投資類型進行的投資報酬率分析
- 綠色債券和永續融資
- 客戶行為分析
- 車隊營運商決策因素
- 車輛選擇標準
- 科技採用偏好
- 總擁有成本優先級
- 服務和支援要求
- 永續發展承諾的影響
- 區域偏好差異
- 商業模式演變
- 傳統汽車銷售模式
- 車輛即服務(VaaS)模式
- 租賃和融資解決方案
- 綜合車隊解決方案
- 充電即服務模式
- 基於績效的合約
- 性能和品質標準
- 商用車性能指標
- 電池性能和耐用性
- 充電速度和效率
- 可靠性和可用性標準
- 安全與安保要求
- 環境績效標準
- 風險評估框架
- 技術採用風險
- 電池效能和退化風險
- 充電基礎設施可用性風險
- 監理合規風險
- 市場需求波動
- 供應鏈中斷風險
- 競爭技術風險
第4章:競爭格局
- 介紹
- 公司市佔率分析
- 北美洲
- 歐洲
- 亞太地區
- 拉丁美洲
- 多邊環境協定
- 主要市場參與者的競爭分析
- 競爭定位矩陣
- 戰略展望矩陣
- 關鍵進展
- 併購
- 夥伴關係與合作
- 新產品發布
- 擴張計劃和資金
第5章:市場估計與預測:依車型,2021-2034
- 主要趨勢
- 二輪車
- 電動自行車/自行車
- 電動滑板車
- 電動摩托車
- 三輪車
- 電動人力車
- 電動三輪車
- 輕型商用三輪車
- 四輪車
- 微型商用車
- 輕型商用車(LCV)
- 中型商用車
- 專業四輪車
- 微型移動出行
- 個人出行
- 貨運微型移動
- 二輪車
第6章:市場估計與預測:按應用,2021-2034
- 主要趨勢
- 零售與電子商務
- 食品和雜貨配送
- 醫療保健和製藥
- 郵件和包裹
- 其他
第7章:市場估計與預測:依酬載容量,2021-2034
- 主要趨勢
- 少於50公斤
- 50至500公斤
- 500公斤以上
第 8 章:市場估計與預測:按交付方式,2021-2034 年
- 主要趨勢
- 定期送貨
- 當日送達
- 快遞
第9章:市場估計與預測:依電池容量,2021-2034
- 主要趨勢
- 低於30度
- 30-70度
- 70度以上
第 10 章:市場估計與預測:按地區,2021-2034 年
- 主要趨勢
- 北美洲
- 美國
- 加拿大
- 歐洲
- 德國
- 英國
- 法國
- 義大利
- 西班牙
- 俄羅斯
- 北歐人
- 亞太地區
- 中國
- 印度
- 日本
- 澳洲
- 韓國
- 菲律賓
- 印尼
- 拉丁美洲
- 巴西
- 墨西哥
- 阿根廷
- 多邊環境協定
- 南非
- 沙烏地阿拉伯
- 阿拉伯聯合大公國
第 11 章:公司簡介
- 全球參與者
- Arrival
- Ford Motor Company
- General Motors
- GreenPower Motor Company
- Mercedes-Benz
- Nissan Motor Company
- Rivian
- Stellantis
- Workhorse
- BYD
- 區域參與者
- Bollinger Motors
- Canoo
- Chanje Energy
- Isuzu Motors
- Lightning eMotors
- Mahindra Electric
- Renault
- Tata Motors
- Volkswagen Commercial Vehicles
- 新興玩家
- Alke
- Cenntro Electric
- Einride
- Goupil
- SEA Electric
- StreetScooter
- Tevva Motors
- Volta Trucks
- Xos
The Global Electric Last Mile Delivery Vehicle Market was valued at USD 21.3 billion in 2024 and is estimated to grow at a CAGR of 18.3% to reach USD 103.5 billion by 2034.
Several dynamics are fueling this surge, including the rising demand for eco-friendly urban delivery options, stricter emissions regulations, and the accelerating pace of e-commerce activity. Electric delivery vehicles such as small vans, compact cargo trikes, and lightweight bikes are becoming integral to fleet operators aiming to enhance delivery efficiency while reducing emissions and maintenance costs. Regulatory pressure to reduce urban emissions is also compelling fleet operators to switch to electric vans, hybrid trucks, and compact delivery vehicles. Technologies like predictive maintenance powered by AI, IoT-based vehicle tracking, and advanced telematics are becoming central to optimizing fleet performance and reducing vehicle downtime. Charging infrastructure innovations like fast depot charging and battery swapping systems are also playing a critical role in supporting extended delivery shifts in traffic-heavy urban environments. The rising use of electric micro-mobility for retail, healthcare logistics, and grocery delivery, especially in dense urban settings, is significantly boosting the market landscape.
| Market Scope | |
|---|---|
| Start Year | 2024 |
| Forecast Year | 2025-2034 |
| Start Value | $21.3 Billion |
| Forecast Value | $103.5 Billion |
| CAGR | 18.3% |
In 2024, the electric two-wheelers segment held a 38% share and is expected to grow at a CAGR of 18% through 2034. These vehicles are particularly attractive due to their affordability, maneuverability, and operational ease within congested city environments. Startups and small delivery businesses favor electric two-wheelers for their low operating costs and faster delivery capabilities across shorter routes. Their compact size enables smooth navigation through traffic-dense areas, helping businesses maximize delivery speed and efficiency.
The segment of vehicles designed to carry less than 50 kilograms held a 41% share in 2024. Urban congestion and the need for flexible, low-cost logistics solutions have driven the adoption of lightweight vehicles such as compact scooters and three-wheelers. These vehicles require minimal infrastructure, offer lower upfront and running costs due to smaller battery capacities, and are a preferred choice for both small retailers and major e-commerce firms seeking to optimize last-mile delivery operations in emission-regulated zones.
United States Electric Last-Mile Delivery Vehicle Market held an 86% share and generated USD 6.8 billion in 2024. Factors such as federal EV incentives, improved urban delivery infrastructure, and robust e-commerce activity are propelling the market forward. Investments in electrification, fleet digitization, and smart technologies such as route planning through AI and real-time tracking are further advancing the sector. Fleet operators are increasingly leveraging these tools to reduce operational costs and improve energy efficiency across last-mile networks.
Some of the leading companies in the Global Electric Last-Mile Delivery Vehicle Market include Mahindra Electric, Xos, Tata Motors, Ford Motor Company, Mercedes-Benz, Rivian, BYD, GreenPower Motor Company, Stellantis, and General Motors. To expand their presence, major companies in the electric last-mile delivery vehicle sector are focusing on several strategic initiatives. These include forming strategic alliances and partnerships with e-commerce platforms, logistics firms, and government bodies to support large-scale electrification. Many are ramping up investments in R&D to introduce new electric vehicle models with improved battery performance, extended range, and smarter telematics systems. Additionally, they are scaling up production capabilities to meet growing demand, while also collaborating with charging infrastructure providers to deploy fast-charging and battery-swapping solutions. OEMs also emphasizing digital fleet management tools that integrate AI and IoT for predictive maintenance and operational efficiency, helping them deliver value-added services to fleet customers and increase brand loyalty.
Table of Contents
Chapter 1 Methodology
- 1.1 Market scope and definition
- 1.2 Research design
- 1.2.1 Research approach
- 1.2.2 Data collection methods
- 1.3 Data mining sources
- 1.3.1 Global
- 1.3.2 Regional/Country
- 1.4 Base estimates and calculations
- 1.4.1 Base year calculation
- 1.4.2 Key trends for market estimation
- 1.5 Primary research and validation
- 1.5.1 Primary sources
- 1.6 Forecast model
- 1.7 Research assumptions and limitations
Chapter 2 Executive Summary
- 2.1 Industry 3600 synopsis, 2021 - 2034
- 2.2 Key market trends
- 2.2.1 Regional
- 2.2.2 Vehicle
- 2.2.3 Payload Capacity
- 2.2.4 Application
- 2.2.5 Delivery Mode
- 2.2.6 Battery Capacity
- 2.3 TAM Analysis, 2025-2034
- 2.4 CXO perspectives: Strategic imperatives
- 2.4.1 Executive decision points
- 2.4.2 Critical success factors
- 2.5 Future outlook and strategic recommendations
Chapter 3 Industry Insights
- 3.1 Industry ecosystem analysis
- 3.1.1 Supplier landscape
- 3.1.2 Profit margin analysis
- 3.1.3 Cost structure
- 3.1.4 Value addition at each stage
- 3.1.5 Factor affecting the value chain
- 3.1.6 Disruptions
- 3.2 Industry impact forces
- 3.2.1 Growth drivers
- 3.2.1.1 Increase in e-commerce demand and online shopping.
- 3.2.1.2 Surge in government incentives and emission regulations.
- 3.2.1.3 Growth in urbanization and expansion of low-emission zones.
- 3.2.1.4 Rise in cost savings from lower fuel and maintenance.
- 3.2.1.5 Advancements in battery technology and fast-charging solutions.
- 3.2.2 Industry pitfalls & challenges
- 3.2.2.1 High initial investment in vehicles and infrastructure.
- 3.2.2.2 Limited charging infrastructure and restricted vehicle range.
- 3.2.3 Market opportunities
- 3.2.3.1 Expansion of fleet electrification programs by logistics companies.
- 3.2.3.2 Integration of renewable energy into charging infrastructure.
- 3.2.3.3 Rise in demand from emerging urban markets.
- 3.2.3.4 Surge in adoption of cargo bikes and micro-mobility solutions.
- 3.2.3.5 Growth in AI, IoT, and telematics integration for fleet optimization.
- 3.2.1 Growth drivers
- 3.3 Growth potential analysis
- 3.4 Regulatory landscape
- 3.4.1 North America
- 3.4.2 Europe
- 3.4.3 Asia Pacific
- 3.4.4 Latin America
- 3.4.5 Middle East & Africa
- 3.5 Porter’s analysis
- 3.6 PESTEL analysis
- 3.7 Technology and Innovation landscape
- 3.7.1 Current technological trends
- 3.7.2 Emerging technologies
- 3.8 Price trends
- 3.8.1 By region
- 3.8.2 By product
- 3.9 Production statistics
- 3.9.1 Production hubs
- 3.9.2 Consumption hubs
- 3.9.3 Export and import
- 3.10 Cost breakdown analysis
- 3.11 Patent analysis
- 3.12 Sustainability and environmental aspects
- 3.12.1 Sustainable practices
- 3.12.2 Waste reduction strategies
- 3.12.3 Energy efficiency in production
- 3.12.4 Eco-friendly initiatives
- 3.12.5 Carbon footprint considerations
- 3.13 Market adoption statistics
- 3.13.1 Electric delivery vehicle deployment rates
- 3.13.2 Fleet electrification progress
- 3.13.3 Charging infrastructure development
- 3.13.4 Technology feature adoption
- 3.13.5 Regional adoption patterns
- 3.13.6 Customer satisfaction metrics
- 3.13.7 Operational performance measurements
- 3.14 E-commerce & delivery market integration
- 3.14.1 Online retail growth impact
- 3.14.2 Last mile delivery demand analysis
- 3.14.3 Delivery speed & efficiency requirements
- 3.14.4 Customer expectation evolution
- 3.14.5 Peak season demand management
- 3.14.6 Urban delivery density optimization
- 3.14.7 Sustainability consumer preferences
- 3.15 Investment landscape analysis
- 3.15.1 Vehicle manufacturer investment
- 3.15.2 Fleet operator capital allocation
- 3.15.3 Government infrastructure funding
- 3.15.4 Private charging network investment
- 3.15.5 Venture capital in delivery technology
- 3.15.6 ROI analysis by investment type
- 3.15.7 Green bond & sustainable financing
- 3.16 Customer behavior analysis
- 3.16.1 Fleet operator decision factors
- 3.16.2 Vehicle selection criteria
- 3.16.3 Technology adoption preferences
- 3.16.4 Total cost of ownership priorities
- 3.16.5 Service & support requirements
- 3.16.6 Sustainability commitment influence
- 3.16.7 Regional preference variations
- 3.17 Business model evolution
- 3.17.1 Traditional vehicle sales models
- 3.17.2 Vehicle-as-a-service (VaaS) models
- 3.17.3 Leasing & financing solutions
- 3.17.4 Integrated fleet solutions
- 3.17.5 Charging-as-a-service models
- 3.17.6 Performance-based contracting
- 3.18 Performance & quality standards
- 3.18.1 Commercial vehicle performance metrics
- 3.18.2 Battery performance & durability
- 3.18.3 Charging speed & efficiency
- 3.18.4 Reliability & availability standards
- 3.18.5 Safety & security requirements
- 3.18.6 Environmental performance standards
- 3.19 Risk assessment framework
- 3.19.1 Technology adoption risks
- 3.19.2 Battery performance & degradation risks
- 3.19.3 Charging infrastructure availability risks
- 3.19.4 Regulatory compliance risks
- 3.19.5 Market demand volatility
- 3.19.6 Supply chain disruption risks
- 3.19.7 Competitive technology risks
Chapter 4 Competitive Landscape, 2024
- 4.1 Introduction
- 4.2 Company market share analysis
- 4.2.1 North America
- 4.2.2 Europe
- 4.2.3 Asia Pacific
- 4.2.4 LATAM
- 4.2.5 MEA
- 4.3 Competitive analysis of major market players
- 4.4 Competitive positioning matrix
- 4.5 Strategic outlook matrix
- 4.6 Key developments
- 4.6.1 Mergers & acquisitions
- 4.6.2 Partnerships & collaborations
- 4.6.3 New Product Launches
- 4.6.4 Expansion Plans and funding
Chapter 5 Market Estimates & Forecast, By Vehicle, 2021-2034 ($Bn, Units)
- 5.1 Key trends
- 5.1.1 Two-Wheeler
- 5.1.1.1 E-Bikes/Bicycles
- 5.1.1.2 E-Scooters
- 5.1.1.3 E-Motorcycles
- 5.1.2 Three-Wheeler
- 5.1.2.1 E-Auto Rickshaws
- 5.1.2.2 E-Tricycles
- 5.1.2.3 Light Commercial Three-Wheelers
- 5.1.3 Four-Wheeler
- 5.1.3.1 Micro Commercial Vehicles
- 5.1.3.2 Light Commercial Vehicles (LCV)
- 5.1.3.3 Medium Commercial Vehicles
- 5.1.3.4 Specialized Four-Wheelers
- 5.1.4 Micro Mobility
- 5.1.4.1 Personal Mobility
- 5.1.4.2 Cargo Micro Mobility
- 5.1.1 Two-Wheeler
Chapter 6 Market Estimates & Forecast, By Application, 2021-2034 ($Bn, Units)
- 6.1 Key trends
- 6.2 Retail & E-commerce
- 6.3 Food & Grocery Delivery
- 6.4 Healthcare & Pharmaceuticals
- 6.5 Mails and Packages
- 6.6 Others
Chapter 7 Market Estimates & Forecast, By Payload Capacity, 2021-2034 ($Bn, Units)
- 7.1 Key trends
- 7.2 Less than 50 kg
- 7.3 50 to 500 kg
- 7.4 Above 500 kg
Chapter 8 Market Estimates & Forecast, By Delivery Mode, 2021-2034 ($Bn, Units)
- 8.1 Key trends
- 8.2 Regular Delivery
- 8.3 Same-Day Delivery
- 8.4 Express Delivery
Chapter 9 Market Estimates & Forecast, By Battery Capacity, 2021-2034 ($Bn, Units)
- 9.1 Key trends
- 9.2 Below 30 kWh
- 9.3 30-70 kWh
- 9.4 Above 70 kWh
Chapter 10 Market Estimates & Forecast, By Region, 2021-2034 ($Bn, Units)
- 10.1 Key trends
- 10.2 North America
- 10.2.1 US
- 10.2.2 Canada
- 10.3 Europe
- 10.3.1 Germany
- 10.3.2 UK
- 10.3.3 France
- 10.3.4 Italy
- 10.3.5 Spain
- 10.3.6 Russia
- 10.3.7 Nordics
- 10.4 Asia Pacific
- 10.4.1 China
- 10.4.2 India
- 10.4.3 Japan
- 10.4.4 Australia
- 10.4.5 South Korea
- 10.4.6 Philippines
- 10.4.7 Indonesia
- 10.5 Latin America
- 10.5.1 Brazil
- 10.5.2 Mexico
- 10.5.3 Argentina
- 10.6 MEA
- 10.6.1 South Africa
- 10.6.2 Saudi Arabia
- 10.6.3 UAE
Chapter 11 Company Profiles
- 11.1 Global Players
- 11.1.1 Arrival
- 11.1.2 Ford Motor Company
- 11.1.3 General Motors
- 11.1.4 GreenPower Motor Company
- 11.1.5 Mercedes-Benz
- 11.1.6 Nissan Motor Company
- 11.1.7 Rivian
- 11.1.8 Stellantis
- 11.1.9 Workhorse
- 11.1.10 BYD
- 11.2 Regional Players
- 11.2.1 Bollinger Motors
- 11.2.2 Canoo
- 11.2.3 Chanje Energy
- 11.2.4 Isuzu Motors
- 11.2.5 Lightning eMotors
- 11.2.6 Mahindra Electric
- 11.2.7 Renault
- 11.2.8 Tata Motors
- 11.2.9 Volkswagen Commercial Vehicles
- 11.3 Emerging Players
- 11.3.1 Alke
- 11.3.2 Cenntro Electric
- 11.3.3 Einride
- 11.3.4 Goupil
- 11.3.5 SEA Electric
- 11.3.6 StreetScooter
- 11.3.7 Tevva Motors
- 11.3.8 Volta Trucks
- 11.3.9 Xos
 2026-2030年全球最後一公里配送市場
 法國最後一公里配送:市場佔有率分析、產業趨勢與統計、成長預測(2026-2031)
 日本最後一公里配送市場規模、佔有率、趨勢及預測(按服務類型、技術、應用和地區分類,2026-2034年)
 2032年全球自動駕駛城市最後一公里配送市場預測:按車輛類型、經營模式、企業規模、技術、最終用戶和地區分類的分析全球都市區最後100公尺配送市場:未來預測(至2032年)-依車輛類型、配送範圍、配送方式、企業規模、技術、最終用戶及地區進行分析
 末端配送市場:依服務類型、車輛類型、配送方式及應用程式劃分-全球預測至2035年
 最後一公里配送市場規模、佔有率和成長分析(按配送方式、目的地、服務類型、車輛類型、營運類型、應用和地區分類)-2026-2033年產業預測2032年末端物流市場預測:按配送類型、車輛類型、履約模式、技術、最終用戶和地區分類的全球分析2032年末端配送機器人市場預測:全球分析(按產品、車輛類型、續航里程、負載容量、自主程度、應用、最終用戶和地區分類)
 最後一公里配送車輛市場機會、成長促進因素、產業趨勢分析及預測(2025-2034年)