


 |
市場調查報告書
商品編碼
1740768
即食海鮮零食市場機會、成長動力、產業趨勢分析及 2025 - 2034 年預測Ready To Eat Seafood Snacks Market Opportunity, Growth Drivers, Industry Trend Analysis, and Forecast 2025 - 2034 |
||||||
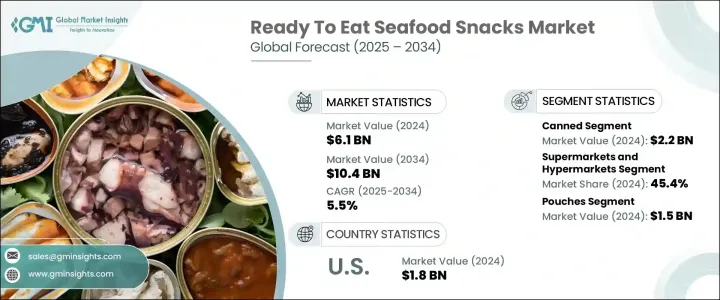
2024年,全球即食海鮮零食市場規模達61億美元,預計到2034年將以5.5%的複合年成長率成長,達到104億美元,這得益於全球對營養豐富、高蛋白、便攜零食日益成長的需求。隨著越來越多的消費者養成更健康的飲食習慣,海鮮零食作為傳統零食的營養豐富替代品,正迅速受到消費者的青睞。這些產品富含瘦蛋白、ω-3脂肪酸和必需營養素,使其成為尋求清潔標籤食品以促進整體健康的消費者的首選。消費者對功能性和便利性食品的消費趨勢正在塑造零食產業的新時代,健康益處和成分透明度在消費者的購買決策中發揮關鍵作用。
如今,消費者追求的不僅是美味,他們更注重健康,更符合清潔飲食和注重健康的生活方式。即食海鮮零食剛好滿足了這項需求,既方便又營養,同時又不犧牲口感。無論是健身後恢復體力、午間補給,還是旅途中的快速小吃,海鮮零食都能提供便利的解決方案,兼具高效性和便攜性。這不僅是一股健康熱潮,更是消費者價值觀變化的體現,永續性、原料品質和透明度比以往任何時候都更重要。這促使各大品牌不斷創新,專注於不含防腐劑、來源可靠且環保的產品線。
| 市場範圍 | |
|---|---|
| 起始年份 | 2024 |
| 預測年份 | 2025-2034 |
| 起始值 | 61億美元 |
| 預測值 | 104億美元 |
| 複合年成長率 | 5.5% |
健康零食產品的支出持續成長,推動了整個海鮮零食市場的蓬勃發展。消費者更青睞保存期限長、方便攜帶的產品,尤其是不含人工添加劑的產品。儘管各大品牌面臨原料價格波動、環境問題以及其他健康零食形式激烈競爭等挑戰,但市場需求仍然強勁。北美和歐洲憑藉其較高的健康意識和強大的零售基礎設施,繼續引領全球市場。同時,亞太地區正在快速追趕,城鎮化進程和海鮮消費的不斷成長刺激了市場需求,尤其是在大都市地區。
光是海鮮罐頭零食一項,2024年的銷售額就高達22億美元,並維持該品類的領先地位。它們的吸引力在於其無與倫比的便利性、持久的保存期限和多功能性。消費者欣賞海鮮罐頭如何輕鬆融入各種用餐場合,從獨立的零食到可直接用於烹飪的食材。隨著越來越多的人尋求清潔標籤產品,不含雙酚A的包裝和低鈉配方等特性已成為領先品牌的強大差異化優勢。
2024年,超市和大賣場佔銷售額的45.4%,佔據了分銷市場的主導地位。這些零售通路憑藉其廣泛的產品曝光度、極具競爭力的價格以及強大的促銷支持,對於實現主流應用至關重要。美國即食海鮮零食市場在2024年達到18億美元,預計2034年將以7%的複合年成長率成長。隨著人們對功能性、高蛋白和永續零食的需求不斷成長,各大品牌紛紛推出美食創新產品,例如海鮮乾、煙燻魚條和風味薯片。包括Empire Foods、Bumble Bee Foods、Apex Frozen Foods和Avanti Feeds Limited在內的主要參與者正在擴大產品組合,推出優質的清潔標籤產品,同時改進包裝並與零售商合作,透過全通路策略最大限度地擴大覆蓋範圍。
目錄
第1章:方法論與範圍
第2章:執行摘要
第3章:行業洞察
- 產業生態系統分析
- 影響價值鏈的因素
- 利潤率分析
- 中斷
- 未來展望
- 製造商
- 經銷商
- 川普政府關稅
- 對貿易的影響
- 貿易量中斷
- 報復措施
- 對產業的影響
- 供給側影響(原料)
- 主要材料價格波動
- 供應鏈重組
- 生產成本影響
- 需求面影響(售價)
- 價格傳導至終端市場
- 市佔率動態
- 消費者反應模式
- 供給側影響(原料)
- 受影響的主要公司
- 策略產業反應
- 供應鏈重組
- 定價和產品策略
- 政策參與
- 展望與未來考慮
- 對貿易的影響
- 貿易統計(HS編碼)
- 2021-2024年主要出口國
- 2021-2024年主要進口國
註:以上貿易統計僅針對重點國家。
- 供應商格局
- 利潤率分析
- 重要新聞和舉措
- 監管格局
- 衝擊力
- 成長動力
- 消費者對富含蛋白質的健康零食的偏好日益增加。
- 對方便、便攜的海鮮零食產品的需求不斷成長。
- 人們越來越意識到海鮮零食的營養價值。
- 產業陷阱與挑戰
- 在環境問題和法規的背景下採購永續海鮮。
- 成長動力
- 成長潛力分析
- 波特的分析
- PESTEL分析
第4章:競爭格局
- 介紹
- 公司市佔率分析
- 競爭定位矩陣
- 戰略展望矩陣
第5章:市場估計與預測:按產品,2021 - 2034 年
- 主要趨勢
- 罐裝
- 《冰雪奇緣》
- 冷藏
- 其他(燻製等)
第6章:市場估計與預測:按配銷通路,2021 - 2034 年
- 主要趨勢
- 超市和大賣場
- 便利商店
- 網路零售
- 餐飲服務
- 專賣店
第7章:市場估計與預測:依包裝類型,2021 - 2034 年
- 主要趨勢
- 袋裝
- 罐頭
- 塑膠容器
- 托盤和盒子
第8章:市場估計與預測:按地區,2021 - 2034 年
- 主要趨勢
- 北美洲
- 美國
- 加拿大
- 歐洲
- 德國
- 英國
- 法國
- 西班牙
- 義大利
- 俄羅斯
- 亞太地區
- 中國
- 印度
- 日本
- 澳洲
- 韓國
- 拉丁美洲
- 巴西
- 墨西哥
- 阿根廷
- 中東和非洲
- 沙烏地阿拉伯
- 南非
- 阿拉伯聯合大公國
第9章:公司簡介
- Thai Union Group (Thailand)
- Maruha Nichiro Corporation (Japan)
- Bumble Bee Foods (USA)
- Stavis Seafoods (USA)
- Nomad Foods (UK)
- Gorton's (USA)
- Pacific Seafood (USA)
- Apex Frozen Foods
- Empire Foods
- Avanti Feeds Limited
The Global Ready To Eat Seafood Snacks Market was valued at USD 6.1 billion in 2024 and is estimated to grow at a CAGR of 5.5% to reach USD 10.4 billion by 2034, driven by a growing global appetite for nutritious, high-protein, and portable snacking options. As more consumers adopt healthier eating habits, seafood snacks are rapidly gaining popularity as a nutrient-dense alternative to traditional snacks. These products are packed with lean protein, omega-3 fatty acids, and essential nutrients, making them a top choice for individuals seeking clean-label foods that support overall wellness. The shift toward functional and convenient foods is shaping a new era in the snacking category, where health benefits and ingredient transparency play key roles in purchase decisions.
Consumers today want more than just flavor-they are demanding better-for-you options that align with clean eating and wellness-focused lifestyles. Ready-to-eat seafood snacks hit that sweet spot by offering both convenience and nutrition without compromising on taste. Whether it is for post-gym recovery, midday fuel, or quick travel bites, seafood-based snacks offer an easy solution that delivers on performance and portability. The trend isn't just a health craze-it's a reflection of changing consumer values, where sustainability, ingredient quality, and transparency matter more than ever. This has pushed brands to innovate, focusing on preservative-free, responsibly sourced, and eco-friendly product lines.
| Market Scope | |
|---|---|
| Start Year | 2024 |
| Forecast Year | 2025-2034 |
| Start Value | $6.1 Billion |
| Forecast Value | $10.4 Billion |
| CAGR | 5.5% |
Spending on health-forward snack products continues to rise, encouraging growth across the seafood snack segment. Consumers gravitate toward items with extended shelf life and portability, especially when they're free from artificial additives. Although brands face hurdles like volatile raw material prices, environmental concerns, and stiff competition from other healthy snack formats, the demand remains strong. North America and Europe continue to lead the global market due to high health awareness and strong retail infrastructure. Meanwhile, Asia Pacific is catching up fast, with urbanization and rising seafood consumption fueling demand, especially in metropolitan areas.
Canned seafood snacks alone generated USD 2.2 billion in 2024 and maintain a commanding lead within the category. Their appeal lies in their unmatched convenience, long shelf stability, and versatility. Consumers appreciate how easily canned seafood fits into various eating occasions, from standalone snacks to recipe-ready ingredients. As more people seek clean-label products, features like BPA-free packaging and low-sodium formulations have become powerful differentiators for leading brands.
Supermarkets and hypermarkets accounted for 45.4% of sales in 2024, dominating the distribution landscape. These retail channels are essential for mainstream adoption thanks to wide product visibility, competitive pricing, and strong promotional support. The United States Ready-To-Eat Seafood Snacks Market reached USD 1.8 billion in 2024 and is projected to grow at a CAGR of 7% through 2034. As demand grows for functional, protein-rich, and sustainable snack options, brands are responding with gourmet innovations like seafood jerky, smoked fish strips, and flavored chips. Key players including Empire Foods, Bumble Bee Foods, Apex Frozen Foods, and Avanti Feeds Limited are expanding portfolios with premium, clean-label offerings while enhancing packaging and partnering with retailers to maximize reach through omnichannel strategies.
Table of Contents
Chapter 1 Methodology and Scope
- 1.1 Market scope and definition
- 1.2 Base estimates and calculations
- 1.3 Forecast calculation
- 1.4 Data sources
- 1.4.1 Primary
- 1.4.2 Secondary
- 1.4.2.1 Paid sources
- 1.4.2.2 Public sources
- 1.5 Primary research and validation
- 1.5.1 Primary sources
- 1.5.2 Data mining sources
Chapter 2 Executive Summary
- 2.1 Industry synopsis, 2021 - 2034
Chapter 3 Industry Insights
- 3.1 Industry ecosystem analysis
- 3.1.1 Factor affecting the value chain
- 3.1.2 Profit margin analysis
- 3.1.3 Disruptions
- 3.1.4 Future outlook
- 3.1.5 Manufacturers
- 3.1.6 Distributors
- 3.2 Trump administration tariffs
- 3.2.1 Impact on trade
- 3.2.1.1 Trade volume disruptions
- 3.2.1.2 Retaliatory measures
- 3.2.2 Impact on the industry
- 3.2.2.1 Supply-side impact (raw materials)
- 3.2.2.1.1 Price volatility in key materials
- 3.2.2.1.2 Supply chain restructuring
- 3.2.2.1.3 Production cost implications
- 3.2.2.2 Demand-side impact (selling price)
- 3.2.2.2.1 Price transmission to end markets
- 3.2.2.2.2 Market share dynamics
- 3.2.2.2.3 Consumer response patterns
- 3.2.2.1 Supply-side impact (raw materials)
- 3.2.3 Key companies impacted
- 3.2.4 Strategic industry responses
- 3.2.4.1 Supply chain reconfiguration
- 3.2.4.2 Pricing and product strategies
- 3.2.4.3 Policy engagement
- 3.2.5 Outlook and future considerations
- 3.2.1 Impact on trade
- 3.3 Trade statistics (HS Code)
- 3.3.1 Major exporting countries, 2021-2024 (Kilo Tons)
- 3.3.2 Major importing countries, 2021-2024 (Kilo Tons)
Note: the above trade statistics will be provided for key countries only.
- 3.4 Supplier landscape
- 3.5 Profit margin analysis
- 3.6 Key news and initiatives
- 3.7 Regulatory landscape
- 3.8 Impact forces
- 3.8.1 Growth drivers
- 3.8.1.1 Increasing consumer preference for protein-rich, healthy snack options.
- 3.8.1.2 Rising demand for convenient, on-the-go seafood-based snack products.
- 3.8.1.3 Growing awareness of the nutritional benefits of seafood snacks.
- 3.8.2 Industry pitfalls and challenges
- 3.8.2.1 Sourcing sustainable seafood amidst environmental concerns and regulations.
- 3.8.1 Growth drivers
- 3.9 Growth potential analysis
- 3.10 Porter's analysis
- 3.11 PESTEL analysis
Chapter 4 Competitive Landscape, 2024
- 4.1 Introduction
- 4.2 Company market share analysis
- 4.3 Competitive positioning matrix
- 4.4 Strategic outlook matrix
Chapter 5 Market Estimates and Forecast, By Product, 2021 - 2034 (USD Million) (Kilo Tons)
- 5.1 Key trends
- 5.2 Canned
- 5.3 Frozen
- 5.4 Chilled
- 5.5 Others (smoked & etc.)
Chapter 6 Market Estimates and Forecast, By Distribution Channel, 2021 - 2034 (USD Million) (Kilo Tons)
- 6.1 Key trends
- 6.2 Supermarket & hypermarket
- 6.3 Convenience stores
- 6.4 Online retail
- 6.5 Foodservice
- 6.6 Speciality stores
Chapter 7 Market Estimates and Forecast, By Packaging Type, 2021 - 2034 (USD Million) (Kilo Tons)
- 7.1 Key trends
- 7.2 Pouches
- 7.3 Cans
- 7.4 Plastic containers
- 7.5 Trays & boxes
Chapter 8 Market Estimates and Forecast, By Region, 2021 - 2034 (USD Million) (Kilo Tons)
- 8.1 Key trends
- 8.2 North America
- 8.2.1 U.S.
- 8.2.2 Canada
- 8.3 Europe
- 8.3.1 Germany
- 8.3.2 UK
- 8.3.3 France
- 8.3.4 Spain
- 8.3.5 Italy
- 8.3.6 Russia
- 8.4 Asia Pacific
- 8.4.1 China
- 8.4.2 India
- 8.4.3 Japan
- 8.4.4 Australia
- 8.4.5 South Korea
- 8.5 Latin America
- 8.5.1 Brazil
- 8.5.2 Mexico
- 8.5.3 Argentina
- 8.6 Middle East and Africa
- 8.6.1 Saudi Arabia
- 8.6.2 South Africa
- 8.6.3 UAE
Chapter 9 Company Profiles
- 9.1 Thai Union Group (Thailand)
- 9.2 Maruha Nichiro Corporation (Japan)
- 9.3 Bumble Bee Foods (USA)
- 9.4 Stavis Seafoods (USA)
- 9.5 Nomad Foods (UK)
- 9.6 Gorton's (USA)
- 9.7 Pacific Seafood (USA)
- 9.8 Apex Frozen Foods
- 9.9 Empire Foods
- 9.10 Avanti Feeds Limited
 冷凍食品市場預測-全球分析(依產品類型、加工程度、冷凍技術、包裝、通路、最終用戶和地區分類)-2034年
 冷凍食品市場規模、佔有率、成長及全球產業分析:按類型、應用和地區的洞察,2026-2034年預測
 冷凍食品市場-全球產業規模、佔有率、趨勢、機會及預測(按產品、類型、最終用戶、分銷管道、地區和競爭格局分類,2021-2031年)
 冷凍熟食市場機會、成長動力、產業趨勢分析及 2025 - 2034 年預測冷凍食品市場機會、成長動力、產業趨勢分析及 2025 - 2034 年預測冷凍食品市場:2025-2030 年預測
 冷凍食品全球市場:各產品類型,各流通管道,各地區-市場規模,產業動態,機會分析,預測(2025年~2033年)全球冷凍熟食市場-按產品類型、通路、地區和預測分類的市場規模
 按類型、分銷管道和地區分類的冷凍食品市場
 2033 年冷凍食品市場分析與預測:按類型、產品、技術、應用、形式、材料類型、最終用戶、流程、設備