


 |
市場調查報告書
商品編碼
1699527
按資料來源、應用程式和地區分類的客戶旅程分析市場Customer Journey Analytics Market, By Data Source, By Application, By Geography |
||||||
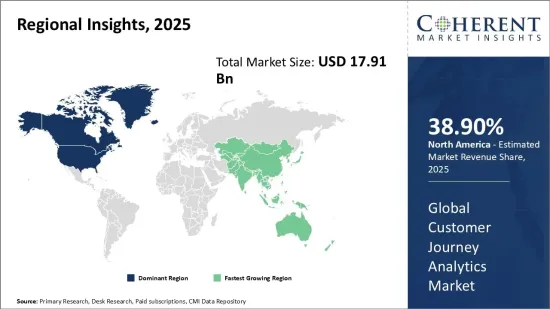
預計 2025 年全球客戶旅程分析市場價值將達到 179.1 億美元,到 2032 年將達到 470.6 億美元,2025 年至 2032 年的複合年成長率為 14.8%。
| 報告範圍 | 報告詳細資訊 | ||
|---|---|---|---|
| 基準年 | 2024 | 2025年的市場規模 | 179.1億美元 |
| 效能數據 | 從2020年到2024年 | 預測期 | 2025年至2032年 |
| 預測期:2025-2032年複合年成長率: | 14.80% | 2032年價值預測 | 470.6億美元 |
近年來,全球客戶旅程分析市場取得了巨大的成長。客戶旅程分析是指在多個管道中繪製客戶行為和互動,以獲得有關客戶如何完成購買過程的寶貴見解。數位技術的日益普及使可用的客戶資料的數量和種類呈指數級成長。公司正在使用客戶旅程分析解決方案來收集和分析大量數據,以獲得對客戶的單一視圖並發現提高滿意度的機會。不斷成長的客戶經驗改善需求、對全通路參與策略的重視以及衡量行銷支出投資回報率(ROI) 的能力是推動該市場需求的關鍵因素。然而,資料隱私法規為分析解決方案提供者帶來了一些挑戰。
市場動態:
各行各業的快速數位化正在產生大量的客戶數據,需要使用先進的技術進行處理和分析。一個主要的成長要素是擴大採用分析工具來了解客戶行為模式並推動個人化參與。然而,對資料安全的擔憂和熟練專業人員的短缺帶來了挑戰。市場先驅者正專注於開發圍繞社交媒體互動和行動應用程式使用模式的新功能。人工智慧和機器學習等新技術融入旅程分析平台也正在擴大商業機會。由於分析供應商範圍廣泛且企業快速採用,北美目前在收益佔有率方面佔據市場主導地位。然而,由於數位轉型措施的增加,亞太地區的客戶旅程分析市場正迅速獲得關注。
本研究的主要特點
本報告對全球客戶旅程分析市場進行了詳細分析,並以 2024 年為基準年,展示了預測期(2025-2032 年)的市場規模和年複合成長率(CAGR%)。
它還強調了各個領域的潛在商機,並說明了該市場的有吸引力的投資提案矩陣。
它還提供了有關市場促進因素、限制因素、機會、新產品發布和核准、市場趨勢、區域前景和主要企業採用的競爭策略的重要見解。
全球客戶旅程分析市場的主要企業是根據公司亮點、產品系列、關鍵亮點、財務績效和策略等參數進行的分析。
研究涉及的主要企業包括 Adobe Inc.、Salesforce.com, Inc.、IBM Corporation、SAP SE、Microsoft Corporation、Oracle Corporation、NICE Ltd.、Verint Systems Inc.、Pointillist、ClickFox、Kitewheel、Quadient、Thunderhead、Genesys 和 Servion Global Solutions。
本報告的見解將使負責人和公司經營團隊能夠就未來的產品發布、類型升級、市場擴張和行銷策略做出明智的決策。
全球客戶旅程分析市場報告針對該行業的各個相關人員,包括投資者、供應商、產品製造商、經銷商、新進業者和金融分析師。
可以透過用於分析全球客戶旅程分析市場的各種策略矩陣來促進相關人員的決策。
目錄
第1章 調查目的與前提條件
- 研究目標
- 先決條件
- 簡稱
第2章 市場展望
- 報告描述
- 市場定義和範圍
- 執行摘要
第3章市場動態、法規與趨勢分析
- 市場動態
- 影響分析
- 主要亮點
- 監管情景
- 產品發布/核准
- PEST分析
- 波特分析
- 市場機會
- 監管情景
- 主要進展
- 產業趨勢
4. 2020 年至 2032 年全球顧客旅程分析市場(依資料來源)
- 網路
- 社群媒體
- 智慧型手機
- 電子郵件
5. 2020 年至 2032 年全球顧客旅程分析市場(按應用分類)
- 客戶體驗管理
- 客戶細分與定位
- 品牌管理
- 其他
6. 2020 年至 2032 年全球顧客旅程分析市場(按地區)
- 北美洲
- 拉丁美洲
- 歐洲
- 亞太地區
- 中東
- 非洲
第7章競爭格局
- Adobe Inc.
- Salesforce.com, Inc.
- IBM Corporation
- SAP SE
- Microsoft Corporation
- Oracle Corporation
- NICE Ltd.
- Verint Systems Inc.
- Pointillist
- ClickFox
- Kitewheel
- Quadient
- Thunderhead
- Genesys
- Servion Global Solutions
第 8 章分析師建議
- 命運之輪
- 分析師觀點
- 一致的機會圖
第9章參考文獻與調查方法
- 參考
- 調查方法
- 關於出版商
Global Customer Journey Analytics Market is estimated to be valued at US$ 17.91 Bn in 2025 and is expected to reach US$ 47.06 Bn by 2032, growing at a compound annual growth rate (CAGR) of 14.8% from 2025 to 2032.
| Report Coverage | Report Details | ||
|---|---|---|---|
| Base Year: | 2024 | Market Size in 2025: | USD 17.91 Bn |
| Historical Data for: | 2020 To 2024 | Forecast Period: | 2025 To 2032 |
| Forecast Period 2025 to 2032 CAGR: | 14.80% | 2032 Value Projection: | USD 47.06 Bn |
The global customer journey analytics market has been gaining significant traction over the past few years. Customer journey analytics refers to mapping out customer behavior and interactions across multiple channels to gain valuable insights into how customers move through the buying process. Rising adoption of digital technologies has dramatically increased the volume and variety of customer data available. Businesses are leveraging customer journey analytics solutions to collect and analyze this huge trove of data to gain a unified view of the customer and identify opportunities to improve satisfaction levels. Growing need for enhanced customer experience, focus on omni-channel engagement strategies, and ability to measure Return on Investment (ROI) of marketing spend are some of the key factors fueling demand in this market. However, data privacy regulations pose challenges for analytics solution providers to some extent.
Market Dynamics:
Rapid digitalization across industries has created an abundance of customer data that need to be processed and analyzed using advanced technologies. Rising adoption of analytics tools to tap into customer behavioral patterns and drive personalized engagements is a major growth driver. However, data security concerns and lack of skilled professionals pose challenges. Market players are focusing on developing new capabilities around social media interactions and mobile apps usage patterns. Integration of emerging technologies, such as artificial intelligence and machine learning into journey analytics platforms, is also expanding business opportunities. North America currently dominates the market in terms of revenue share owing to a wide presence of analytics vendors and early adoption by businesses. However, the Asia Pacific customer journey analytics market is gaining traction rapidly with growing digital transformation initiatives.
Key Features of the Study:
This report provides in-depth analysis of the global customer journey analytics market, and provides market size (US$ Billion) and compound annual growth rate (CAGR%) for the forecast period (2025-2032), considering 2024 as the base year
It elucidates potential revenue opportunities across different segments and explains attractive investment proposition matrices for this market
This study also provides key insights about market drivers, restraints, opportunities, new product launches or approvals, market trends, regional outlook, and competitive strategies adopted by key players
It profiles key players in the global customer journey analytics market based on the following parameters - company highlights, products portfolio, key highlights, financial performance, and strategies
Key companies covered as a part of this study include Adobe Inc., Salesforce.com, Inc., IBM Corporation, SAP SE, Microsoft Corporation, Oracle Corporation, NICE Ltd., Verint Systems Inc., Pointillist, ClickFox, Kitewheel, Quadient, Thunderhead, Genesys, and Servion Global Solutions
Insights from this report would allow marketers and the management authorities of the companies to make informed decisions regarding their future product launches, type up-gradation, market expansion, and marketing tactics
The global customer journey analytics market report caters to various stakeholders in this industry including investors, suppliers, product manufacturers, distributors, new entrants, and financial analysts
Stakeholders would have ease in decision-making through various strategy matrices used in analyzing the global customer journey analytics market
Market Segmentation
- Data Source Insights (Revenue, USD Bn, 2020 - 2032)
- Web
- Social Media
- Mobile
- Application Insights (Revenue, USD Bn, 2020 - 2032)
- Customer Experience Management
- Customer Segmentation and Targeting
- Brand Management
- Others
- Regional Insights (Revenue, USD Bn, 2020 - 2032)
- North America
- U.S.
- Canada
- Latin America
- Brazil
- Argentina
- Mexico
- Rest of Latin America
- Europe
- Germany
- U.K.
- Spain
- France
- Italy
- Russia
- Rest of Europe
- Asia Pacific
- China
- India
- Japan
- Australia
- South Korea
- ASEAN
- Rest of Asia Pacific
- Middle East
- GCC Countries
- Israel
- Rest of Middle East
- Africa
- South Africa
- North Africa
- Central Africa
- Key Players Insights
- Adobe Inc.
- Salesforce.com, Inc.
- IBM Corporation
- SAP SE
- Microsoft Corporation
- Oracle Corporation
- NICE Ltd.
- Verint Systems Inc.
- Pointillist
- ClickFox
- Kitewheel
- Quadient
- Thunderhead
- Genesys
- Servion Global Solutions
Table of Contents
1. Research Objectives and Assumptions
- Research Objectives
- Assumptions
- Abbreviations
2. Market Purview
- Report Description
- Market Definition and Scope
- Executive Summary
- Global Customer Journey Analytics Market, By Data Source
- Global Customer Journey Analytics Market, By Application
- Global Customer Journey Analytics Market, By Region
3. Market Dynamics, Regulations, and Trends Analysis
- Market Dynamics
- Impact Analysis
- Key Highlights
- Regulatory Scenario
- Product Launches/Approvals
- PEST Analysis
- PORTER's Analysis
- Market Opportunities
- Regulatory Scenario
- Key Developments
- Industry Trends
4. Global Customer Journey Analytics Market, By Data Source, 2020-2032, (USD Bn)
- Introduction
- Market Share Analysis, 2025 and 2032 (%)
- Y-o-Y Growth Analysis, 2021 - 2032
- Segment Trends
- Web
- Introduction
- Market Size and Forecast, and Y-o-Y Growth, 2020-2032, (USD Bn)
- Social Media
- Introduction
- Market Size and Forecast, and Y-o-Y Growth, 2020-2032, (USD Bn)
- Mobile
- Introduction
- Market Size and Forecast, and Y-o-Y Growth, 2020-2032, (USD Bn)
- Email
- Introduction
- Market Size and Forecast, and Y-o-Y Growth, 2020-2032, (USD Bn)
5. Global Customer Journey Analytics Market, By Application, 2020-2032, (USD Bn)
- Introduction
- Market Share Analysis, 2025 and 2032 (%)
- Y-o-Y Growth Analysis, 2021 - 2032
- Segment Trends
- Customer Experience Management
- Introduction
- Market Size and Forecast, and Y-o-Y Growth, 2020-2032, (USD Bn)
- Customer Segmentation and Targeting
- Introduction
- Market Size and Forecast, and Y-o-Y Growth, 2020-2032, (USD Bn)
- Brand Management
- Introduction
- Market Size and Forecast, and Y-o-Y Growth, 2020-2032, (USD Bn)
- Others
- Introduction
- Market Size and Forecast, and Y-o-Y Growth, 2020-2032, (USD Bn)
6. Global Customer Journey Analytics Market, By Region, 2020 - 2032, Value (USD Bn)
- Introduction
- Market Share (%) Analysis, 2025, 2028 & 2032, Value (USD Bn)
- Market Y-o-Y Growth Analysis (%), 2021 - 2032, Value (USD Bn)
- Regional Trends
- North America
- Introduction
- Market Size and Forecast, By Data Source, 2020 - 2032, Value (USD Bn)
- Market Size and Forecast, By Application, 2020 - 2032, Value (USD Bn)
- Market Size and Forecast, By Country, 2020 - 2032, Value (USD Bn)
- U.S.
- Canada
- Latin America
- Introduction
- Market Size and Forecast, By Data Source, 2020 - 2032, Value (USD Bn)
- Market Size and Forecast, By Application, 2020 - 2032, Value (USD Bn)
- Market Size and Forecast, By Country, 2020 - 2032, Value (USD Bn)
- Brazil
- Argentina
- Mexico
- Rest of Latin America
- Europe
- Introduction
- Market Size and Forecast, By Data Source, 2020 - 2032, Value (USD Bn)
- Market Size and Forecast, By Application, 2020 - 2032, Value (USD Bn)
- Market Size and Forecast, By Country, 2020 - 2032, Value (USD Bn)
- Germany
- U.K.
- Spain
- France
- Italy
- Russia
- Rest of Europe
- Asia Pacific
- Introduction
- Market Size and Forecast, By Data Source, 2020 - 2032, Value (USD Bn)
- Market Size and Forecast, By Application, 2020 - 2032, Value (USD Bn)
- Market Size and Forecast, By Country, 2020 - 2032, Value (USD Bn)
- China
- India
- Japan
- Australia
- South Korea
- ASEAN
- Rest of Asia Pacific
- Middle East
- Introduction
- Market Size and Forecast, By Data Source, 2020 - 2032, Value (USD Bn)
- Market Size and Forecast, By Application, 2020 - 2032, Value (USD Bn)
- Market Size and Forecast, By Country, 2020 - 2032, Value (USD Bn)
- GCC Countries
- Israel
- Rest of Middle East
- Africa
- Introduction
- Market Size and Forecast, By Data Source, 2020 - 2032, Value (USD Bn)
- Market Size and Forecast, By Application, 2020 - 2032, Value (USD Bn)
- Market Size and Forecast, By Country/Region, 2020 - 2032, Value (USD Bn)
- South Africa
- North Africa
- Central Africa
7. Competitive Landscape
- Adobe Inc.
- Company Highlights
- Product Portfolio
- Key Developments
- Financial Performance
- Strategies
- Salesforce.com, Inc.
- Company Highlights
- Product Portfolio
- Key Developments
- Financial Performance
- Strategies
- IBM Corporation
- Company Highlights
- Product Portfolio
- Key Developments
- Financial Performance
- Strategies
- SAP SE
- Company Highlights
- Product Portfolio
- Key Developments
- Financial Performance
- Strategies
- Microsoft Corporation
- Company Highlights
- Product Portfolio
- Key Developments
- Financial Performance
- Strategies
- Oracle Corporation
- Company Highlights
- Product Portfolio
- Key Developments
- Financial Performance
- Strategies
- NICE Ltd.
- Company Highlights
- Product Portfolio
- Key Developments
- Financial Performance
- Strategies
- Verint Systems Inc.
- Company Highlights
- Product Portfolio
- Key Developments
- Financial Performance
- Strategies
- Pointillist
- ClickFox
- Kitewheel
- Quadient
- Thunderhead
- Genesys
- Servion Global Solutions
8. Analyst Recommendations
- Wheel of Fortune
- Analyst View
- Coherent Opportunity Map
9. References and Research Methodology
- References
- Research Methodology
- About us
 客戶旅程管理市場:按組件、部署類型、組織規模和產業分類-2026-2032年全球市場預測
 客戶旅程分析市場報告:按組件、觸點、部署類型、組織規模、應用、產業垂直領域和地區分類(2026-2034 年)
 2026年全球客戶旅程分析市場報告
 客戶旅程分析市場分析及預測(至 2035 年):按類型、產品類型、服務、技術、組件、應用、部署類型、最終用戶和解決方案分類
 全球客戶體驗分析市場規模、佔有率、趨勢和成長分析報告(2026-2034)客戶旅程分析市場規模、佔有率、成長及全球產業分析:依類型、應用和地區劃分的洞察與未來預測(2026-2034 年)
 客戶旅程分析市場 - 全球產業規模、佔有率、趨勢、機會和預測(按組件、應用、觸點、產業垂直領域、地區和競爭格局分類,2021-2031 年預測)日本客戶旅程分析市場報告:按組件、觸點、實施類型、組織規模、應用、產業和地區分類(2026-2034 年)
 客戶旅程分析市場規模、佔有率、成長分析(按組件、按組織規模、按部署模式、按資料來源、按應用、按垂直行業和按地區)—2025 年至 2032 年行業預測