


 |
市場調查報告書
商品編碼
2157039
歐洲城域緊密耦合分波多工(DWDM):市場佔有率分析、產業趨勢與統計數據以及成長預測(2026-2031 年)Europe Metro Dense Wave Division Multiplexing (DWDM) - Market Share Analysis, Industry Trends & Statistics, Growth Forecasts (2026 - 2031) |
||||||

※ 本網頁內容可能與最新版本有所差異。詳細情況請與我們聯繫。
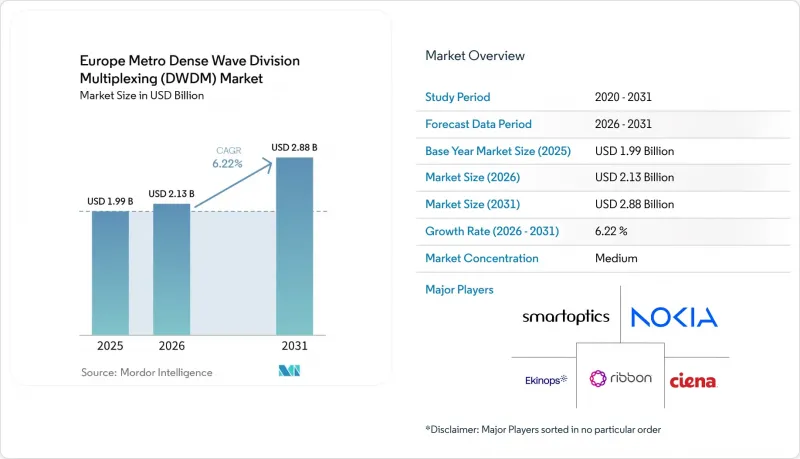
據 Mordor Intelligence 稱,2025 年歐洲城域高密度分波多工(DWDM) 市場價值為 19.9 億美元,預計到 2031 年將從 2026 年的 21.3 億美元成長至 28.8 億美元,預測期(2026-2031 年)複合年成長率為 28.2%。
歐洲城域高密度分波多工(DWDM)市場趨勢與洞察
利用雲端運算、人工智慧和視訊工作負載加速地鐵交通
雲端服務、人工智慧推理和視訊流量正在推動歐洲都會區網路頻寬需求的成長,尤其是在連接資料中心和網際網路交換中心 (IXP) 的線路上。根據 Connect Europe 統計,固定寬頻佔歐洲網路總流量的 87.5%,佔通訊投資的 46%。人工智慧流量的網路模式有所不同,它主要在城域走廊內的分散式 GPU叢集之間傳輸,而不是連接到消費者終端。這些連接需要低延遲、高容量、高密度的短距離波長,這與城域DWDM的設計概念完全契合。預計 2024 年至 2025 年間,歐盟企業人工智慧的採用率將成長 48%,這將縮短營運商擴展傳輸容量的時間。因此,當傳統的網路建設週期無法應對這些新的集中式資料流時,歐洲城域DWDM市場將從中受益。
解決 5G-Advanced xHaul 和光纖容量限制問題
隨著5G獨立組網和未來5G-Advanced部署的推進,更多無線容量將部署在更靠近用戶的位置,這要求營運商升級其中傳和去程傳輸傳傳輸網路。在人口稠密的大都會圈,由於管道空間有限且新建設耗時較長,密集波分複用(DWDM)技術可以擴展現有光纖的容量。到2025年底,歐洲的5G人口覆蓋率將達到94.9%,但在獨立組網部署和中頻寬密度方面仍落後於中國和美國。根據GSMA估計,歐洲到2035年需要4,750億歐元(5,538.4億美元)才能完成5G部署,但預計只能完成57%。 DWDM可以在單對光纖上支援超過80個波長,使其成為光纖資源匱乏地區新建土木工程專案的替代方案。為了提高光纖效率,歐洲的行動傳輸線路和上行聚合網路正在採用城域DWDM技術。
零件前置作業時間延長,對光電元件的依賴性增強。
磷化銦雷射和高速光收發器的供應狀況可能會限制城域系統的部署進度,尤其是在營運商需要新型連貫模組的情況下。草案指出,先進模組有供需缺口,預計到2026年,400G和800G設備的前置作業時間將延長。這使得800G ZR和ZR+系統(滿足成長最快的容量需求)的早期採購變得更加關鍵。營運商可能需要在計劃安裝前9-12個月訂購組件,而不是依賴傳統的即時採購和緊急交貨。即使面臨相同的部署需求,小規模的區域營運商的庫存能力也低於大型營運商和超大規模資料中心業者。這種採購柔軟性的差異可能會導致歐洲城域DWDM市場的專案延期,即使光纖、需求和部署計畫已經到位。
細分市場分析
預計到2025年,歐洲城域DWDM市場中,硬體將佔據81.37%的市場。這反映了在都市區建立光纖網路的資本密集特性。此比例反映了營運商在轉發器底盤(用於產生、引導和放大波長)、可重構光加取多工器(ROADM)、擴大機節點和連貫模組等方面的支出。無論營運商選擇何種軟體層,每增加一條新的互連路由都需要實體光纖通訊設備才能開始提供網路服務。因此,高流量都市區走廊的園區擴建和光纖升級正在推動對這些系統的需求,尤其是在現有容量已分配的區域。歐洲城域DWDM硬體市場的規模主要取決於每個端點對波長終端、放大、保護和管理的需求。
隨著網路控制日益複雜,預計到2031年,軟體市場將以9.27%的複合年成長率成長,成長速度超過整體市場。由於電信業者需要管理來自多個供應商的設備,並需要更清晰的網路視覺性,因此開放控制平面和波長自動化的重要性日益凸顯。解耦設計使軟體能夠與來自不同製造商的ROADM和放大器協同工作,從而減少對單一設備堆疊的依賴。隨著網路環境日益複雜,營運課責不斷加強,服務業對整合、網路設計、測試和波長管理支援的需求日益成長。 2025年,eww ITandTEL透過使用OcNOS-SP-PLUS和白盒硬體遷移到解耦的400G IP-over-DWDM設計,展示了這種切實可行的轉型。
至2025年,400 Gbps頻寬將佔據歐洲城域DWDM市場佔有率的31.24%,成為已公佈頻寬中性能最佳的傳輸容量。由於其高容量和成熟的供應商基礎,400 Gbps已成為資料中心匯聚和交換器連接的核心速度。具有競爭力的價格和成熟的互通性使其適用於營運商和區域營運商使用的許多開放式頻寬系統。對於大型樞紐以外的城域邊緣和行動匯聚應用而言,200 Gbps頻寬仍然至關重要,因為這些應用的流量密度和功率需求各不相同。雖然高達100 Gbps的舊有系統仍然服務於長尾城域線路和公共部門的暗纖用戶,但在新的部署中,直接遷移到400 Gbps的趨勢日益明顯。
預計到2031年,頻寬超過400 Gbps的市場將以11.58%的複合年成長率成長,成為已公佈容量頻段中成長最快的市場。歐洲城域DWDM市場這一頻寬規模的形成,正受到800G試點營運向高資料中心流量線路商業部署過渡的影響。 2026年4月法蘭克福至阿姆斯特丹核心骨幹網路的部署表明,800G正在歐洲高流量線路上進入營運階段。 OIF於2024年底最終敲定的800ZR協議,建立了一種硬體無關、可插拔的架構,從而降低了切換成本並提高了採購柔軟性。這可能會鼓勵中型業者採用該技術,因為他們可以在決定升級到更高容量之前,確保多家供應商的供貨能力。
其他好處:
- Excel格式的市場預測(ME)表
- 3個月的分析師支持
目錄
第1章:引言
- 研究假設和市場定義
- 調查範圍
第2章:調查方法
第3章執行摘要
第4章 市場狀況
- 市場概覽
- 市場促進因素
- 由於雲端運算、人工智慧和視訊工作負載,Metro 流量增加
- 升級以解決 5G-Advanced 傳輸和光纖容量限制問題。
- 透過 400G、800G 和連貫光學技術提高頻譜效率。
- FLAP-D 中心的超大規模和託管擴展。
- 開放式、解耦式、基於DWDM的IP架構
- 歐洲主權雲端和資料中心之間的互聯
- 市場限制因素
- 零件的前置作業時間很長,而且對光子元件的依賴程度很高。
- 跨境設備核准及部署相關法規零碎化
- 超大規模資料中心業者的購買力以及系統價格的下降
- 由於多家供應商,導致營運複雜且缺乏相關技能
- 產業價值鏈分析
- 監理情勢
- 技術展望
- 波特五力分析
- 宏觀經濟因素對市場的影響
第5章 市場規模與成長預測
- 按組件
- 硬體
- 軟體
- 服務
- 按輸電容量
- 最高可達 100 Gbps
- 200 Gbps
- 400 Gbps
- 400 Gbps 或更高
- 透過使用
- 資料中心之間的互連
- 行動回程傳輸和去程傳輸
- 寬頻和接取網路的聚合
- 其他用途
- 最終用戶
- 電信服務供應商
- 雲端和資料中心供應商
- 公司
- 政府/公共部門
- 國家
- 德國
- 英國
- 法國
- 義大利
- 西班牙
- 其他歐洲國家
第6章 競爭情勢
- 市場集中度
- 策略趨勢
- 市佔率分析
- 公司簡介
- Nokia Corporation
- Cisco Systems, Inc.
- Ciena Corporation
- Huawei Technologies Co., Ltd.
- ADTRAN, Inc.
- ZTE Corporation
- PacketLight Networks Ltd.
- NEC Corporation
- Corning Incorporated
- Smartoptics AS
- Ribbon Communications Inc.
- Ekinops SA
- Lumentum Holdings Inc.
- Coherent Corp.
- HUBER+SUHNER AG
- Source Photonics, Inc.
- FLXOPTIX GmbH
- IP Infusion Inc.
- Juniper Networks, Inc.
第7章 市場機會與未來展望
According to Mordor Intelligence, the Europe metro dense wave division multiplexing (DWDM) market size was valued at USD 1.99 billion in 2025 and is estimated to grow from USD 2.13 billion in 2026 to reach USD 2.88 billion by 2031, at a CAGR of 6.22% during the forecast period (2026-2031).
Europe Metro Dense Wave Division Multiplexing (DWDM) Market Trends and Insights
Accelerating Metro Traffic From Cloud, AI, and Video Workloads
Cloud services, AI inference, and video traffic are raising bandwidth requirements across European metropolitan networks, particularly on routes linking data centers and internet exchange points. Fixed broadband carried 87.5% of total internet traffic in Europe, and fixed broadband investment represented 46% of telecommunications investment, according to Connect Europe. AI traffic exhibits a different network pattern, moving between distributed GPU clusters within metro corridors rather than traveling primarily to consumer endpoints. These connections require dense, short-reach wavelengths with low latency and high capacity, which aligns directly with metropolitan DWDM design. AI adoption among European Union enterprises increased 48% from 2024 to 2025, shortening the time available for operators to add transport capacity. The Europe metro DWDM market, therefore, benefits when traditional network provisioning cycles cannot keep pace with these new, concentrated data flows.
5G-Advanced xHaul and Fiber-Exhaustion Upgrades
5G standalone networks and future 5G-Advanced deployments require operators to upgrade midhaul and fronthaul transport as more radio capacity is placed closer to users. In densely built metropolitan areas, DWDM increases capacity on existing fiber when duct space is constrained, and new construction would take longer. European 5G population coverage reached 94.9% by the end of 2025, although standalone deployment and mid-band density remained behind China and the United States. GSMA estimated that Europe needs EUR 475 billion (USD 553.84 billion) to complete its 5G journey through 2035, with only 57% of that amount expected to materialize. DWDM can support 80 or more wavelengths on a fiber pair, offering an alternative to new civil works at fiber-exhausted sites. This need for greater fiber efficiency supports deployment of European metro DWDM across mobile transport routes and upstream aggregation networks.
High Component Lead Times and Photonic Supply Dependence
Supply availability for indium phosphide lasers and high-speed optical transceivers can constrain deployment schedules for metropolitan systems, especially where operators need newer coherent modules. The draft identifies a shortfall between demand and supply for advanced modules, with longer lead times for 400G and 800G equipment during 2026. This places greater importance on early procurement for 800G ZR and ZR+ systems that serve the fastest-expanding capacity tier. Operators may need to order components 9-12 months before a planned installation rather than rely on conventional just-in-time purchasing and rapid delivery. Smaller regional carriers have less capacity to hold inventory than larger carriers and hyperscalers, even when they face the same installation requirements. The resulting difference in purchasing flexibility may delay projects in the European metro DWDM market, even where fiber, demand, and deployment plans are already in place.
Other drivers and restraints analyzed in the detailed report include:
- Higher Spectral Efficiency From 400G, 800G, and Coherent Optics
- Hyperscale and Colocation Expansion Across FLAP-D Hubs
- Fragmented Cross-Border Equipment Approval and Deployment Rules
For complete list of drivers and restraints, kindly check the Table Of Contents.
Segment Analysis
Hardware accounted for 81.37% of the Europe metro DWDM market share in 2025, reflecting the capital intensity of metropolitan optical construction. This position reflected spending on transponder chassis, reconfigurable optical add-drop multiplexers, amplifier nodes, and coherent pluggable modules that create, direct, and strengthen wavelengths. Every new interconnection route requires physical optical equipment before network services can begin, regardless of the software layer selected by the operator. Campus additions and fiber upgrades across high-traffic metropolitan corridors, therefore, sustain demand for these systems, especially where existing capacity is already committed. The European metro DWDM hardware market size is driven by the need to terminate, amplify, protect, and manage wavelengths at each endpoint.
Software is projected to grow at a 9.27% CAGR through 2031, outpacing the overall market as network control becomes more complex. Open control planes and wavelength automation are becoming more relevant as operators manage equipment from several vendors and need clearer network visibility. Disaggregated designs enable software to coordinate ROADMs and amplifiers from different manufacturers, reducing dependence on a single equipment stack. Services provide integration, network design, testing, and managed-wavelength support as network environments become more complex and operational accountability increases. In 2025, eww ITandTEL moved to a disaggregated 400G IP-over-DWDM design using OcNOS-SP-PLUS and white-box hardware, demonstrating this practical shift.
The 400 Gbps tier accounted for 31.24% of the Europe metro DWDM market share in 2025, making it the leading reported transmission capacity. It is the established core speed for data center aggregation and exchange-point connectivity because it combines high capacity with a mature supplier base. Competitive pricing and proven interoperability have made this tier suitable for many open line systems used by carriers and regional operators. The 200 Gbps tier remains relevant for metro-edge and mobile aggregation uses outside the largest hubs, where traffic density and power requirements differ. Legacy systems at up to 100 Gbps still serve long-tail metropolitan circuits and public-sector dark-fiber users, while new installations increasingly move directly to 400 Gbps.
The above 400 Gbps tier is projected to expand at an 11.58% CAGR through 2031, the fastest rate among the reported capacity bands. The Europe metro DWDM market size for this tier is shaped by the movement from 800G trials to commercial deployments on routes with concentrated data center traffic. Core-Backbone's April 2026 deployment on the Frankfurt-Amsterdam route showed that 800G is entering production use on busy European corridors. OIF's 800ZR agreement, finalized in late 2024, created a hardware-neutral pluggable footprint that can reduce switching costs and improve procurement flexibility. It may support adoption by mid-tier operators seeking confidence in multi-source availability before committing to higher-capacity upgrades.
Complete Report Scope:
- By Component
- Hardware
- Software
- Services
- By Transmission Capacity
- Up to 100 Gbps
- 200 Gbps
- 400 Gbps
- Above 400 Gbps
- By Application
- Data Center Interconnect
- Mobile Backhaul and Fronthaul
- Broadband and Access Network Aggregation
- Other Applications
- By End-User
- Communication Service Providers
- Cloud and Data Center Providers
- Enterprises
- Government and Public Sector
- By Country
- Germany
- United Kingdom
- France
- Italy
- Spain
- Rest of Europe
List of Companies Covered in this Report:
- Nokia Corporation
- Cisco Systems, Inc.
- Ciena Corporation
- Huawei Technologies Co., Ltd.
- ADTRAN, Inc.
- ZTE Corporation
- PacketLight Networks Ltd.
- NEC Corporation
- Corning Incorporated
- Smartoptics AS
- Ribbon Communications Inc.
- Ekinops S.A.
- Lumentum Holdings Inc.
- Coherent Corp.
- HUBER+SUHNER AG
- Source Photonics, Inc.
- FLXOPTIX GmbH
- IP Infusion Inc.
- Juniper Networks, Inc.
Additional Benefits:
- The market estimate (ME) sheet in Excel format
- 3 months of analyst support
TABLE OF CONTENTS
1 INTRODUCTION
- 1.1 Study Assumptions and Market Definition
- 1.2 Scope of the Study
2 RESEARCH METHODOLOGY
3 EXECUTIVE SUMMARY
4 MARKET LANDSCAPE
- 4.1 Market Overview
- 4.2 Market Drivers
- 4.2.1 Accelerating Metro Traffic From Cloud, AI, and Video Workloads
- 4.2.2 5G-Advanced Xhaul and Fiber-Exhaustion Upgrades
- 4.2.3 Higher Spectral Efficiency From 400G, 800G, and Coherent Optics
- 4.2.4 Hyperscale and Colocation Expansion Across FLAP-D Hubs
- 4.2.5 Open, Disaggregated, and IP-over-DWDM Architectures
- 4.2.6 Sovereign Cloud and Intra-European Data-Center Interconnection
- 4.3 Market Restraints
- 4.3.1 High Component Lead Times and Photonic Supply Dependence
- 4.3.2 Fragmented Cross-Border Equipment Approval and Deployment Rules
- 4.3.3 Hyperscaler Purchasing Power and System Price Erosion
- 4.3.4 Multi-Vendor Operational Complexity and Skills Shortage
- 4.4 Industry Value Chain Analysis
- 4.5 Regulatory Landscape
- 4.6 Technological Outlook
- 4.7 Porter's Five Forces Analysis
- 4.7.1 Bargaining Power of Suppliers
- 4.7.2 Bargaining Power of Buyers
- 4.7.3 Threat of New Entrants
- 4.7.4 Threat of Substitutes
- 4.7.5 Competitive Rivalry
- 4.8 Impact of Macroeconomic Factors on the Market
5 MARKET SIZE AND GROWTH FORECASTS (VALUE)
- 5.1 By Component
- 5.1.1 Hardware
- 5.1.2 Software
- 5.1.3 Services
- 5.2 By Transmission Capacity
- 5.2.1 Up to 100 Gbps
- 5.2.2 200 Gbps
- 5.2.3 400 Gbps
- 5.2.4 Above 400 Gbps
- 5.3 By Application
- 5.3.1 Data Center Interconnect
- 5.3.2 Mobile Backhaul and Fronthaul
- 5.3.3 Broadband and Access Network Aggregation
- 5.3.4 Other Applications
- 5.4 By End-User
- 5.4.1 Communication Service Providers
- 5.4.2 Cloud and Data Center Providers
- 5.4.3 Enterprises
- 5.4.4 Government and Public Sector
- 5.5 By Country
- 5.5.1 Germany
- 5.5.2 United Kingdom
- 5.5.3 France
- 5.5.4 Italy
- 5.5.5 Spain
- 5.5.6 Rest of Europe
6 COMPETITIVE LANDSCAPE
- 6.1 Market Concentration
- 6.2 Strategic Moves
- 6.3 Market Share Analysis
- 6.4 Company Profiles (includes Global Level Overview, Market Level Overview, Core Segments, Financials as available, Strategic Information, Market Rank/Share, Products and Services, Recent Developments)
- 6.4.1 Nokia Corporation
- 6.4.2 Cisco Systems, Inc.
- 6.4.3 Ciena Corporation
- 6.4.4 Huawei Technologies Co., Ltd.
- 6.4.5 ADTRAN, Inc.
- 6.4.6 ZTE Corporation
- 6.4.7 PacketLight Networks Ltd.
- 6.4.8 NEC Corporation
- 6.4.9 Corning Incorporated
- 6.4.10 Smartoptics AS
- 6.4.11 Ribbon Communications Inc.
- 6.4.12 Ekinops S.A.
- 6.4.13 Lumentum Holdings Inc.
- 6.4.14 Coherent Corp.
- 6.4.15 HUBER+SUHNER AG
- 6.4.16 Source Photonics, Inc.
- 6.4.17 FLXOPTIX GmbH
- 6.4.18 IP Infusion Inc.
- 6.4.19 Juniper Networks, Inc.
7 MARKET OPPORTUNITIES AND FUTURE OUTLOOK
- 7.1 White-Space and Unmet-Need Assessment

 城域緊密耦合分波多工(DWDM):市場佔有率分析、產業趨勢與統計數據以及成長預測(2026-2031 年)南美洲城域密集波分複用(DWDM):市場佔有率分析、產業趨勢與統計數據以及成長預測(2026-2031 年)
 DWDM收發器市場規模、佔有率和成長分析:按外形規格、資料速率、傳輸距離、應用、最終用戶、銷售管道和地區分類 - 產業預測,2026-2033年
 2026年超C分波多工(WDM)設備全球市場報告
 分波多工設備市場:按設備類型、技術、應用和最終用戶分類的全球預測,2026-2032年波長管理設備市場:依產品類型、技術、連接埠數量、波長範圍、應用和最終用戶分類,全球預測,2026-2032年粗分波多工模組市場(按產品類型、傳輸距離、通道數、外形規格、光纖類型、應用和最終用戶分類),全球預測,2026-2032年2026年全球高密度分波多工器(DWDM)收發器市場報告
 密集波分複用 (DWDM) 市場規模、佔有率、成長及全球產業分析:按類型、應用和地區劃分的洞察與預測 (2026-2034)
 多工器(WDM)全球市場規模、佔有率、趨勢分析報告:2024 年至 2031 年按類型、產業和地區分類的展望與預測