


 |
市場調查報告書
商品編碼
2157035
城域緊密耦合分波多工(DWDM):市場佔有率分析、產業趨勢與統計數據以及成長預測(2026-2031 年)Metro Dense Wave Division Multiplexing (DWDM) - Market Share Analysis, Industry Trends & Statistics, Growth Forecasts (2026 - 2031) |
||||||

※ 本網頁內容可能與最新版本有所差異。詳細情況請與我們聯繫。
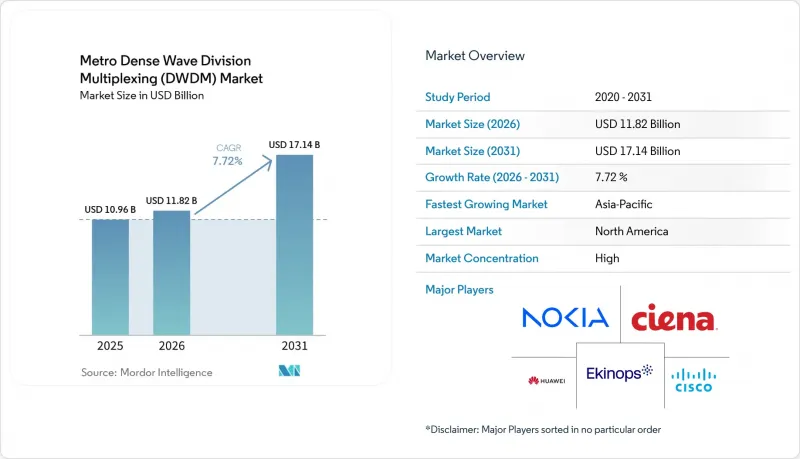
根據 Mordor Intelligence 預測,城域高密度分波多工(DWDM) 市場規模將從 2025 年的 109.6 億美元成長到 2026 年的 118.2 億美元,然後在 2031 年達到 171.4 億美元,2026 年至 2031 年至 2031 年的複合成長率為 272%。
全球城域高密度分波多工(DWDM) 市場的趨勢與見解。
對超大規模和人工智慧資料中心互連的需求
隨著分散式人工智慧訓練的興起,城域DWDM市場的角色正從載波聚合轉向運算互連。由於單一站點面臨電力和土地限制,超大規模資料中心業者正在將運算能力分佈到多個站點。這種方法需要在相距5至80公里的設施之間建立低延遲、高容量的波長連結。 Meta公司已在IP over DWDM配置中採用800ZR+模組,用於地理分佈的GPU叢集。此案例研究表明,分散式計算叢集需要覆蓋整個都會區的容量。儘管需求不斷成長,暗纖仍然是超大規模資料中心業者的替代方案,並且可能成為城域DWDM市場波長服務獲利能力的限制因素。
5G xHaul 和行動邊緣容量擴展
隨著5G密度的增加,傳輸需求也隨之成長,網路需要更多的行動通訊基地台、更嚴格的去程傳輸延遲要求以及更高的單站容量。當行動通訊業者將去程傳輸、中傳和回程傳輸整合到共用傳輸網路中時,城域DWDM市場將從中受益。 O-RAN聯盟第九工作小組規格定義了跨這些網路功能的開放式xHaul傳輸。到2025年底,中國將部署476萬個5G基地台,為大規模城市持續的中傳升級奠定基礎。分散式單元的聚合可以將更多容量集中在更少的城域節點上。這種配置使得在現有環網中升級到100G到400G連貫傳輸成為可能,而無需增加少量低速端口。
分散式多廠商網路整合的複雜性
在解耦式光纖網路中,光路系統和轉發器層是分離的,營運商可以從不同的供應商購買各層組件。這種柔軟性可能會增加整合工作的負擔,並可能減緩城域DWDM)市場的普及速度。當一個供應商的波長在另一個供應商的電路系統上運作時,就需要進行光性能檢驗。 Optica 上發表的一篇關於多供應商 IPoDWDM 的論文評估了此類環境下的效能和控制平面檢驗。雖然 OpenROADM 模型為互通性提供了一個框架,但控制器可能需要管理多個模型版本。由於測試和整合資源有限,小規模業者可能會面臨龐大的軟體和維運負擔。
細分市場分析
到2025年,硬體將佔總收入的82.65%,成為領先的組件類別。這一地位反映了營運商在連貫線路卡、多工器器、轉發器和線上放大器方面的大規模投資。這些系統構成了透過城域光纖線路傳輸海量流量的實體層。用於400G和800G傳輸的連貫線路卡正在推動新的硬體採購。營運商正在用頻譜效率顯著提高的系統取代老舊的10G和40G基礎設施。現有營運商網路的龐大規模意味著設備升級將持續產生硬體需求。許多硬體升級也涉及安裝和網路管理服務。這些服務可協助營運商安裝、配置和維護新的光纖通訊容量。
預計到2031年,軟體市場將以11.53%的複合年成長率成長,成為城域DWDM市場各組成部分中成長最快的。軟體定義光平台支援在複雜的傳輸網路中進行動態波長路由。它們還提供自動化效能監控功能,從而能夠更快地識別運行問題。集中式流量工程使網路團隊能夠更精細地控制可用容量。 Ciena在其2026年3月發布的光纖通訊產品組合中重點介紹了基於代理的AI驅動型網路自動化。諾基亞以應用為中心的解決方案也同樣體現了將光系統適配到特定網路應用的需求。開放介面的普及提高了能夠跨所有裝置層運行的軟體的重要性。因此,控制平面功能在採購決策中佔據了越來越重要的地位。
到2025年,400 Gbps頻段將佔總銷售額的31.85%,成為傳輸容量類別中佔有率最大的頻段。這一地位反映了400G連貫技術在營運商城域核心網路和資料中心互連應用的成熟度。過去三年來的部署推動了400 Gbps城域DWDM市場規模的成長。該技術為需要在現有線路上提升容量的營運商提供了一條成熟的升級路徑。目前,100 Gbps及以下的系統仍在傳統接取環網和長尾企業網路中運作。 200 Gbps頻段仍主要滿足特定區域的需求,且需求範圍較窄。隨著流量負載的增加,投資正轉向更高容量。這使得400G得以維持龐大的部署基礎,而400 Gbps以上的頻段將成為下一階段投資的重點。
預計到2031年,速度超過400G的解決方案將以12.43%的複合年成長率成長。此類別包括用於高容量城域網路和資料中心部署的800G和1.6T架構。這些系統使電信業者能夠在不增加相同數量光纖基礎設施的情況下擴展流量容量。 Ciena公司發表了基於其2nm矽平台的800Gbps C波段和L波段連貫產品。諾基亞也發布了用於資料中心連線(DCI)部署的1.6T IP over DWDM產品。隨著分散式運算增加設施間的流量,更快的產品的重要性日益凸顯。 800G部署的擴展也對400G的每Gigabit價格構成了壓力。各廠商都在加速開發800G和1.6T產品,以維持技術領先地位。
區域分析
到2025年,北美將佔據城域DWDM市場佔有率的35.11%。該地區受益於超大規模資料中心園區的高度集中。美國是主要需求來源,資料中心互連是其主要應用領域。進入2026年,Ciena的訂單積壓約為50億美元,並表示其產品幾乎已售罄,這反映了客戶需求的持續成長。在加拿大,與數據主權要求相關的國內互連投資正在增加。墨西哥受益於克雷塔羅州的資料中心發展以及近岸外包活動。
預計到2031年,亞太地區的複合年成長率將達到8.92%,是所有地區中最高的。到2025年底,中國部署的476萬個5G基地台將為正在進行的中階光纖網路升級提供支援。印度是該地區城域DWDM市場成長最快的國家。據Ciena公司稱,沃達豐Idea將於2026年3月在印度部署WaveLogic 6 Extreme技術,支援高達1.6 Tbps的單波長傳輸速率。對資料中心、光纖專案和行動網路容量升級的投資正在推動該地區的需求。
在日本和韓國,升級到5G-Advanced的容量需求持續存在。東南亞和澳洲正在用連貫DWDM基礎設施取代傳統的SONET和SDH系統。在歐洲,西歐市場的需求日益成熟,而東歐市場在歐盟團結基金的支持下正在擴張。歐洲電子通訊法案規定的基礎設施共用義務與歐洲的網路規劃息息相關。沙烏地阿拉伯和阿拉伯聯合大公國正透過大規模的基礎建設項目來擴展城域網路容量。南非和奈及利亞正在推動非洲市場的發展,這得益於對海底光纜登陸的投資。
其他好處:
- Excel格式的市場預測(ME)表
- 3個月的分析師支持
目錄
第1章:引言
- 研究假設和市場定義
- 調查範圍
第2章:調查方法
第3章執行摘要
第4章 市場狀況
- 市場概覽
- 市場促進因素
- 5G xHaul 和行動邊緣容量擴展
- 超大規模和人工智慧資料中心的互連需求
- 向 400G、800G 和 1.6T連貫光纖通訊過渡
- 光纖短缺和現有線路的容量擴展
- 基於DWDM的IP和路由器整合的相干連貫
- 地鐵邊緣永續性和每比特功耗降低
- 市場限制因素
- 高密度城市走廊中的光纖管道和土地徵用限制
- 分散式多廠商網路整合的複雜性
- 光學設計和操作方面的高級技能要求
- 插入式光學模組正在蠶食獨立傳輸硬體的市場。
- 產業價值鏈分析
- 監理情勢
- 技術展望
- 波特五力分析
- 宏觀經濟因素對市場的影響
第5章 市場規模與成長預測
- 按組件
- 硬體
- 軟體
- 服務
- 按輸電容量
- 最高可達 100 Gbps
- 200 Gbps
- 400 Gbps
- 400 Gbps 或更高
- 透過使用
- 資料中心之間的互連
- 行動回程傳輸和去程傳輸
- 寬頻和接取網路的聚合
- 其他用途
- 最終用戶
- 電信服務供應商
- 雲端和資料中心供應商
- 公司
- 政府/公共部門
- 按地區
- 北美洲
- 美國
- 加拿大
- 墨西哥
- 南美洲
- 巴西
- 阿根廷
- 其他南美國家
- 歐洲
- 德國
- 英國
- 法國
- 義大利
- 西班牙
- 其他歐洲國家
- 亞太地區
- 中國
- 日本
- 韓國
- 印度
- 澳洲和紐西蘭
- 其他亞太國家
- 中東
- 沙烏地阿拉伯
- 阿拉伯聯合大公國
- 其他中東國家
- 非洲
- 南非
- 奈及利亞
- 其他非洲國家
- 北美洲
第6章 競爭情勢
- 市場集中度
- 策略趨勢
- 市佔率分析
- 公司簡介
- Huawei Technologies Co., Ltd.
- Ciena Corporation
- Nokia Corporation
- Cisco Systems, Inc.
- ZTE Corporation
- Fujitsu Limited
- NEC Corporation
- ADTRAN Holdings, Inc.
- Ribbon Communications Inc.
- Juniper Networks, Inc.
- FiberHome Telecommunication Technologies Co., Ltd.
- Ekinops SA
- Coherent Corp.
- Lumentum Holdings Inc.
- Tejas Networks Limited
- Padtec Holding SA
- PacketLight Networks Ltd.
- Mitsubishi Electric Corporation
- Smartoptics Group AS
第7章 市場機會與未來展望
According to Mordor Intelligence, the metro dense wave division multiplexing (DWDM) market size is expected to grow from USD 10.96 billion in 2025 to USD 11.82 billion in 2026, and is forecast to reach USD 17.14 billion by 2031, at a 7.72% CAGR over 2026-2031.
Global Metro Dense Wave Division Multiplexing (DWDM) Market Trends and Insights
Hyperscale and AI Data Center Interconnect Demand
Distributed AI training is changing the role of the Metro DWDM market from carrier aggregation toward compute interconnection. Hyperscalers are distributing computing capacity across multiple sites because individual locations face power and land constraints. This approach requires low-latency, high-capacity wavelengths between facilities that can be 5-80 km apart. Meta adopted 800ZR+ modules in an IP-over-DWDM configuration for geographically distributed GPU clusters. The deployment shows that the distributed computing clusters require capacity across metropolitan locations. Demand volumes are increasing, but dark fiber remains an alternative for hyperscalers and can limit wavelength-service margins in the Metro DWDM market.
5G xHaul and Mobile Edge Capacity Expansion
5G densification increases transport requirements because networks need more cell sites, tighter fronthaul latency, and higher capacity at each site. The Metro DWDM market benefits where mobile operators combine fronthaul, midhaul, and backhaul into shared transport networks. O-RAN Alliance Working Group 9 specifications define open xHaul transport across these network functions. China had deployed 4.76 million 5G base stations by the end of 2025, creating a large base for continuing midhaul upgrades in major cities. Distributed unit aggregation is concentrating more capacity at fewer metro nodes. That configuration supports upgrades from 100G to 400G coherent transport in existing rings, rather than small additions of lower-speed ports.
Integration Complexity in Disaggregated Multivendor Networks
Disaggregated optical networks separate the optical line system from the transponder layer, allowing operators to purchase layers from different suppliers. This flexibility also increases integration work and can slow deployments in the Metro DWDM market. Optical performance must be qualified when wavelengths from one supplier operate across another supplier's line system. An Optica paper on multivendor IPoDWDM evaluated performance and control-plane validation in these environments. The OpenROADM model provides a framework for interoperability, but controllers may need to manage several model versions. Smaller operators can face greater software and operational burdens due to limited capacity for testing and integration.
Other drivers and restraints analyzed in the detailed report include:
- Migration to 400G, 800G, and 1.6T Coherent Optics
- Fiber Scarcity and Capacity Scaling on Existing Routes
- Fiber-Duct and Rights-of-Way Constraints in Dense Urban Corridors
For complete list of drivers and restraints, kindly check the Table Of Contents.
Segment Analysis
Hardware accounted for 82.65% of revenue in 2025, making it the leading component category. That position reflected extensive operator investment in coherent line cards, muxponders, transponders, and in-line amplifiers. These systems form the physical layer for transmitting large volumes of traffic over metropolitan fiber routes. Coherent line cards for 400G and 800G transmission lead new hardware procurement. Operators are replacing older 10G and 40G infrastructure with systems that offer substantially improved spectral efficiency. The scale of existing carrier networks means equipment refreshes continue to create hardware demand. Installation and network-management services also accompany many hardware upgrades. These services help operators install, configure, and maintain new optical capacity.
Software is projected to record an 11.53% CAGR through 2031, the highest rate among components in the Metro DWDM market. Software-defined optical platforms enable dynamic wavelength routing across complex transport networks. They also provide automated performance monitoring that can identify operational issues more quickly. Centralized traffic engineering gives network teams more control over available capacity. Ciena highlighted agentic AI network automation in its March 2026 optical portfolio. Nokia's application-focused solutions likewise reflect the need to align optical systems with specific network uses. Open interfaces increase the importance of software that can operate across equipment layers. As a result, control-plane capabilities can carry more weight in procurement decisions.
The 400 Gbps tier held 31.85% of revenue in 2025, the largest share among transmission-capacity categories. Its position reflected the maturity of 400G coherent technology across operator metro cores and data center interconnect applications. The Metro DWDM market size for the 400 Gbps tier benefited from deployments made during the preceding 3 years. This technology offers a proven upgrade path for operators that need greater capacity on established routes. Up-to-100 Gbps systems still operate in legacy access rings and long-tail enterprise networks. The 200 Gbps category serves selected regional requirements where the demand profile remains narrower. Investment is shifting toward higher capacities as traffic loads rise. This leaves 400G as a large installed base and above-400 Gbps as the next investment focus.
Above-400 Gbps solutions are projected to register a 12.43% CAGR through 2031. The category includes 800G and 1.6T architectures used for high-capacity metropolitan and data center deployments. These systems help operators expand traffic capacity without adding the same amount of new fiber infrastructure. Ciena announced 800 Gbps C-band and L-band coherent pluggables with its 2 nm silicon platform. Nokia also announced 1.6T IP-over-DWDM products for data center interconnect deployments. Higher-rate products are becoming increasingly relevant as distributed computing drives more traffic across facilities. Broader 800G deployment also puts 400G pricing under pressure per gigabit. Vendors are accelerating work on 800G and 1.6T products to maintain technology leadership.
Complete Report Scope:
- By Component
- Hardware
- Software
- Services
- By Transmission Capacity
- Up to 100 Gbps
- 200 Gbps
- 400 Gbps
- Above 400 Gbps
- By Application
- Data Center Interconnect
- Mobile Backhaul and Fronthaul
- Broadband and Access Network Aggregation
- Other Applications
- By End-User
- Communication Service Providers
- Cloud and Data Center Providers
- Enterprises
- Government and Public Sector
- By Geography
- North America
- United States
- Canada
- Mexico
- South America
- Brazil
- Argentina
- Rest of South America
- Europe
- Germany
- United Kingdom
- France
- Italy
- Spain
- Rest of Europe
- Asia-Pacific
- China
- Japan
- South Korea
- India
- Australia and New Zealand
- Rest of Asia-Pacific
- Middle East
- Saudi Arabia
- United Arab Emirates
- Rest of Middle East
- Africa
- South Africa
- Nigeria
- Rest of Africa
- North America
Geography Analysis
North America held 35.11% of the Metro DWDM market share in 2025. The region benefits from a high concentration of hyperscale data center campuses. The United States is the main source of demand, with data center interconnect serving as a major application. Ciena entered 2026 with approximately USD 5.0 billion in backlog and described itself as essentially sold out, reflecting accumulated customer demand. Canada adds domestic interconnect investment related to data sovereignty requirements. Mexico is benefiting from data center development in Queretaro that is tied to nearshoring activity.
Asia-Pacific is projected to register an 8.92% CAGR through 2031, the fastest rate among geographic areas. China's 4.76 million 5G base stations deployed by the end of 2025 support ongoing midhaul optical upgrades. India is the fastest-expanding country within the regional Metro DWDM market. Ciena stated that Vodafone Idea deployed WaveLogic 6 Extreme technology in India in March 2026, supporting up to 1.6 Tbps per wavelength. Data center investment, fiberization programs, and mobile-network capacity upgrades support regional demand.
Japan and South Korea continue to need capacity for 5G-Advanced upgrades. Southeast Asia and Australia are replacing legacy SONET and SDH systems with coherent DWDM infrastructure. Europe has mature demand in its Western markets, while Eastern Europe is expanding with support from EU cohesion funding. Infrastructure-sharing obligations under the European Electronic Communications Code are relevant to network planning in Europe. Saudi Arabia and the UAE are adding metro capacity through large infrastructure programs. South Africa and Nigeria lead a developing African market, supported by investments in submarine cable landings.
- Huawei Technologies Co., Ltd.
- Ciena Corporation
- Nokia Corporation
- Cisco Systems, Inc.
- ZTE Corporation
- Fujitsu Limited
- NEC Corporation
- ADTRAN Holdings, Inc.
- Ribbon Communications Inc.
- Juniper Networks, Inc.
- FiberHome Telecommunication Technologies Co., Ltd.
- Ekinops SA
- Coherent Corp.
- Lumentum Holdings Inc.
- Tejas Networks Limited
- Padtec Holding S.A.
- PacketLight Networks Ltd.
- Mitsubishi Electric Corporation
- Smartoptics Group AS
Additional Benefits:
- The market estimate (ME) sheet in Excel format
- 3 months of analyst support
TABLE OF CONTENTS
1 INTRODUCTION
- 1.1 Study Assumptions and Market Definition
- 1.2 Scope of the Study
2 RESEARCH METHODOLOGY
3 EXECUTIVE SUMMARY
4 MARKET LANDSCAPE
- 4.1 Market Overview
- 4.2 Market Drivers
- 4.2.1 5G xHaul and Mobile Edge Capacity Expansion
- 4.2.2 Hyperscale and AI Data Center Interconnect Demand
- 4.2.3 Migration to 400G, 800G, and 1.6T Coherent Optics
- 4.2.4 Fiber Scarcity and Capacity Scaling on Existing Routes
- 4.2.5 IP-over-DWDM and Router-Embedded Coherent Pluggables
- 4.2.6 Metro Edge Sustainability and Power-per-Bit Reduction
- 4.3 Market Restraints
- 4.3.1 Fiber-Duct and Rights-of-Way Constraints in Dense Urban Corridors
- 4.3.2 Integration Complexity in Disaggregated Multivendor Networks
- 4.3.3 High Skills Requirement for Optical Planning and Operations
- 4.3.4 Pluggable Optics Cannibalization of Standalone Transport Hardware
- 4.4 Industry Value Chain Analysis
- 4.5 Regulatory Landscape
- 4.6 Technological Outlook
- 4.7 Porter's Five Forces Analysis
- 4.7.1 Bargaining Power of Suppliers
- 4.7.2 Bargaining Power of Buyers
- 4.7.3 Threat of New Entrants
- 4.7.4 Threat of Substitutes
- 4.7.5 Competitive Rivalry
- 4.8 Impact of Macroeconomic Factors on the Market
5 MARKET SIZE AND GROWTH FORECASTS (VALUE)
- 5.1 By Component
- 5.1.1 Hardware
- 5.1.2 Software
- 5.1.3 Services
- 5.2 By Transmission Capacity
- 5.2.1 Up to 100 Gbps
- 5.2.2 200 Gbps
- 5.2.3 400 Gbps
- 5.2.4 Above 400 Gbps
- 5.3 By Application
- 5.3.1 Data Center Interconnect
- 5.3.2 Mobile Backhaul and Fronthaul
- 5.3.3 Broadband and Access Network Aggregation
- 5.3.4 Other Applications
- 5.4 By End-User
- 5.4.1 Communication Service Providers
- 5.4.2 Cloud and Data Center Providers
- 5.4.3 Enterprises
- 5.4.4 Government and Public Sector
- 5.5 By Geography
- 5.5.1 North America
- 5.5.1.1 United States
- 5.5.1.2 Canada
- 5.5.1.3 Mexico
- 5.5.2 South America
- 5.5.2.1 Brazil
- 5.5.2.2 Argentina
- 5.5.2.3 Rest of South America
- 5.5.3 Europe
- 5.5.3.1 Germany
- 5.5.3.2 United Kingdom
- 5.5.3.3 France
- 5.5.3.4 Italy
- 5.5.3.5 Spain
- 5.5.3.6 Rest of Europe
- 5.5.4 Asia-Pacific
- 5.5.4.1 China
- 5.5.4.2 Japan
- 5.5.4.3 South Korea
- 5.5.4.4 India
- 5.5.4.5 Australia and New Zealand
- 5.5.4.6 Rest of Asia-Pacific
- 5.5.5 Middle East
- 5.5.5.1 Saudi Arabia
- 5.5.5.2 United Arab Emirates
- 5.5.5.3 Rest of Middle East
- 5.5.6 Africa
- 5.5.6.1 South Africa
- 5.5.6.2 Nigeria
- 5.5.6.3 Rest of Africa
- 5.5.1 North America
6 COMPETITIVE LANDSCAPE
- 6.1 Market Concentration
- 6.2 Strategic Moves
- 6.3 Market Share Analysis
- 6.4 Company Profiles (includes Global Level Overview, Market Level Overview, Core Segments, Financials as available, Strategic Information, Market Rank/Share, Products and Services, Recent Developments)
- 6.4.1 Huawei Technologies Co., Ltd.
- 6.4.2 Ciena Corporation
- 6.4.3 Nokia Corporation
- 6.4.4 Cisco Systems, Inc.
- 6.4.5 ZTE Corporation
- 6.4.6 Fujitsu Limited
- 6.4.7 NEC Corporation
- 6.4.8 ADTRAN Holdings, Inc.
- 6.4.9 Ribbon Communications Inc.
- 6.4.10 Juniper Networks, Inc.
- 6.4.11 FiberHome Telecommunication Technologies Co., Ltd.
- 6.4.12 Ekinops SA
- 6.4.13 Coherent Corp.
- 6.4.14 Lumentum Holdings Inc.
- 6.4.15 Tejas Networks Limited
- 6.4.16 Padtec Holding S.A.
- 6.4.17 PacketLight Networks Ltd.
- 6.4.18 Mitsubishi Electric Corporation
- 6.4.19 Smartoptics Group AS
7 MARKET OPPORTUNITIES AND FUTURE OUTLOOK
- 7.1 White-Space and Unmet-Need Assessment

 歐洲城域緊密耦合分波多工(DWDM):市場佔有率分析、產業趨勢與統計數據以及成長預測(2026-2031 年)南美洲城域密集波分複用(DWDM):市場佔有率分析、產業趨勢與統計數據以及成長預測(2026-2031 年)
 DWDM收發器市場規模、佔有率和成長分析:按外形規格、資料速率、傳輸距離、應用、最終用戶、銷售管道和地區分類 - 產業預測,2026-2033年
 2026年超C分波多工(WDM)設備全球市場報告
 分波多工設備市場:按設備類型、技術、應用和最終用戶分類的全球預測,2026-2032年波長管理設備市場:依產品類型、技術、連接埠數量、波長範圍、應用和最終用戶分類,全球預測,2026-2032年粗分波多工模組市場(按產品類型、傳輸距離、通道數、外形規格、光纖類型、應用和最終用戶分類),全球預測,2026-2032年2026年全球高密度分波多工器(DWDM)收發器市場報告
 密集波分複用 (DWDM) 市場規模、佔有率、成長及全球產業分析:按類型、應用和地區劃分的洞察與預測 (2026-2034)
 多工器(WDM)全球市場規模、佔有率、趨勢分析報告:2024 年至 2031 年按類型、產業和地區分類的展望與預測