


 |
市場調查報告書
商品編碼
2154952
南美洲市場分析:市場佔有率分析、產業趨勢與統計、成長預測(2026-2031)South America Location Analytics - Market Share Analysis, Industry Trends & Statistics, Growth Forecasts (2026 - 2031) |
||||||

※ 本網頁內容可能與最新版本有所差異。詳細情況請與我們聯繫。
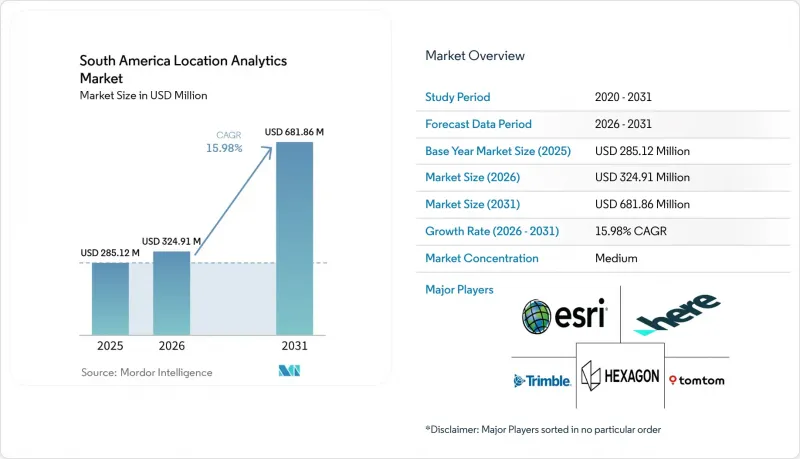
根據 Mordor Intelligence 預測,南美位置分析市場規模預計將在 2025 年達到 2.8512 億美元,在 2026 年成長至 3.2491 億美元,並在 2031 年擴大至 6.8186 億美元,2026 年至 2031 年的複合年成長率為 15.98%。
南美洲位置分析市場趨勢與洞察
企業向即時空間決策智慧轉型。
南美位置分析市場正受益於營運團隊需要即時更新的位置數據而非每日報告。物流、金融服務、農產品和公共安全團隊擴大利用位置資訊來輔助決策。亞馬遜巴西於2026年初在八個城市推出了快速商務服務,並計劃在年底前將其規模擴大三倍。該公司正在利用一套基於位置的系統,該系統會根據配送人員的位置、庫存狀態和交通號誌來調整配送區域。這些營運模式需要持續的數據處理,而非一次性的地圖繪製項目。因此,供應商的價值體現在響應速度、應用程式介面 (API) 效能以及處理不斷變化的資料饋送的能力。而這正是雲端原生平台相對於主要為大量處理而設計的系統所具有的優勢。
對智慧城市和數位基礎設施的投資
智慧城市計畫和數位基礎設施正在提升南美洲位置分析市場的數據可用性。 2026年6月,里約熱內盧市政府宣布投資5.5億美元用於「裡約人工智慧城市」項目,該項目是未來十年總投資額達650億美元的計畫的一部分。該計劃旨在2032年將里約熱內盧打造成為全球十大人工智慧中心之一。互聯基礎設施可以從感測器、攝影機和車輛收集數據,並將其用於城市規劃、交通管理和維護。 2026年3月,Connector Infrastructure公司宣布了一項3.5億美元的計劃,將在2028年前鋪設6000公里光纖電纜,將智利和阿根廷與巴西的主要數位基礎設施樞紐連接起來。這些項目將擴展傳輸位置資料所需的網路,並創造對持續分析服務的需求。
實施地理空間資料和平台的高成本
高昂的授權、整合和資料收整合本阻礙了南美洲位置分析市場的普及,尤其是在中型企業和公共機構。如果沒有公共項目或聯合投資,高解析度衛星圖像對商業用戶來說可能價格過高。此外,將空間系統與企業資源規劃 (ERP) 和客戶關係管理 (CRM) 平台整合需要專門的軟體、資料修改和專家服務。這些需求通常會導致企業部署的投資回收期長達 2-3 年。阿根廷的外匯波動可能會增加預算週期內將美元計價的許可轉換為該地貨幣的成本。計量型的雲端服務為永久授權提供了一種替代方案,從而減少了維護內部專家團隊的需求。
細分市場分析
2025年,軟體在南美洲位置分析市場佔59.31%的佔有率。這一地位反映了地理資訊系統(GIS)在測繪機構、電信、石油天然氣、金融服務和大型企業中的廣泛應用。 Esri ArcGIS和Hexagon ERDAS等系統的長期普及持續支撐著軟體收入。在需要強大的測繪、資料管理和管治能力的組織中,這些平台仍然發揮著至關重要的作用。
預計到2031年,服務板塊將以16.38%的複合年成長率成長,成為該板塊中成長最快的板塊。買家購買的不再只是軟體許可,還包括分析結果和託管服務。企業內部GIS專家的短缺以及維護人工智慧模式的需求是推動這項轉變的主要因素。亞馬遜巴西在快速商務拓展方面,依賴外部支援進行路線最佳化和地理空間模型,而不是自行建立所有功能。 Foursquare於2026年推出了FSQ Spatial Agent,透過支援自然語言空間查詢,降低了使用者使用常規服務的門檻,無需具備GIS專業知識。
2025年,報告和視覺化在南美位置分析市場中佔據28.83%的佔有率。政府、物流和金融服務業的公司對儀錶板和專題地圖的投資支撐了這一佔有率。地理編碼、反向地理編碼、資料整合、ETL(擷取、轉換、載入)流程、專題地圖、表面和場分析以及地理視覺化分別針對空間工作流程的不同階段。即使是不具備專業知識的用戶,基本的視覺化仍然至關重要,它能使位置數據易於理解。
網路和位置分析預計到2031年將以17.38%的複合年成長率成長。企業正從單純的描述性地圖轉向用於預測配送網路、金融流通路徑和疾病傳播路徑的預測模型。這種轉變反映了買家需要在規劃和營運系統中直接利用空間資訊。大規模商業智慧平台內建的地圖功能可能會降低僅用於視覺化的獨立工具的價值。 2025年6月,巴西地理統計研究所(IBGE)和巴西公共研究與發展組織(SERPRO)啟動了一項全國性計劃,旨在將分散的公共記錄整合到預測分析平台中。這項措施清楚地表明了市場對超越靜態報告的分析系統的需求。
其他好處:
- Excel格式的市場預測(ME)表
- 3個月的分析師支持
目錄
第1章:引言
- 研究假設和市場定義
- 調查範圍
第2章:調查方法
第3章執行摘要
第4章 市場狀況
- 市場概覽
- 市場促進因素
- 企業向即時空間決策智慧轉型
- 對智慧城市和數位基礎設施的投資
- 基於位置的零售、物流和旅行最佳化
- 擴展來自衛星、GNSS、行動裝置和物聯網設備的資料。
- 人工智慧驅動的地理空間模型和數位孿生
- 地址和旅行資料的碎片化催生了對基於地理位置的資料產品的需求。
- 市場限制因素
- 實施地理空間資料和平台的總成本很高
- 資料隱私、同意和跨境資料傳輸的限制
- 地址標準分散,資料品質不一致
- 地理資訊系統、資料科學和太空工程領域人才短缺。
- 宏觀經濟因素對市場的影響
- 產業價值鏈分析
- 監理情勢
- 技術展望
- 波特五力分析
第5章 市場規模與成長預測
- 報價
- 軟體
- 服務
- 按解決方案類型和分析
- 資料整合和 ETL
- 地理編碼和反向地理編碼
- 報告和可視化
- 專題地圖繪製與空間分析
- 網路和位置分析
- 地表和場分析
- 地理資訊視覺化
- 部署模式
- 雲
- 現場
- 透過數據和感測方法
- 全球導航衛星系統與衛星定位數據
- 行動網路和裝置衍生數據
- 數據源自 Wi-Fi 和 BLE。
- 物聯網和感測器融合數據
- 最終用戶
- 零售與電子商務
- 汽車、運輸、物流
- BFSI
- 政府/國防
- 電訊
- 醫療保健和生命科學
- 製造業和工業
- 其他終端用戶產業
- 按組織規模
- 大公司
- 小型企業
- 按地區
- 巴西
- 阿根廷
- 哥倫比亞
- 其他南美國家
第6章 競爭情勢
- 市場集中度
- 策略趨勢
- 市佔率分析
- 公司簡介
- Environmental Systems Research Institute, Inc.
- HERE Global BV
- TomTom NV
- Precisely, Inc.
- CARTO, Inc.
- Mapbox, Inc.
- Trimble Inc.
- Hexagon AB
- Bentley Systems, Incorporated
- Fugro NV
- Planet Labs PBC
- Maxar Intelligence Inc.
- Spire Global, Inc.
- BlackSky Technology Inc.
- Satellogic Inc.
- MDA Space Ltd.
- SuperMap Software Co., Ltd.
- Nearmap Ltd.
- SafeGraph Inc.
- Kongsberg Geospatial AS
- Orbital Insight, Inc.
- Foursquare Labs, Inc.
第7章 市場機會與未來展望
According to Mordor Intelligence, the South America location analytics market size was USD 285.12 million in 2025 and is estimated to increase from USD 324.91 million in 2026 to USD 681.86 million by 2031, at a CAGR of 15.98% during 2026-2031.
South America Location Analytics Market Trends and Insights
Enterprise Shift Toward Real-Time Spatial Decision Intelligence
The South America location analytics market is benefiting as operating teams require current location data rather than daily reports. Logistics, financial services, agribusiness, and public safety teams increasingly use location information when making decisions. Amazon Brazil launched quick-commerce operations across 8 cities in early 2026 and planned a 3-fold expansion by year's end, using location systems that adjust delivery areas through rider positions, inventory, and traffic signals. These operating models create a continuing requirement for data processing instead of a one-time mapping project. Vendors are therefore being assessed on response time, application programming interface performance, and the ability to support changing data feeds. This gives cloud-native platforms an advantage over systems designed mainly for batch processing.
Smart-City and Digital Infrastructure Investment
Smart-city programs and digital infrastructure are increasing the availability of data that can support the South America location analytics market. Rio de Janeiro City Hall announced a USD 550 million investment in the Rio AI City project in June 2026, as part of a program targeting USD 65 billion in investment over the following decade. The program is intended to position Rio de Janeiro among the 10 largest global AI hubs by 2032. Connected infrastructure generates data from sensors, cameras, and vehicles that can be used for urban planning, traffic management, and maintenance. Conecta Infra announced a USD 350 million plan in March 2026 to deploy 6,000 kilometers of fiber connecting Chile and Argentina with Brazil's main digital infrastructure hubs by 2028. These projects extend the networks needed to transmit location data and create demand for ongoing analytics services.
High Cost of Geospatial Data and Platform Deployment
High licensing, integration, and data-acquisition costs limit adoption in the South America location analytics market, especially among mid-sized organizations and public agencies. High-resolution satellite imagery can be costly for commercial users without public programs or co-investment. Integrating spatial systems with enterprise resource planning and customer relationship management platforms also requires specialized software, data remediation, and professional services. These requirements can extend the typical payback period for enterprise deployment to 2-3 years. Currency volatility in Argentina can raise the local-currency cost of USD-denominated licenses during a budget cycle. Consumption-based cloud services provide an alternative to perpetual licenses and can reduce the need to maintain specialized internal teams.
Other drivers and restraints analyzed in the detailed report include:
- Location-Based Retail, Logistics, and Mobility Optimization
- Expansion of Satellite, GNSS, Mobile, and IoT-Derived Data
- Data Privacy, Consent, and Cross-Border Transfer Constraints
For complete list of drivers and restraints, kindly check the Table Of Contents.
Segment Analysis
Software held 59.31% of the South America location analytics market in 2025. This position reflected established GIS deployments in mapping agencies, telecommunications, oil and gas, financial services, and large enterprises. Long-standing commitments to systems such as Esri ArcGIS and Hexagon ERDAS continued to support software revenue. These platforms remain important where organizations require extensive mapping, data management, and governance capabilities.
Services are projected to expand at a 16.38% CAGR through 2031, the fastest rate within this segmentation. Buyers are increasingly purchasing analytical outcomes and managed delivery rather than only software licenses. The shortage of internal GIS specialists and the maintenance needs of AI-enabled models support this shift. Amazon Brazil's quick-commerce expansion relied on external routing optimization and geospatial modeling support rather than building all capabilities in-house. Foursquare introduced the FSQ Spatial Agent in 2026 to enable natural-language spatial queries without GIS expertise, lowering the barrier to recurring service consumption.
Reporting and visualization accounted for 28.83% of the South America location analytics market in 2025. Enterprise dashboard investment and thematic mapping supported this position in government, logistics, and financial services. Geocoding, reverse geocoding, data integration, extract-transform-load processes, thematic mapping, surface and field analytics, and geovisualization each address distinct stages of the spatial workflow. Basic visualization remains necessary because it makes location data understandable for non-specialist users.
Network and location analytics are projected to expand at a 17.38% CAGR through 2031. Enterprises are moving from descriptive maps toward predictive models for delivery networks, financial contagion corridors, and disease propagation pathways. This change reflects buyers' need to use spatial context directly in planning and operating systems. Mapping features within large business intelligence platforms could reduce the standalone value of visualization-only tools. Brazil's IBGE and SERPRO launched a national program in June 2025 to integrate fragmented public records into predictive analytical platforms. The initiative illustrates the demand for analytical systems that go beyond static reporting.
Complete Report Scope:
- By Offering
- Software
- Services
- By Solution and Analytics Type
- Data Integration and ETL
- Geocoding and Reverse Geocoding
- Reporting and Visualization
- Thematic Mapping and Spatial Analysis
- Network and Location Analytics
- Surface and Field Analytics
- Geovisualization
- By Deployment Mode
- Cloud
- On-Premises
- By Data and Sensing Modality
- GNSS and Satellite-Derived Location Data
- Mobile Network and Device-Derived Data
- Wi-Fi and BLE-Derived Data
- IoT and Sensor-Fusion Data
- By End User
- Retail and E-Commerce
- Automotive, Transportation, and Logistics
- BFSI
- Government and Defense
- Telecommunications
- Healthcare and Life Sciences
- Manufacturing and Industrial
- Other End User Industries
- By Organization Size
- Large Enterprises
- Small and Medium-Sized Enterprises
- By Geography
- Brazil
- Argentina
- Colombia
- Rest of South America
List of Companies Covered in this Report:
- Environmental Systems Research Institute, Inc.
- HERE Global B.V.
- TomTom N.V.
- Precisely, Inc.
- CARTO, Inc.
- Mapbox, Inc.
- Trimble Inc.
- Hexagon AB
- Bentley Systems, Incorporated
- Fugro N.V.
- Planet Labs PBC
- Maxar Intelligence Inc.
- Spire Global, Inc.
- BlackSky Technology Inc.
- Satellogic Inc.
- MDA Space Ltd.
- SuperMap Software Co., Ltd.
- Nearmap Ltd.
- SafeGraph Inc.
- Kongsberg Geospatial AS
- Orbital Insight, Inc.
- Foursquare Labs, Inc.
Additional Benefits:
- The market estimate (ME) sheet in Excel format
- 3 months of analyst support
TABLE OF CONTENTS
1 INTRODUCTION
- 1.1 Study Assumptions and Market Definition
- 1.2 Scope of the Study
2 RESEARCH METHODOLOGY
3 EXECUTIVE SUMMARY
4 MARKET LANDSCAPE
- 4.1 Market Overview
- 4.2 Market Drivers
- 4.2.1 Enterprise Shift Toward Real-Time Spatial Decision Intelligence
- 4.2.2 Smart-City and Digital-Infrastructure Investment
- 4.2.3 Location-Based Retail, Logistics, and Mobility Optimization
- 4.2.4 Expansion of Satellite, GNSS, Mobile, and IoT-Derived Data
- 4.2.5 AI-Enabled Geospatial Modeling and Digital Twins
- 4.2.6 Fragmented Address and Mobility Data Creating Demand for Regional Data Products
- 4.3 Market Restraints
- 4.3.1 High Total Cost of Geospatial Data and Platform Deployment
- 4.3.2 Data Privacy, Consent, and Cross-Border Transfer Constraints
- 4.3.3 Fragmented Address Standards and Inconsistent Data Quality
- 4.3.4 Shortage of GIS, Data-Science, and Spatial-Engineering Talent
- 4.4 Impact of Macroeconomic Factors on the Market
- 4.5 Industry Value Chain Analysis
- 4.6 Regulatory Landscape
- 4.7 Technological Outlook
- 4.8 Porter's Five Forces Analysis
- 4.8.1 Threat of New Entrants
- 4.8.2 Bargaining Power of Suppliers
- 4.8.3 Bargaining Power of Buyers
- 4.8.4 Threat of Substitutes
- 4.8.5 Intensity of Competitive Rivalry
5 MARKET SIZE AND GROWTH FORECASTS (VALUE)
- 5.1 By Offering
- 5.1.1 Software
- 5.1.2 Services
- 5.2 By Solution and Analytics Type
- 5.2.1 Data Integration and ETL
- 5.2.2 Geocoding and Reverse Geocoding
- 5.2.3 Reporting and Visualization
- 5.2.4 Thematic Mapping and Spatial Analysis
- 5.2.5 Network and Location Analytics
- 5.2.6 Surface and Field Analytics
- 5.2.7 Geovisualization
- 5.3 By Deployment Mode
- 5.3.1 Cloud
- 5.3.2 On-Premises
- 5.4 By Data and Sensing Modality
- 5.4.1 GNSS and Satellite-Derived Location Data
- 5.4.2 Mobile Network and Device-Derived Data
- 5.4.3 Wi-Fi and BLE-Derived Data
- 5.4.4 IoT and Sensor-Fusion Data
- 5.5 By End User
- 5.5.1 Retail and E-Commerce
- 5.5.2 Automotive, Transportation, and Logistics
- 5.5.3 BFSI
- 5.5.4 Government and Defense
- 5.5.5 Telecommunications
- 5.5.6 Healthcare and Life Sciences
- 5.5.7 Manufacturing and Industrial
- 5.5.8 Other End User Industries
- 5.6 By Organization Size
- 5.6.1 Large Enterprises
- 5.6.2 Small and Medium-Sized Enterprises
- 5.7 By Geography
- 5.7.1 Brazil
- 5.7.2 Argentina
- 5.7.3 Colombia
- 5.7.4 Rest of South America
6 COMPETITIVE LANDSCAPE
- 6.1 Market Concentration
- 6.2 Strategic Moves
- 6.3 Market Share Analysis
- 6.4 Company Profiles (includes Global Level Overview, Market Level Overview, Core Segments, Financials as available, Strategic Information, Market Rank/Share, Products and Services, Recent Developments)
- 6.4.1 Environmental Systems Research Institute, Inc.
- 6.4.2 HERE Global B.V.
- 6.4.3 TomTom N.V.
- 6.4.4 Precisely, Inc.
- 6.4.5 CARTO, Inc.
- 6.4.6 Mapbox, Inc.
- 6.4.7 Trimble Inc.
- 6.4.8 Hexagon AB
- 6.4.9 Bentley Systems, Incorporated
- 6.4.10 Fugro N.V.
- 6.4.11 Planet Labs PBC
- 6.4.12 Maxar Intelligence Inc.
- 6.4.13 Spire Global, Inc.
- 6.4.14 BlackSky Technology Inc.
- 6.4.15 Satellogic Inc.
- 6.4.16 MDA Space Ltd.
- 6.4.17 SuperMap Software Co., Ltd.
- 6.4.18 Nearmap Ltd.
- 6.4.19 SafeGraph Inc.
- 6.4.20 Kongsberg Geospatial AS
- 6.4.21 Orbital Insight, Inc.
- 6.4.22 Foursquare Labs, Inc.
7 MARKET OPPORTUNITIES AND FUTURE OUTLOOK
- 7.1 White-Space and Unmet-Need Assessment

 位置分析市場規模、佔有率和趨勢分析報告:按組件、分析類型、技術、位置類型、部署方式、企業規模、最終用途和細分市場預測(2026-2033 年)
 中東和非洲地區市場分析:市場佔有率分析、行業趨勢和統計數據、成長預測(2026-2031年)歐洲位置分析:市場佔有率分析、行業趨勢和統計數據、成長預測(2026-2031 年)北美地區市場分析:市場佔有率分析、產業趨勢與統計、成長預測(2026-2031 年)
 位置分析市場:按組件、部署模式、分析類型和應用分類-2026-2032年全球市場預測
 位置分析市場:按元件、位置類型、部署方式、產業和地區分類
 2026年全球位置分析市場報告
 位置分析市場規模、佔有率、趨勢和預測:按組件、部署類型、位置類型、應用、最終用戶行業和地區分類,2026-2034 年
 位置分析市場分析及預測(至 2035 年):按類型、產品類型、服務、技術、組件、應用、部署類型、最終用戶和解決方案分類
 全球位置分析市場(至 2035 年):按組件類型、位置類型、部署類型、應用類型、行業類型、地區、行業趨勢和預測