


 |
市場調查報告書
商品編碼
2125608
印度製造業:市場佔有率分析、產業趨勢與統計及成長預測(2026-2031)India Manufacturing - Market Share Analysis, Industry Trends & Statistics, Growth Forecasts (2026 - 2031) |
||||||

※ 本網頁內容可能與最新版本有所差異。詳細情況請與我們聯繫。
根據 Mordor Intelligence 預測,印度製造業市場規模預計在 2025 年達到 1.63 兆美元,2026 年達到 1.74 兆美元,到 2031 年達到 2.47 兆美元,2026 年至 2031 年的複合年成長率為 7.26%。
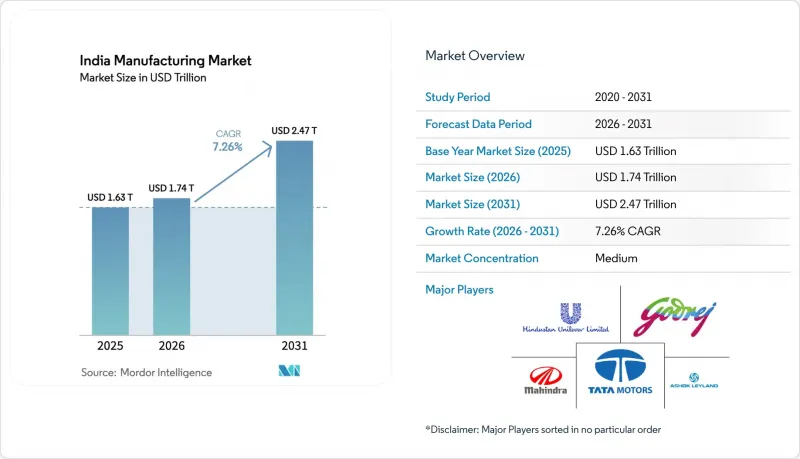
本報告按所有權類型(公共部門、其他)、最終用戶產業(汽車及零件、其他)、工廠規模(大型企業)和地區(印度北部、其他)進行細分。市場預測以美元計價。
印度製造業市場趨勢與洞察
擴大PLI 2.0獎勵,重點在於綠色氫能、先進化學電池和半導體。
PLI 2.0 計畫向新興產業累計260 億美元,由於 50% 的補貼與銷售成長掛鉤,因此受益企業必須在開工建設前簽訂長期收購協議。計劃在古吉拉突邦和卡納塔克邦建設的三家晶圓廠預計到 2027 年將月產能擴大至 8.5 萬片晶圓;同時,電池獎勵正在推動到 2028 年生產計畫。氫能領域的津貼涵蓋每年 120 萬噸電解槽,並已獲得 40 億美元的私人投資承諾。分階段支付方案(預付 20%,剩餘 80% 與績效掛鉤)降低了財務風險,但中小企業在產能擴張期間可能會面臨融資困難。總體而言,該計劃在未來幾年內保證了國內需求的下限,其連鎖反應將波及整個零件供應鏈。
「四方安全對話」(「中國+1」)對供應鏈的重組正在推動OEM訂單流向印度。
隨著蘋果和三星在印度擴大組裝廠規模,預計到2025年,製造業的外國直接投資(FDI)將達到220億美元,年增34%。四方機制的供應鏈韌性舉措已撥款50億美元用於支持印度製造業,因為中型電子產品和汽車零件的訂單正轉向印度供應商。富士康和和碩目前在印度僱用了8.7萬名員工,三星已將其全球30%的洗衣機產能轉移到諾伊達。然而,由於顯示器和感測器等零件依賴進口,行動電話的附加價值中只有38%是在本地創造的,這表明印度在後向整合方面仍有很大的提升空間。
持續存在的物流瓶頸:港口停留時間和鐵路運輸到內陸地區的比例不到 30%。
儘管預計到2025年平均港口停留時間將縮短至2.8天,但仍是科倫坡港的兩倍,新加坡港的三倍,這推高了出口商的庫存成本。在賈瓦哈拉爾·尼赫魯港,季風高峰期排隊等候時間可長達七天,迫使電子產品托運人轉向成本高昂的空運。由於只有五分之一的工業園區設有鐵路專用線,且印度的列車週轉時間為5.2天(中國為2.8天),鐵路貨運僅佔總量的27.3%。土地糾紛導致東部貨運走廊的建設工期延誤了18個月,延後了預期中貨運成本降低30%的目標。除非最後一公里連接能夠跟上主要走廊的發展步伐,否則印度的高物流成本將持續存在。
細分市場分析
到2025年,私人企業將佔印度製造業市場佔有率的71.68%,其中私營微型、中型和微企業(MSME)預計到2031年將以10.04%的複合年成長率(CAGR)超過整體市場成長率。數位發票貼現和生產關聯激勵計畫(PLI)補貼吸引了14個全球品牌,使Dixon Technologies的收入成長至20.4億美元。受傳統退休金制度的束縛,公共部門企業,例如Bharat Heavy Electricals,在2025會計年度的新訂單下降了11%。混合所有製企業和總合合計僅佔10%的市場佔有率,但面臨資金籌措限制。因此,印度製造業市場依賴靈活的私人企業作為成長動力,而國營企業則在重工業的基礎建設中發揮穩定作用。
放鬆管制,包括自動解除100%外商直接投資(FDI)禁令以及取消大多數類別的許可製度,鞏固了私人企業的主導地位。在迪克森(Dixon)、阿瑟(Asser)等公司的推動下,隨著在地採購的增加,印度製造業市場規模持續擴大。同時,合作社在甘蔗價格管制下舉步維艱,拖欠農民的費用總額高達26.4億美元,阻礙了技術升級。未來,微型、中型和微企業(MSME)將利用數位信用和商品及服務稅(GST)合規性來獲得原始設備製造商(OEM)的訂單,從而鞏固一種層級構造:靈活的供應商為大規模整合商提供支援。
其他好處:
- Excel格式的市場預測(ME)表
- 3個月的分析師支持
目錄
第1章:引言
- 研究假設和市場定義
- 調查範圍
第2章:調查方法
第3章執行摘要
第4章 市場狀況
- 市場概覽
- 市場促進因素
- 擴大「PLI 2.0」獎勵,重點發展綠氫能、先進化學電池和半導體。
- 四個國家(“中國+1”)之間的供應鏈重組導致來自印度的原始設備製造商訂單集中到印度。
- 二、三線城市都市化和電子商務倉庫擴張帶動國內消費快速成長。
- 透過「加蒂沙克蒂」多式聯運物流計畫加快工業走廊的連接
- 國防採購中的抵銷義務正在推動精密製造能力的擴張。
- 強制揭露 ESG 資訊(BRSR)正在加速對維修的投資,以創建節能的「工業 4.0」設施。
- 市場限制因素
- 物流瓶頸依然存在,導致港口停留時間延長,鐵路運輸在內陸運輸中所佔比例不到 30%。
- 儘管國家層級進行了改革,但土地徵用工作進展緩慢,導致計畫前置作業時間延長。
- 關鍵礦產(銅、鋰)價格的波動對投入成本的利潤率帶來了壓力。
- 半導體製造廠嚴重缺乏人員和無塵室技術人員。
- 政府措施和政策
- 近期投資趨勢和發展
- 製造業叢集(按州分類)
- 印度製造業的歷史變遷
- 地緣政治事件對市場的影響
- 價值供應鏈分析
- 監理情勢
- 技術趨勢(工業4.0、積層製造、人工智慧)
- 產業吸引力—五力分析
- 新進入者的威脅
- 買方的議價能力
- 供應商的議價能力
- 替代品的威脅
- 競爭公司之間的競爭
第5章 市場規模與成長預測
- 依所有權類型
- 公部門
- 私部門
- 聯合部門
- 合作部門
- 按最終用戶行業分類
- 汽車及汽車零件
- 紡織服裝
- 電子設備和電氣裝置
- 食品/飲料
- 藥品和醫療保健
- 建築材料
- 化學品
- 航太/國防
- 金屬
- 機械/資本財
- 其他(家具等)
- 按植物大小
- 大公司
- 中型公司
- 小規模和微企業(中小微型企業)
- 按地區
- 印度北部
- 西印度群島
- 南印度
- 印度東部和東北部
第6章 競爭情勢
- 市場集中度
- 策略趨勢
- 市佔率分析
- 公司簡介
- Reliance Industries Ltd
- Tata Motors Ltd
- Mahindra & Mahindra Ltd
- Maruti Suzuki India Ltd
- Tata Steel Ltd
- Larsen & Toubro Ltd
- JSW Steel Ltd
- Hindustan Unilever Ltd
- Godrej Group
- Ashok Leyland Ltd
- Hero MotoCorp Ltd
- TVS Motor Company Ltd
- Bharat Forge Ltd
- Bharat Electronics Ltd
- Bosch Ltd(India)
- Dixon Technologies(India)Ltd
- Vedanta Ltd
- Aditya Birla Group(Hindalco, UltraTech)
- Apollo Tyres Ltd
- MRF Ltd
- Ather Energy Pvt Ltd
第7章 市場機會與未來展望
According to Mordor Intelligence, the India manufacturing market size is projected to be USD 1.63 trillion in 2025, USD 1.74 trillion in 2026, and reach USD 2.47 trillion by 2031, growing at a CAGR of 7.26% from 2026 to 2031.
This report is Segmented by Ownership (Public Sector, and Others), by End-User Industry (Automotive & Auto Components, and Others), by Plant Size (Large Enterprises), and by Geography (North India, and Others). The Market Forecasts are Provided in Terms of Value (USD).
India Manufacturing Market Trends and Insights
Expanded PLI 2.0 Incentives Covering Green Hydrogen, Advanced Chemistry Batteries & Semiconductors
PLI 2.0 has lined up USD 26 billion for sunrise sectors and ties 50% of subsidies to incremental sales, so recipients must close long-term offtake deals before ground-breaking. Three wafer fabs targeted for Gujarat and Karnataka will lift monthly capacity to 85,000 wafers by 2027, while battery incentives backed plans for 50 GWh of cells by 2028. Hydrogen awards cover 1.2 million t/y of electrolyzers and have already drawn USD 4 billion of private spending pledges. Staggered payouts (20% upfront, 80% performance-linked) lower fiscal risk, yet smaller firms face liquidity gaps during ramp-up. Overall, the scheme locks in a multi-year domestic-demand floor that will ripple across component supply chains.
Quad Supply-Chain Realignment ("China + 1") Funnelling OEM Orders to India
FDI in manufacturing climbed to USD 22 billion in 2025, 34% above the previous year, as Apple and Samsung deepened India assembly footprints. The Quad supply-chain-resilience initiative earmarks USD 5 billion of concessional credit, tilting orders for mid-tier electronics and auto parts toward Indian vendors. Foxconn and Pegatron now employ 87,000 workers, while Samsung moved 30% of global washer output to Noida. Yet imported displays and sensors mean only 38% of handset value is locally added, indicating scope for deeper backward integration.
Persistent Logistics Bottlenecks: Port Dwell Times & Hinterland Rail Share less than 30%
Average port dwell fell to 2.8 days in 2025, yet remains double Colombo's and triple Singapore's, hiking inventory costs for exporters. Jawaharlal Nehru Port saw seven-day queues in monsoon peaks, pushing electronics shippers to costly air freight. Rail's cargo share languishes at 27.3% because only one-fifth of parks have sidings, while rake turnaround is 5.2 days versus China's 2.8 days. Completion of the Eastern Freight Corridor slipped 18 months due to land disputes, delaying anticipated 30% freight-cost cuts. Unless last-mile links keep pace with trunk corridors, India's logistics penalty will persist.
Other drivers and restraints analyzed in the detailed report include:
- Domestic Consumption Surge from Tier-2/3 Urbanization and E-Commerce Warehousing Growth
- Fast-Track Industrial-Corridor Connectivity via Gati Shakti Projects
- Land-Acquisition Delays Despite State Reforms, Prolonging Project Lead Times
For complete list of drivers and restraints, kindly check the Table Of Contents.
Segment Analysis
Private firms commanded a 71.68% India manufacturing market share in 2025, while private MSMEs will outpace the broader market at 10.04% CAGR through 2031. Digital invoice discounting and PLI subsidies let Dixon Technologies lift revenue to USD 2.04 billion by onboarding 14 global brands. Public-sector units, burdened by legacy pensions, saw Bharat Heavy Electricals' new orders dip 11% in FY 2025. Joint-sector and cooperative ventures together held barely 10% but face restricted capital access. The India manufacturing market, therefore, leans on agile private players for growth while state enterprises stabilize heavy-industry baselines.
Regulatory liberalization, including automatic 100% FDI and licensing abolition for most categories, has entrenched private dominance. The India manufacturing market size generated by Dixon, Ather, and similar firms keeps broadening as localized sourcing climbs. Cooperatives struggle under controlled cane pricing, amassing USD 2.64 billion in farmer arrears that crimp tech upgrades. Looking ahead, MSMEs will exploit digital credit and GST compliance histories to win OEM mandates, cementing a two-tier structure of nimble suppliers feeding scale integrators.
Complete Report Scope:
- By Ownership
- Public Sector
- Private Sector
- Joint Sector
- Cooperative Sector
- By End-user Industry
- Automotive & Auto Components
- Textile & Apparel
- Electronics & Electricals
- Food & Beverages
- Pharmaceuticals & Healthcare
- Construction Materials
- Chemicals
- Aerospace & Defence
- Metals
- Machinery and Capital Goods
- Others (Furniture, etc.)
- By Plant Size
- Large Enterprises
- Medium Enterprises
- Small & Micro (MSMEs)
- By Geography
- North India
- West India
- South India
- East & North-East India
List of Companies Covered in this Report:
- Reliance Industries Ltd
- Tata Motors Ltd
- Mahindra & Mahindra Ltd
- Maruti Suzuki India Ltd
- Tata Steel Ltd
- Larsen & Toubro Ltd
- JSW Steel Ltd
- Hindustan Unilever Ltd
- Godrej Group
- Ashok Leyland Ltd
- Hero MotoCorp Ltd
- TVS Motor Company Ltd
- Bharat Forge Ltd
- Bharat Electronics Ltd
- Bosch Ltd (India)
- Dixon Technologies (India) Ltd
- Vedanta Ltd
- Aditya Birla Group (Hindalco, UltraTech)
- Apollo Tyres Ltd
- MRF Ltd
- Ather Energy Pvt Ltd
Additional Benefits:
- The market estimate (ME) sheet in Excel format
- 3 months of analyst support
TABLE OF CONTENTS
1 Introduction
- 1.1 Study Assumptions & Market Definition
- 1.2 Scope of the Study
2 Research Methodology
3 Executive Summary
4 Market Landscape
- 4.1 Market Overview
- 4.2 Market Drivers
- 4.2.1 Expanded PLI 2.0 incentives covering green hydrogen, advanced chemistry batteries & semiconductors
- 4.2.2 Quad supply-chain realignment ("China + 1") funnelling OEM orders to India
- 4.2.3 Domestic consumption surge from tier-2/3 urbanisation and e-commerce warehousing growth
- 4.2.4 Fast-track industrial-corridor connectivity via Gati Shakti multimodal logistics projects
- 4.2.5 Defence-procurement offset obligations catalysing precision-manufacturing capacity
- 4.2.6 Mandatory ESG disclosure (BRSR) accelerating investment in energy-efficient Industry 4.0 retrofits
- 4.3 Market Restraints
- 4.3.1 Persistent logistics bottlenecks port dwell times & hinterland rail share less than 30 %
- 4.3.2 Land-acquisition delays despite state reforms, prolonging project lead times
- 4.3.3 Volatile critical-mineral prices (copper, lithium) squeezing input-cost margins
- 4.3.4 Acute shortage of semiconductor-fab talent & clean-room engineers
- 4.4 Government Initiatives & Schemes
- 4.5 Recent Investments & Developments
- 4.6 Manufacturing Clusters (state-wise)
- 4.7 Historical Evolution of Indian Manufacturing
- 4.8 Impact of Geopolitical Events on the Market
- 4.9 Value / Supply-Chain Analysis
- 4.10 Regulatory Landscape
- 4.11 Technological Outlook (Industry 4.0, Additive Mfg, AI)
- 4.12 Industry Attractiveness - Porter's Five Forces
- 4.12.1 Threat of New Entrants
- 4.12.2 Bargaining Power of Buyers
- 4.12.3 Bargaining Power of Suppliers
- 4.12.4 Threat of Substitutes
- 4.12.5 Competitive Rivalry
5 Market Size & Growth Forecasts (Value, In USD Billion)
- 5.1 By Ownership
- 5.1.1 Public Sector
- 5.1.2 Private Sector
- 5.1.3 Joint Sector
- 5.1.4 Cooperative Sector
- 5.2 By End-user Industry
- 5.2.1 Automotive & Auto Components
- 5.2.2 Textile & Apparel
- 5.2.3 Electronics & Electricals
- 5.2.4 Food & Beverages
- 5.2.5 Pharmaceuticals & Healthcare
- 5.2.6 Construction Materials
- 5.2.7 Chemicals
- 5.2.8 Aerospace & Defence
- 5.2.9 Metals
- 5.2.10 Machinery and Capital Goods
- 5.2.11 Others (Furniture, etc.)
- 5.3 By Plant Size
- 5.3.1 Large Enterprises
- 5.3.2 Medium Enterprises
- 5.3.3 Small & Micro (MSMEs)
- 5.4 By Geography
- 5.4.1 North India
- 5.4.2 West India
- 5.4.3 South India
- 5.4.4 East & North-East India
6 Competitive Landscape
- 6.1 Market Concentration
- 6.2 Strategic Moves
- 6.3 Market Share Analysis
- 6.4 Company Profiles (includes Global level Overview, Market level overview, Core Segments, Financials as available, Strategic Information, Products & Services, and Recent Developments)
- 6.4.1 Reliance Industries Ltd
- 6.4.2 Tata Motors Ltd
- 6.4.3 Mahindra & Mahindra Ltd
- 6.4.4 Maruti Suzuki India Ltd
- 6.4.5 Tata Steel Ltd
- 6.4.6 Larsen & Toubro Ltd
- 6.4.7 JSW Steel Ltd
- 6.4.8 Hindustan Unilever Ltd
- 6.4.9 Godrej Group
- 6.4.10 Ashok Leyland Ltd
- 6.4.11 Hero MotoCorp Ltd
- 6.4.12 TVS Motor Company Ltd
- 6.4.13 Bharat Forge Ltd
- 6.4.14 Bharat Electronics Ltd
- 6.4.15 Bosch Ltd (India)
- 6.4.16 Dixon Technologies (India) Ltd
- 6.4.17 Vedanta Ltd
- 6.4.18 Aditya Birla Group (Hindalco, UltraTech)
- 6.4.19 Apollo Tyres Ltd
- 6.4.20 MRF Ltd
- 6.4.21 Ather Energy Pvt Ltd
7 Market Opportunities & Future Outlook
- 7.1 White-space & Unmet-need Assessment

 歐洲金屬精密車削產品製造:市場佔有率分析、產業趨勢與統計、成長預測(2026-2031)
 工業和製造市場研究服務工業和製造技術研究服務
 製造業中的ESG:市場規模、佔有率、成長、全球產業分析、區域趨勢及2026-2034年預測全球製造業ESG市場規模、佔有率、趨勢和成長分析報告(2026-2034年)工業和製造業資訊通訊技術:市場佔有率分析、行業趨勢和統計數據、成長預測(2026-2031 年)製造業客戶體驗成長機會:2025-2026 年
 光伏電池雷射加工設備市場規模、佔有率和成長分析:按雷射技術、機器配置、晶圓類型、應用、自動化程度、最終用戶產業和地區分類-2026-2033年產業預測
 製造業調查回顧:2025 年
 全球製造業市場:按產業、技術和地區分類