


 |
市場調查報告書
商品編碼
2125342
企業級擴增實境:市場佔有率分析、產業趨勢與統計及成長預測(2026-2031 年)Enterprise Augmented Reality - Market Share Analysis, Industry Trends & Statistics, Growth Forecasts (2026 - 2031) |
||||||

※ 本網頁內容可能與最新版本有所差異。詳細情況請與我們聯繫。
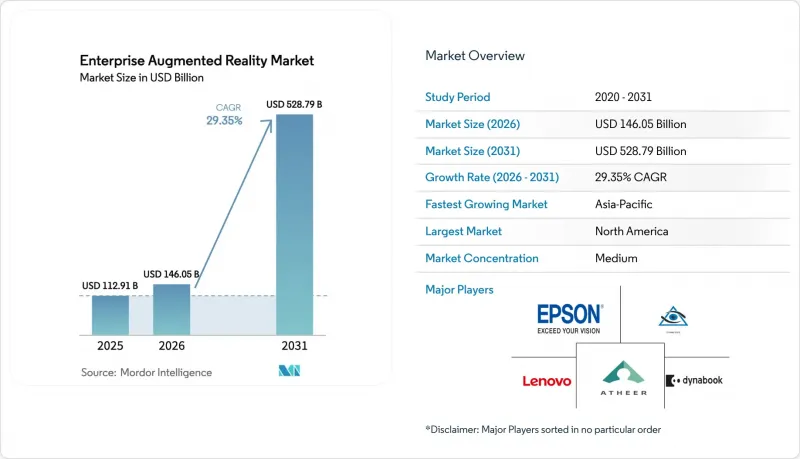
據 Mordor Intelligence 稱,2025 年企業 AR 市場價值為 1129.1 億美元,預計到 2031 年將達到 5287.9 億美元,而 2026 年為 1460.5 億美元,預測期(2026-2031 年)的複合成長率為 29.35%。
本報告按組件(硬體、軟體、服務)、部署方式(本地部署、雲端/ARaaS)、設備(頭戴式/智慧眼鏡、其他)、應用(遠端協助/協作、培訓/模擬、其他)、最終用戶(工業製造、汽車/航太、其他)和地區進行細分。市場預測以美元計價。
全球企業級擴增實境市場趨勢與洞察
工業試驗計畫可實現快速投資報酬率演示
隨著先導計畫帶來實際的成本節約和生產力提升,企業正逐步超越概念驗證(PoC)階段。福特位於迪爾伯恩的引擎工廠已向技術人員部署了HoloLens 2,首批培訓了25名員工,併計劃在年底前將培訓規模擴大到100人,同時取得了可衡量的品質提升。可口可樂一家工廠的類似倉庫項目已將揀貨準確率提高到99.9%。這些公開揭露的成功案例正在縮短內部核准週期,並為多站點部署提供依據,加速企業擴增實境(AR)市場的普及。
智慧型手機級 RISC-V 處理器顯著降低了設備物料清單成本。
開放原始碼的RISC-V晶片組以顯著更低的組件成本提供智慧型手機等級的運算能力。 XREAL的X1處理器無需有線連接,使該公司能夠在智慧眼鏡定價499美元至599美元之間時保持利潤率。成本的降低擴大了目標用戶群體,並實現了批量採購,這對於在成本敏感型行業中拓展企業級AR市場至關重要。
邊緣運算中的安全漏洞
將處理任務分散到頭戴式設備、本地閘道器和雲端節點上會擴大攻擊面,這對於擁有特殊流程或處理危險材料的工廠來說是一個令人擔憂的問題。許多 IT 團隊缺乏專門針對 AR 的安全手冊,導致零信任架構的有效性尚未得到驗證,從而延緩了 AR 技術的普及。合規性審計會增加額外的開銷,暫時減緩企業 AR 市場的部分需求成長。
細分市場分析
預計2026年至2031年間,服務部門將以33.20%的複合年成長率成長,並有望超越淨產品銷售板塊的成長,因為企業越來越依賴整合商提供的與部署、用戶培訓和運作相關的服務等級協定(SLA)。服務合作夥伴正從最初的硬體試點轉向全廠部署,這一趨勢正在推動企業擴增實境(AR)市場轉向基於結果的合約模式。諸如人工智慧驅動的工單生成等創新技術正在實現內容創建的自動化並縮短引進週期。
組件配置的轉變顯示市場已趨於成熟。頭戴式設備部署完成後,價值將轉移到分析、更新周期和持續改進的諮詢服務。供應商透過將軟體訂閱與現場變更管理相結合,在企業級擴增實境(AR)市場中確保經常性收入、深化客戶關係並提高長期客戶留存率。
儘管預計到2025年頭戴式設備仍將維持51.85%的市場佔有率,但隨著工廠採用共用3D工作空間進行協作,投影和空間顯示系統正以36.10%的複合年成長率快速成長。投影技術因其佩戴舒適性,在操作員培訓區、積層製造單元和品質檢查室等團隊聚集於通用參考點的場所備受青睞。工業4.0先導計畫已證實,空間佈局能夠縮短設計評審時間並最大限度地減少返工。
同時,輕量化光學技術的研究已將頭戴式設備的重量降低至200克以下,使其更適合在整個輪班期間使用。因此,企業正在採用多模態工具包。技術人員戴上頭戴式顯示器,而主管則利用大規模投影設備,這共同加速了整個企業擴增實境(AR)市場設備的多元化發展。
區域分析
預計到2025年,北美將佔全球收入的35.75%,這主要得益於成熟的IT預算、國防級別的監管要求以及美國職業安全與健康管理局(OSHA)採納了UL 8400 AR/VR設備安全標準。微軟和Anduril共同開發的整合視覺增強系統(IVAS)體現了政府主導的向商業領域的擴張。該地區強大的開發者生態系統正在加速客製化應用的開發,並鞏固其在企業級AR市場的領先地位。
亞太地區是成長最快的地區,複合年成長率高達31.10%。光是在中國,預計到2025年智慧眼鏡的出貨量就將達到275萬副,是前一年出貨量的兩倍多。 XREAL在全球AR眼鏡產品出貨量中佔51%的佔有率,凸顯了該地區光學製造業的崛起。政府為工廠數位化和5G部署提供的獎勵正在整個產業走廊內推廣,促進了與本地系統整合商和超大規模雲端服務供應商的緊密合作。
在歐洲,工業4.0藍圖、與環境、社會和治理(ESG)相關的資本投資以及嚴格的工人安全指令正在推動穩定成長。德國和法國的汽車產業叢集正在採用協作式擴增實境(AR)技術來降低車型轉換帶來的風險,而離岸風力發電電場則正在實施太空孿生技術以進行維護排序。歐洲大陸正在強調互通性標準,這促成了跨供應商聯盟的出現,這些聯盟有望建立全球框架,並影響整個企業級AR市場的採購。
其他好處:
- Excel格式的市場預測(ME)表
- 3個月的分析師支持
目錄
第1章:引言
- 研究假設和市場定義
- 調查範圍
第2章:調查方法
第3章執行摘要
第4章 市場狀況
- 市場概覽
- 市場促進因素
- 工業試驗計畫已證實能快速實現投資回報
- 智慧型手機級 RISC-V 處理器顯著降低了設備物料清單成本。
- 頭戴式擴增實境技術在野外工作的主流化
- 利用 5G/專用 LTE 網路實現超低延遲 AR 串流播放
- 被忽略的一點:與ESG掛鉤的AR訓練設備資本投資信用
- 一項被忽視的進展:美國職業安全與健康管理局 (OSHA) 強制要求高風險工廠實施數位孿生技術。
- 市場限制因素
- 邊緣運算中的安全漏洞
- 傳統MES/PLM系統的整合成本
- 一個被忽視的問題:光波導供應鏈正面臨人手不足。
- 隱藏的發展:圍繞 SLAM IP 的專利流氓訴訟案件有所增加。
- 價值鏈分析
- 監理情勢
- 科技趨勢(AR雲、太空人工智慧)
- 波特五力分析
- 市場宏觀經濟趨勢的評估
第5章 市場規模與成長預測
- 按組件
- 硬體
- 軟體
- 服務
- 依設備類型
- 頭戴式智慧眼鏡
- 手持/行動擴增實境
- 投影/空間
- 其他(HUD、頭盔式)
- 透過使用
- 遠端支援與協作
- 訓練模擬
- 維護和檢查
- 設計/視覺化
- 銷售與行銷
- 工作流程和品管
- 按最終用戶行業分類
- 工業製造
- 汽車和航太
- 能源公用事業
- 衛生保健
- 零售與電子商務
- 物流和倉儲
- 其他終端用戶產業(公共安全、農業)
- 不同的發展
- 現場
- 雲/ARaaS
- 按地區
- 北美洲
- 美國
- 加拿大
- 墨西哥
- 歐洲
- 德國
- 英國
- 法國
- 義大利
- 西班牙
- 俄羅斯
- 其他歐洲國家
- 亞太地區
- 中國
- 日本
- 印度
- 韓國
- 澳洲和紐西蘭
- 東南亞
- 其他亞太國家
- 南美洲
- 巴西
- 阿根廷
- 智利
- 其他南美國家
- 中東
- 阿拉伯聯合大公國
- 沙烏地阿拉伯
- 土耳其
- 以色列
- 其他中東國家
- 非洲
- 南非
- 埃及
- 奈及利亞
- 其他非洲國家
- 北美洲
第6章 競爭情勢
- 市場集中度
- 策略趨勢
- 市佔率分析
- 公司簡介
- Microsoft Corporation
- PTC Inc.(Vuforia)
- Magic Leap Inc.
- Vuzix Corporation
- Lenovo Group Ltd.
- Google LLC(Glass Enterprise)
- Epson Corporation
- RealWear Inc.
- Rokid Inc.
- ThirdEye Gen Inc.
- Dynabook Americas Inc.
- Nextech AR Solutions Corp.
- Librestream Technologies Inc.
- TeamViewer AG(Frontline)
- Scope AR
- Trimble Inc.
- Qualcomm Technologies Inc.
- Zebra Technologies Corp.
- Apple Inc.(visionOS enterprise SDK)
- Atheer Inc.
- Plutomen Technologies Pvt Ltd.
- Dalux A/S
第7章 市場機會與未來展望
According to Mordor Intelligence, the enterprise augmented reality market size was valued at USD 112.91 billion in 2025 and estimated to grow from USD 146.05 billion in 2026 to reach USD 528.79 billion by 2031, at a CAGR of 29.35% during the forecast period (2026-2031).
This report is Segmented by Component (Hardware, Software, and Services), Deployment (On-Premise, and Cloud/AR-as-a-Service), Device (Head-mounted/Smart-glasses, and More), Application (Remote Assistance and Collaboration, Training and Simulation, and More), End-User (Industrial Manufacturing, Automotive and Aerospace, and More), and Geography. The Market Forecasts are Provided in Terms of Value (USD).
Global Enterprise Augmented Reality Market Trends and Insights
Rapid ROI-proof Industrial Pilot Programs
Enterprises move beyond proofs of concept because pilot projects consistently deliver hard savings and productivity lifts. Ford's Dearborn engine plant documented measurable quality gains after equipping technicians with HoloLens 2, training 25 workers initially and planning to scale to 100 by year-end. Similar warehouse programs pushed order-picking accuracy to 99.9% at Coca-Cola operations. These publicly reported successes shorten internal approval cycles and justify multi-site roll-outs, accelerating the enterprise augmented reality market's penetration curve.
Smartphone-class RISC-V Processors Slashing Device BOM
Open-source RISC-V chipsets provide smartphone-level compute at materially lower bill-of-materials. XREAL's X1 processor removed the need for tethered devices, letting the firm price its smart glasses at USD 499-599 and still sustain gross margins. Lower costs broaden the addressable user base and allow fleet-sized procurements, a critical lever for scaling the enterprise augmented reality market in cost-sensitive industrial segments.
Edge-compute Security Gaps
Distributing processing across headsets, on-premise gateways, and cloud nodes widens the attack surface, a concern for plants handling proprietary processes or hazardous materials. Many IT teams lack AR-specific security playbooks, resulting in delayed roll-outs until zero-trust architectures are proven. Compliance audits add further overhead, temporarily dampening some demand curves within the enterprise augmented reality market.
Other drivers and restraints analyzed in the detailed report include:
- Mainstream Shift to Head-mounted AR for Frontline Work
- 5G/Private-LTE Enabling Ultra-low-latency AR Streaming
- Legacy MES/PLM Integration Costs
For complete list of drivers and restraints, kindly check the Table Of Contents.
Segment Analysis
The Services segment is projected to expand at 33.20% CAGR from 2026-2031, overtaking pure product revenue as firms lean on integrators for rollout, user training, and uptime SLAs. Services partners convert early hardware pilots into plant-wide deployments, a trend that underpins the enterprise augmented reality market's shift toward outcome-based contracting. Innovations such as AI-generated work instructions automate content creation and cut deployment cycles.
The component mix evolution signals maturation: once fleets of headsets are installed, value migrates to analytics, refresh cycles, and continuous improvement consulting. Vendors are bundling software subscriptions with on-site change-management to lock in recurring revenue and deepen client intimacy, reinforcing long-run stickiness across the enterprise augmented reality market.
Head-mounted units retained 51.85% share in 2025, but projection and spatial systems are sprinting at 36.10% CAGR as factories deploy shared 3D workspaces for collaborative tasks. Projection eliminates wearability concerns and is favored for operator training bays, additive-manufacturing cells, and quality cabins where teams gather around a common reference. Industry 4.0 pilots confirm that spatial setups shorten design reviews and cut rework loops.
Lightweight optics research is simultaneously reducing headset weight to under 200 g, widening suitability for shift-long use. Enterprises therefore adopt a multimodal toolkit: individual technicians wear head-mounted displays, while supervisors engage with large-scale projection, collectively accelerating device diversity across the enterprise augmented reality market.
Complete Report Scope:
- By Component
- Hardware
- Software
- Services
- By Device Type
- Head-mounted / Smart-glasses
- Handheld / Mobile AR
- Projection / Spatial
- Others (HUD, Helmet-mounted)
- By Application
- Remote Assistance and Collaboration
- Training and Simulation
- Maintenance and Inspection
- Design and Visualization
- Sales and Marketing
- Workflow and Quality Control
- By End-User Industry
- Industrial Manufacturing
- Automotive and Aerospace
- Energy and Utilities
- Healthcare
- Retail and E-commerce
- Logistics and Warehousing
- Other End-user Industries (Public Safety, Agriculture)
- By Deployment
- On-premise
- Cloud / AR-as-a-Service
- By Geography
- North America
- United States
- Canada
- Mexico
- Europe
- Germany
- United Kingdom
- France
- Italy
- Spain
- Russia
- Rest of Europe
- Asia-Pacific
- China
- Japan
- India
- South Korea
- Australia and New Zealand
- Southeast Asia
- Rest of Asia-Pacific
- South America
- Brazil
- Argentina
- Chile
- Rest of South America
- Middle East
- United Arab Emirates
- Saudi Arabia
- Turkey
- Israel
- Rest of Middle East
- Africa
- South Africa
- Egypt
- Nigeria
- Rest of Africa
- North America
Geography Analysis
North America delivered 35.75% of 2025 revenue on the back of mature IT budgets, defense-grade mandates, and OSHA's inclusion of UL 8400 AR/VR equipment safety standards. Microsoft's collaboration with Anduril on the Integrated Visual Augmentation System illustrates government pull-through into commercial sectors. The region's robust developer ecosystem accelerates bespoke application creation, reinforcing leadership across the enterprise augmented reality market.
Asia-Pacific is the fastest-growing theatre at 31.10% CAGR. China alone is expected to ship 2.75 million smart-glasses units in 2025, more than doubling year on year. XREAL's 51% share of global AR eyewear shipments highlights regional ascendancy in optics manufacturing. Government incentives tied to factory digitalization and 5G coverage blanket industrial corridors, pulling local integrators and hyperscale cloud providers into tight alignment.
Europe posts steady gains, anchored by Industry 4.0 roadmaps, ESG-linked capex, and stringent worker-safety directives. Automotive clusters in Germany and France adopt collaborative AR to de-risk model transitions, while offshore wind farms deploy spatial twins for maintenance sequencing. The continent emphasizes interoperability standards, giving rise to cross-vendor consortia that could shape global frameworks and influence procurement across the enterprise augmented reality market.
- Microsoft Corporation
- PTC Inc. (Vuforia)
- Magic Leap Inc.
- Vuzix Corporation
- Lenovo Group Ltd.
- Google LLC (Glass Enterprise)
- Epson Corporation
- RealWear Inc.
- Rokid Inc.
- ThirdEye Gen Inc.
- Dynabook Americas Inc.
- Nextech AR Solutions Corp.
- Librestream Technologies Inc.
- TeamViewer AG (Frontline)
- Scope AR
- Trimble Inc.
- Qualcomm Technologies Inc.
- Zebra Technologies Corp.
- Apple Inc. (visionOS enterprise SDK)
- Atheer Inc.
- Plutomen Technologies Pvt Ltd.
- Dalux A/S
Additional Benefits:
- The market estimate (ME) sheet in Excel format
- 3 months of analyst support
TABLE OF CONTENTS
1 INTRODUCTION
- 1.1 Study Assumptions and Market Definition
- 1.2 Scope of the Study
2 RESEARCH METHODOLOGY
3 EXECUTIVE SUMMARY
4 MARKET LANDSCAPE
- 4.1 Market Overview
- 4.2 Market Drivers
- 4.2.1 Rapid ROI-proof industrial pilot programs
- 4.2.2 Smartphone-class RISC-V processors slashing device BOM
- 4.2.3 Mainstream shift to head-mounted AR for frontline work
- 4.2.4 5G/Private-LTE enabling ultra-low-latency AR streaming
- 4.2.5 Under-the-radar: ESG-linked capex credits for AR training gear
- 4.2.6 Under-the-radar: OSHA digital-twin mandates for high-risk plants
- 4.3 Market Restraints
- 4.3.1 Edge-compute security gaps
- 4.3.2 Legacy MES/PLM integration costs
- 4.3.3 Under-the-radar: Short-staffed optical-waveguide supply chain
- 4.3.4 Under-the-radar: Growing patent-troll litigation on SLAM IP
- 4.4 Value Chain Analysis
- 4.5 Regulatory Landscape
- 4.6 Technological Outlook (AR-Cloud, Spatial-AI)
- 4.7 Porter's Five Forces Analysis
- 4.7.1 Threat of New Entrants
- 4.7.2 Bargaining Power of Suppliers
- 4.7.3 Bargaining Power of Buyers
- 4.7.4 Threat of Substitutes
- 4.7.5 Competitive Rivalry
- 4.8 Assessment of Macro Economic Trends on the Market
5 MARKET SIZE AND GROWTH FORECASTS (VALUES)
- 5.1 By Component
- 5.1.1 Hardware
- 5.1.2 Software
- 5.1.3 Services
- 5.2 By Device Type
- 5.2.1 Head-mounted / Smart-glasses
- 5.2.2 Handheld / Mobile AR
- 5.2.3 Projection / Spatial
- 5.2.4 Others (HUD, Helmet-mounted)
- 5.3 By Application
- 5.3.1 Remote Assistance and Collaboration
- 5.3.2 Training and Simulation
- 5.3.3 Maintenance and Inspection
- 5.3.4 Design and Visualization
- 5.3.5 Sales and Marketing
- 5.3.6 Workflow and Quality Control
- 5.4 By End-User Industry
- 5.4.1 Industrial Manufacturing
- 5.4.2 Automotive and Aerospace
- 5.4.3 Energy and Utilities
- 5.4.4 Healthcare
- 5.4.5 Retail and E-commerce
- 5.4.6 Logistics and Warehousing
- 5.4.7 Other End-user Industries (Public Safety, Agriculture)
- 5.5 By Deployment
- 5.5.1 On-premise
- 5.5.2 Cloud / AR-as-a-Service
- 5.6 By Geography
- 5.6.1 North America
- 5.6.1.1 United States
- 5.6.1.2 Canada
- 5.6.1.3 Mexico
- 5.6.2 Europe
- 5.6.2.1 Germany
- 5.6.2.2 United Kingdom
- 5.6.2.3 France
- 5.6.2.4 Italy
- 5.6.2.5 Spain
- 5.6.2.6 Russia
- 5.6.2.7 Rest of Europe
- 5.6.3 Asia-Pacific
- 5.6.3.1 China
- 5.6.3.2 Japan
- 5.6.3.3 India
- 5.6.3.4 South Korea
- 5.6.3.5 Australia and New Zealand
- 5.6.3.6 Southeast Asia
- 5.6.3.7 Rest of Asia-Pacific
- 5.6.4 South America
- 5.6.4.1 Brazil
- 5.6.4.2 Argentina
- 5.6.4.3 Chile
- 5.6.4.4 Rest of South America
- 5.6.5 Middle East
- 5.6.5.1 United Arab Emirates
- 5.6.5.2 Saudi Arabia
- 5.6.5.3 Turkey
- 5.6.5.4 Israel
- 5.6.5.5 Rest of Middle East
- 5.6.6 Africa
- 5.6.6.1 South Africa
- 5.6.6.2 Egypt
- 5.6.6.3 Nigeria
- 5.6.6.4 Rest of Africa
- 5.6.1 North America
6 COMPETITIVE LANDSCAPE
- 6.1 Market Concentration
- 6.2 Strategic Moves
- 6.3 Market Share Analysis
- 6.4 Company Profiles (includes Global level Overview, Market level overview, Core Segments, Financials as available, Strategic Information, Market Rank/Share for key companies, Products and Services, and Recent Developments)
- 6.4.1 Microsoft Corporation
- 6.4.2 PTC Inc. (Vuforia)
- 6.4.3 Magic Leap Inc.
- 6.4.4 Vuzix Corporation
- 6.4.5 Lenovo Group Ltd.
- 6.4.6 Google LLC (Glass Enterprise)
- 6.4.7 Epson Corporation
- 6.4.8 RealWear Inc.
- 6.4.9 Rokid Inc.
- 6.4.10 ThirdEye Gen Inc.
- 6.4.11 Dynabook Americas Inc.
- 6.4.12 Nextech AR Solutions Corp.
- 6.4.13 Librestream Technologies Inc.
- 6.4.14 TeamViewer AG (Frontline)
- 6.4.15 Scope AR
- 6.4.16 Trimble Inc.
- 6.4.17 Qualcomm Technologies Inc.
- 6.4.18 Zebra Technologies Corp.
- 6.4.19 Apple Inc. (visionOS enterprise SDK)
- 6.4.20 Atheer Inc.
- 6.4.21 Plutomen Technologies Pvt Ltd.
- 6.4.22 Dalux A/S
7 MARKET OPPORTUNITIES AND FUTURE OUTLOOK
- 7.1 White-space and Unmet-need Assessment

 2026-2030年全球零售業擴增實境市場
 全球空間計算市場規模、佔有率、趨勢和成長分析報告(2026-2034)全球擴增實境(AR)市場規模、佔有率、趨勢和成長分析報告,2026-2034年擴增實境(AR)包裝全球市場規模、佔有率、趨勢和成長分析報告(2026-2034)
 供應鏈市場中的擴增實境(AR)-2026-2032年全球市場預測
 AR內容串流:市場佔有率分析、產業趨勢與統計及成長預測(2026-2031年)擴增實境:市場佔有率分析、產業趨勢與統計、成長預測(2026-2031)擴增實境(AR)市場-2026-2032年全球市場預測數位學習中的擴增實境(AR)市場-2026年至2032年全球市場預測
 全球空間運算市場:機會與策略展望(至2035年)