


 |
市場調查報告書
商品編碼
2120445
擴增實境:市場佔有率分析、產業趨勢與統計、成長預測(2026-2031)Augmented Reality - Market Share Analysis, Industry Trends & Statistics, Growth Forecasts (2026 - 2031) |
||||||

※ 本網頁內容可能與最新版本有所差異。詳細情況請與我們聯繫。
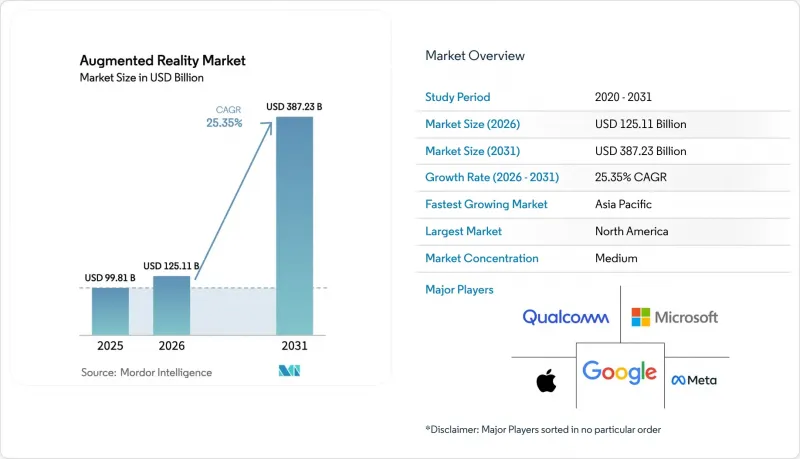
根據 Mordor Intelligence 預測,擴增實境(AR) 市場規模將從 2025 年的 998.1 億美元和 2026 年的 1251.1 億美元成長到 2031 年的 3872.3 億美元,2026 年至 2031 年的年複合成長率(CAGR)。
5G 的持續部署、雲端和邊緣架構的成熟,以及越來越多的公司從概念驗證 (PoC) 過渡到全面生產,都支撐著兩位數的成長。
本報告按交付類型(硬體和軟體)、核心技術(OLED/microOLED、microLED、波導和衍射光學等)、應用(遠端協助和維護、產品視覺化等)、終端用戶產業(遊戲和娛樂、教育、汽車和交通運輸等)以及地區進行細分。市場預測以美元(USD)為單位。
全球擴增實境(AR)市場趨勢與洞察
相容5G的低延遲行動網路
獨立組網的 5G 核心網往返延遲現已低於 10 毫秒,這使得雲端渲染疊加技術能夠將運算處理從處理能力有限的頭戴式裝置轉移到邊緣伺服器。晶片組製造商正在將專用 AI 引擎整合到 5G 數據機中,即使連接中斷,也能確保即時物體辨識的持續進行。 3GPP Release 18 為 XR 新增了專用的服務品質 (QoS) 等級,網路營運商正在進行試點,以確保即使在網路擁塞尖峰時段期也能保持影格速率穩定。儘管都市區的覆蓋範圍仍然不均衡,但工廠、港口和倉庫正在部署專用 5G 網路,以繞過公共網路,確保工業數位孿生的確定性性能。隨著覆蓋盲點的消除,擴增實境(AR) 市場有望在戶外 AR 導航、旅遊疊加和大型娛樂領域迎來轉折點。
簡化企業培訓和現場服務
已採用頭戴式顯示器的公司已證明,其投資報酬率 (ROI) 可將投資回收期縮短至 24 個月以內。一項獨立研究表明,遠端專家指導可減少技術人員 40% 的出行,而身臨其境型工作流程可將組裝缺陷率降低兩位數。航太、汽車和重型設備製造商報告稱,透過以擴增實境 (AR) 工作指導取代紙本手冊,生產週期縮短了 20% 至 30%。在工廠車間之外,使用免手持疊加技術的第一線服務機構的數據顯示,技術人員恢復使用舊方法的比例仍低於 5%,顯示行為改變正在發生。在宏觀經濟不確定性推動成本最佳化的背景下,AR 技術的顯著成本節約效果預計將加速擴增擴增實境市場的採購決策。
頭戴式顯示器的電池續航力和人體工學設計
目前市面上大多數頭戴式設備的連續運作時間不到2.5小時,遠低於全天工作所需的4小時。這些設備的重量仍然在500-600克左右,限制了它們在遊戲和長時間工業應用中的使用,因為許多用戶佩戴一小時後就會感到頸部疲勞。更明亮、更高解析度的光學元件可以增強沉浸感,但會更快消耗電池電量。反之,增加電池容量也會增加重量。雖然固態電池原型可望將能量密度提高50%,但大規模生產預計要到2028年才能實現。在此之前,人體工學方面的限制將阻礙擴增實境產品的普及,迫使企業將頭戴式裝置的使用限制在單一任務中,而不是在整個輪班期間使用。
細分市場分析
軟體產業預計在2025年實現最快的收入成長,訂閱、應用程式內收費和雲端渲染服務帶來的收入將超過頭戴式裝置本身的利潤,到2031年,其複合年成長率將達到28.76%。在硬體領域,獨立式和有線頭戴式顯示器以及無螢幕行動顯示器在2025年佔總支出的64.66%,但隨著Meta Quest等具成本效益設備以接近成本價的價格銷售以擴大裝置量,毛利率有所下降。 Unity開發框架支撐著約三分之二的行動和頭戴式AR應用程式發布,為專業創作者群體不斷壯大後持續的授權收入奠定了基礎。虛幻引擎在照片級真實感視覺化領域持續發展,而企業用戶則被能夠與現有資產管理系統整合的低程式碼工具包所吸引。隨著用戶數量的成長,軟體業務機會不斷擴大,即使組件成本下降,平台營運商也有望獲得不斷成長的終身價值。同時,儘管硬體藍圖正著眼於更輕巧的外形規格和更節能的晶片組,但商品化是不可避免的,擴增實境(AR) 市場的利潤正在果斷地轉向軟體和服務。
過去需要專業設計師參與的資產流程,如今可以按需自動生成紋理、光線和動畫。這種轉變正推動著總體擁有成本 (TCO) 轉向基於使用量的收費模式。隨著監管和保險框架的完善,醫療保健和國防等領域預計將出現多年平台訂閱協議,這將進一步強化軟體供應商的良性循環。因此,硬體 OEM 廠商已經開始試行與應用程式商店佣金率掛鉤的收入分成模式,這凸顯了 AR 市場價值中心正從實體設備逐步轉向數位管道。
由於供應鏈成熟且價格具競爭力,預計到2025年,OLED和microOLED顯示器將佔據擴增實境市場48.25%的營收佔有率。然而,其固有的亮度衰減和峰值亮度限制了其長期耐用性。主要顯示器廠商展示的microLED原型產品具有更高的對比度、更低的運動模糊和更高的能效,並有望在不犧牲外形規格下延長使用壽命。然而,目前的大規模轉移工藝良率較低,導致成本上升,因此microLED的生產仍主要處於試點階段。主要智慧型手機組裝和顯示器製造廠的投資公告表明,該技術預計將在2027年至2029年間實現商業性化,之後該領域的現有企業將加速向長壽命面板轉型。
波導合路器仍是瓶頸所在,主要供應商難以滿足奈米級精度要求,導致良率低於60%。雖然玻璃波導在高階系統中佔據主導地位,但聚合物波導具有更佳的色彩均勻性,並可能成為消費級眼鏡產品的經濟選擇。矽基液晶顯示器(LCOS)在國防應用上仍佔有一席之地,這些應用需要在低光源條件下實現超高解析度。向MicroLED的過渡最終取決於顯示器背板、傳輸裝置和波導材料的協同進步。然而,一旦這些挑戰得到克服,由此帶來的性能提升有望推動AR市場進入新的產品週期,重點發展更輕、適合全天佩戴的設備。
區域分析
預計到2025年,北美將佔據擴增實境(AR)市場收入的44.42%,這主要得益於大都會圈5G網路的高普及率、現有平台公司的集中佈局,以及強大的創業投資生態系統——該系統在2024年至2025年間為新創公司提供了超過20億美元的資金。儘管航太、物流和國防領域的企業應用持續成長,但隨著早期用戶從初始部署階段過渡到最佳化階段,頭戴式裝置的擴增實境有所放緩。加拿大的多倫多科技叢集因其在醫療相關應用方面的潛力而備受關注,而墨西哥的汽車產業叢集則擴大將AR用於組裝培訓和品質檢測。
在擴增實境(AR)市場,亞太地區預計將成為成長最快的地區,到2031年複合年成長率(CAGR)將達到25.94%。中國的產業政策目標是到2030年實現1億台AR設備,並結合資料本地化法規,鼓勵國內OEM廠商將人工智慧推理功能整合到設備中。印度的消費者高度依賴智慧型手機上的AR技術,數億用戶每月透過價格實惠的5G資料方案和本地語言內容庫篩選內容。在日本,機器人密集型製造業正在引入免手持視覺化技術,以彌補技術純熟勞工的短缺;而韓國則正在試驗將高清遊戲體驗疊加到密集的城市景觀上。在澳大利亞,AR技術正在偏遠地區的採礦作業和大規模建築工地進行試點。然而,與北美相比,監管差異和購買力差距限制了澳洲AR市場的絕對成長。
在歐洲,由於GDPR實施的嚴格生物識別資料法規,進展穩步推進。但同樣的框架也推動了企業採用擴增實境(AR)技術,從而避免依賴公共雲端並保護隱私。德國、英國和法國在汽車和航太領域的應用案例中處於領先地位,利用AR減少組裝錯誤並縮短訓練時間。義大利和西班牙正在旅遊和文化遺產展覽中利用這項技術來提升遊客參與。歐盟層級的人工智慧立法將強制要求透明揭露人工智慧產生的AR內容,這可能會增加合規成本,但也有助於建立消費者信任。在中東和非洲,先導計畫仍然專注於智慧城市計劃,例如NEOM,以及主要大都市地區的教育和零售領域的展示。在南美洲,電子商務視覺化工具的試點部署正在進行中,但宏觀經濟波動和進口關稅帶來了阻力。
其他好處:
- Excel格式的市場預測(ME)表
- 3個月的分析師支持
目錄
第1章:引言
- 研究假設和市場定義
- 調查範圍
第2章:調查方法
第3章執行摘要
第4章 市場狀況
- 市場概覽
- 市場促進因素
- 利用5G技術的低延遲行動網路
- 智慧型手機普及率不斷提高以及擴增實境(AR)應用的發展
- 提高企業培訓和現場服務的效率
- 用於快速創建 AR 內容的生成式 AI 工具
- 用於即時物聯網資料的工業數位孿生疊加
- Apple Vision Pro 推動了空間運算生態系統的發展。
- 市場限制因素
- 頭戴式顯示器的電池續航力和人體工學設計
- 隱私和資料安全問題
- 光波導玻璃的供應瓶頸
- 開發者規範不一致與跨平台問題
- 產業價值鏈分析
- 監理情勢
- 技術展望
- 雲端運算
- 人工智慧
- 網路安全
- 數位服務
- 波特五力分析
- 宏觀經濟因素對市場的影響
第5章 市場規模與成長預測
- 報價
- 硬體
- 獨立式頭戴式顯示器
- 有線頭戴式顯示器
- 無螢幕檢視器
- 軟體
- 硬體
- 核心技術
- OLED/MicroOLED
- MicroLED
- 波導管與衍射光學元件
- 矽基液晶顯示器(LCOS)
- 透過使用
- 遠端援助與維護
- 產品視覺化和配置
- 導航與地圖繪製
- 社交溝通過濾器
- 其他用途
- 按最終用戶行業分類
- 遊戲與娛樂
- 教育
- 衛生保健
- 零售
- 汽車和運輸業
- 其他終端用戶產業
- 按地區
- 北美洲
- 美國
- 加拿大
- 墨西哥
- 歐洲
- 德國
- 英國
- 法國
- 義大利
- 西班牙
- 其他歐洲國家
- 亞太地區
- 中國
- 日本
- 印度
- 韓國
- 澳洲
- 其他亞太國家
- 南美洲
- 巴西
- 阿根廷
- 其他南美國家
- 中東
- 沙烏地阿拉伯
- 阿拉伯聯合大公國
- 土耳其
- 其他中東國家
- 非洲
- 南非
- 埃及
- 奈及利亞
- 其他非洲國家
- 北美洲
第6章 競爭情勢
- 市場集中度
- 策略趨勢
- 市佔率分析
- 公司簡介
- Microsoft Corporation
- Google LLC(Alphabet Inc.)
- Meta Platforms Inc.
- Apple Inc.
- Snap Inc.
- Niantic Inc.
- PTC Inc.
- Vuzix Corporation
- Magic Leap Inc.
- Seiko Epson Corporation
- RealWear Inc.
- Lenovo Group Ltd.
- Fujitsu Ltd.
- Kopin Corporation
- Qualcomm Technologies Inc.
- Unity Technologies
- Optinvent SA
- Samsung Electronics Co. Ltd.
- Sony Corporation
第7章 市場機會與未來展望
According to Mordor Intelligence, the augmented reality market size is projected to expand from USD 99.81 billion in 2025 and USD 125.11 billion in 2026 to USD 387.23 billion by 2031, registering a CAGR of 25.35% between 2026 to 2031.Continued 5G roll-outs, maturing cloud-edge architectures, and a growing pipeline of enterprise proofs of concept moving into scaled production are sustaining double-digit growth.
This report is Segmented by Offering (Hardware, and Software), Core Technology (OLED/Micro-OLED, Microled, Waveguide and Diffractive Optics, and More), Application (Remote Assistance and Maintenance, Product Visualization, and More), End-User Vertical (Gaming and Entertainment, Education, Automotive and Transportation, and More), and Geography. The Market Forecasts are Provided in Terms of Value (USD).
Global Augmented Reality Market Trends and Insights
5G-Enabled Low-Latency Mobile Networks
Standalone 5G cores are now delivering round-trip latency under 10 milliseconds, enabling cloud-rendered overlays that move compute off constrained headsets to edge servers. Chipset makers have embedded dedicated AI engines alongside 5G modems, meaning real-time object recognition can continue even when connectivity drops. 3GPP Release 18 adds XR-specific quality-of-service classes that network operators are trialing to guarantee frame-rate stability during peak congestion. Urban coverage remains uneven, yet factories, ports, and warehouses are bypassing the public grid with private 5G networks, ensuring deterministic performance for industrial digital twins. As coverage gaps close, outdoor AR navigation, tourism overlays, and large-venue entertainment are expected to see a usage inflection in the augmented reality market.
Enterprise Training and Field-Service Efficiency Gains
Enterprises deploying head-mounted displays have documented return-on-investment profiles that shorten payback periods to fewer than 24 months. Independent studies show remote-expert guidance can cut technician travel by 40%, while immersive workflows reduce assembly defects by double-digit percentages. Aerospace, automotive, and heavy-equipment manufacturers report 20%-30% shorter production cycles once AR work instructions replace paper manuals. Beyond the factory floor, frontline service organizations using hands-free overlays note technician reversion rates below 5%, indicating sticky behavioral change. As macro uncertainty pushes cost-optimization agendas, the documented savings from AR deployments are expected to accelerate procurement decisions in the augmented reality market.
Battery-Life and Ergonomics of Head-Mounted Displays
Most commercial headsets offer under 2.5 hours of continuous operation, well below the four-hour threshold required for all-day workflows. Device masses still hover around 500-600 grams, generating neck fatigue within an hour for many users, which curtails session length in gaming and prolonged industrial scenarios. Brighter, higher-resolution optics boost immersion but drain batteries faster, while adding battery capacity exacerbates weight. Solid-state prototypes promise 50% energy-density gains but are unlikely to ship in volume before 2028. Until then, for the augmented reality market, ergonomic limits will restrain consumer uptake and compel enterprises to limit headset usage to discrete tasks rather than entire shifts.
Other drivers and restraints analyzed in the detailed report include:
- Generative-AI Tools for Rapid AR Content Creation
- Apple Vision Pro-Led Spatial-Computing Ecosystem Push
- Privacy and Data-Security Concerns
For complete list of drivers and restraints, kindly check the Table Of Contents.
Segment Analysis
The software tier generated the fastest revenue expansion in 2025, tracking a 28.76% CAGR projection through 2031 as subscriptions, in-app purchases, and cloud-rendering services outstrip one-off headset margins. Within hardware, standalone and tethered head-mounted displays plus screenless mobile viewers maintained 64.66% of 2025 spending, yet gross margins narrowed when value-tier devices such as Meta Quest were sold near cost to enlarge the installed base. Unity's development framework underpins roughly two-thirds of mobile and headset AR releases, anchoring recurring license spreads as the cohort of professional creators mushrooms. Unreal Engine continues to gain traction in photorealistic visualization, while enterprise buyers gravitate to low-code toolkits that integrate with existing asset-management systems. The software opportunity scales with every incremental user, positioning platform operators to capture expanding lifetime value even as bill-of-materials costs decline. Meanwhile, hardware roadmaps focus on lighter form factors and energy-efficient chipsets, but commoditization is inevitable, steering profit pools decisively toward software and services in the augmented reality market.
Asset pipelines that once demanded specialized designers can now auto-generate textures, lighting, and animations on demand. This shift tilts total cost of ownership toward usage-based pricing. As regulatory and insurance frameworks solidify, sectors such as healthcare and defense are expected to commit to multi-year platform subscriptions, reinforcing the virtuous flywheel for software vendors. Consequently, hardware OEMs are already experimenting with revenue-sharing models tied to app-store take rates, underscoring the gradual inversion of value from physical units to digital channels in the AR market.
OLED and Micro-OLED displays combined for 48.25% revenue share of the augmented reality market in 2025 owing to mature supply chains and competitive pricing, yet inherent luminance decay and limited peak brightness constrain multiyear durability. MicroLED prototypes showcased by leading display vendors deliver superior contrast, reduced motion blur, and energy efficiency that could elongate session lengths without sacrificing form factor. Current mass-transfer processes, however, report yield losses that inflate costs, keeping MicroLED production largely in the pilot phase. Investment announcements by top smartphone assemblers and display fabs indicate the technology will cross commercial viability between 2027 and 2029, after which category incumbents will accelerate a migration to longer-life panels.
Waveguide combiners remain another chokepoint, with leading suppliers experiencing sub-60% yields due to nanoscale tolerance demands. Glass-based waveguides dominate high-end systems, while polymer variants are progressing in color uniformity and may unlock cost-effective alternatives for consumer eyewear. Liquid-Crystal-on-Silicon retains niche relevance in defense applications requiring ultra-high resolution under low-light conditions. The transition toward MicroLED ultimately depends on coordinated advances in display backplanes, transfer equipment, and waveguide materials. Nonetheless, once solved, the resulting performance uplift is expected to catalyze a new product cycle favoring lighter, all-day wearable formats in the AR market.
Complete Report Scope:
- By Offering
- Hardware
- Stand-Alone HMDs
- Tethered HMDs
- Screenless Viewers
- Software
- Hardware
- By Core Technology
- OLED / Micro-OLED
- MicroLED
- Waveguide and Diffractive Optics
- Liquid-Crystal-on-Silicon (LCOS)
- By Application
- Remote Assistance and Maintenance
- Product Visualisation and Configuration
- Navigation and Mapping
- Social and Communication Filters
- Other Applications
- By End-User Vertical
- Gaming and Entertainment
- Education
- Healthcare
- Retail
- Automotive and Transportation
- Other End-User Verticals
- By Geography
- North America
- United States
- Canada
- Mexico
- Europe
- Germany
- United Kingdom
- France
- Italy
- Spain
- Rest of Europe
- Asia Pacific
- China
- Japan
- India
- South Korea
- Australia
- Rest of Asia Pacific
- South America
- Brazil
- Argentina
- Rest of South America
- Middle East
- Saudi Arabia
- United Arab Emirates
- Turkey
- Rest of Middle East
- Africa
- South Africa
- Egypt
- Nigeria
- Rest of Africa
- North America
Geography Analysis
North America generated 44.42% of 2025 revenues in the augmented reality market, underpinned by high 5G penetration across metro areas, a concentration of platform incumbents, and deep venture-capital ecosystems that bankrolled over USD 2 billion in start-ups across 2024-2025. Enterprise deployments at aerospace, logistics, and defense organizations continue to scale, though year-on-year headset unit growth has moderated as early adopters shift from initial roll-outs to optimization phases. Canada's Toronto tech cluster is gaining visibility in healthcare-related applications, whereas Mexico's automotive corridor is embracing AR for assembly training and quality inspection.
Asia Pacific is projected to post the fastest regional expansion at 25.94% CAGR through 2031 in the AR market. China's industrial policy targets 100 million AR-capable devices by 2030, pairing data-localization rules with incentives for domestic OEMs to incorporate on-device AI inference. India's consumer engagement leans heavily on smartphone-based AR, counting hundreds of millions of monthly filter users thanks to affordable 5G data plans and vernacular content libraries. Japan's robotics-intensive manufacturing sector is integrating hands-free visualization to offset skilled-labor shortages, while South Korea serves as a proving ground for high-fidelity gaming experiences layered onto dense urban landscapes. Australia is piloting AR across remote mining operations and large-scale construction. Regulatory fragmentation and uneven purchasing power nonetheless temper absolute dollar growth relative to North America.
Europe's progress is methodical due to GDPR's stringent biometric-data rules, yet the same framework is catalyzing privacy-preserving enterprise deployments that avoid public-cloud dependencies. Germany, the United Kingdom, and France lead in automotive and aerospace use cases, deploying AR to cut assembly errors and shorten training windows. Italy and Spain harness the technology in tourism and cultural-heritage installations, elevating visitor engagement. EU-level AI legislation will require transparent disclosure of AI-generated AR content, which could raise compliance costs but also build baseline consumer trust. In the Middle East and Africa, pilots remain concentrated in smart-city initiatives such as NEOM and in education and retail showcases within major urban centers. South America is experimenting with e-commerce visualization tools, although macroeconomic variability and import tariffs introduce headwinds.
- Microsoft Corporation
- Google LLC (Alphabet Inc.)
- Meta Platforms Inc.
- Apple Inc.
- Snap Inc.
- Niantic Inc.
- PTC Inc.
- Vuzix Corporation
- Magic Leap Inc.
- Seiko Epson Corporation
- RealWear Inc.
- Lenovo Group Ltd.
- Fujitsu Ltd.
- Kopin Corporation
- Qualcomm Technologies Inc.
- Unity Technologies
- Optinvent SA
- Samsung Electronics Co. Ltd.
- Sony Corporation
Additional Benefits:
- The market estimate (ME) sheet in Excel format
- 3 months of analyst support
TABLE OF CONTENTS
1 INTRODUCTION
- 1.1 Study Assumptions and Market Definition
- 1.2 Scope of the Study
2 RESEARCH METHODOLOGY
3 EXECUTIVE SUMMARY
4 MARKET LANDSCAPE
- 4.1 Market Overview
- 4.2 Market Drivers
- 4.2.1 5G-Enabled Low-Latency Mobile Networks
- 4.2.2 Rising Smartphone Penetration and AR-Ready Apps
- 4.2.3 Enterprise Training and Field-Service Efficiency Gains
- 4.2.4 Generative-AI Tools for Rapid AR Content Creation
- 4.2.5 Industrial Digital-Twin Overlays for Real-Time IoT Data
- 4.2.6 Apple Vision Pro-Led Spatial-Computing Ecosystem Push
- 4.3 Market Restraints
- 4.3.1 Battery-Life and Ergonomics of Head-Mounted Displays
- 4.3.2 Privacy and Data-Security Concerns
- 4.3.3 Optical-Waveguide Glass Supply Bottlenecks
- 4.3.4 Fragmented Developer Standards and Cross-Platform Issues
- 4.4 Industry Value Chain Analysis
- 4.5 Regulatory Landscape
- 4.6 Technological Outlook
- 4.6.1 Cloud Computing
- 4.6.2 Artificial Intelligence
- 4.6.3 Cyber Security
- 4.6.4 Digital Services
- 4.7 Porter's Five Forces Analysis
- 4.7.1 Bargaining Power of Suppliers
- 4.7.2 Bargaining Power of Buyers
- 4.7.3 Threat of New Entrants
- 4.7.4 Threat of Substitutes
- 4.7.5 Intensity of Competitive Rivalry
- 4.8 Impact of Macroeconomic Factors on the Market
5 MARKET SIZE AND GROWTH FORECASTS (VALUE)
- 5.1 By Offering
- 5.1.1 Hardware
- 5.1.1.1 Stand-Alone HMDs
- 5.1.1.2 Tethered HMDs
- 5.1.1.3 Screenless Viewers
- 5.1.2 Software
- 5.1.1 Hardware
- 5.2 By Core Technology
- 5.2.1 OLED / Micro-OLED
- 5.2.2 MicroLED
- 5.2.3 Waveguide and Diffractive Optics
- 5.2.4 Liquid-Crystal-on-Silicon (LCOS)
- 5.3 By Application
- 5.3.1 Remote Assistance and Maintenance
- 5.3.2 Product Visualisation and Configuration
- 5.3.3 Navigation and Mapping
- 5.3.4 Social and Communication Filters
- 5.3.5 Other Applications
- 5.4 By End-User Vertical
- 5.4.1 Gaming and Entertainment
- 5.4.2 Education
- 5.4.3 Healthcare
- 5.4.4 Retail
- 5.4.5 Automotive and Transportation
- 5.4.6 Other End-User Verticals
- 5.5 By Geography
- 5.5.1 North America
- 5.5.1.1 United States
- 5.5.1.2 Canada
- 5.5.1.3 Mexico
- 5.5.2 Europe
- 5.5.2.1 Germany
- 5.5.2.2 United Kingdom
- 5.5.2.3 France
- 5.5.2.4 Italy
- 5.5.2.5 Spain
- 5.5.2.6 Rest of Europe
- 5.5.3 Asia Pacific
- 5.5.3.1 China
- 5.5.3.2 Japan
- 5.5.3.3 India
- 5.5.3.4 South Korea
- 5.5.3.5 Australia
- 5.5.3.6 Rest of Asia Pacific
- 5.5.4 South America
- 5.5.4.1 Brazil
- 5.5.4.2 Argentina
- 5.5.4.3 Rest of South America
- 5.5.5 Middle East
- 5.5.5.1 Saudi Arabia
- 5.5.5.2 United Arab Emirates
- 5.5.5.3 Turkey
- 5.5.5.4 Rest of Middle East
- 5.5.6 Africa
- 5.5.6.1 South Africa
- 5.5.6.2 Egypt
- 5.5.6.3 Nigeria
- 5.5.6.4 Rest of Africa
- 5.5.1 North America
6 COMPETITIVE LANDSCAPE
- 6.1 Market Concentration
- 6.2 Strategic Moves
- 6.3 Market Share Analysis
- 6.4 Company Profiles (includes Global Level Overview, Market Level Overview, Core Segments, Financials as Available, Strategic Information, Market Rank/Share for Key Companies, Products and Services, and Recent Developments)
- 6.4.1 Microsoft Corporation
- 6.4.2 Google LLC (Alphabet Inc.)
- 6.4.3 Meta Platforms Inc.
- 6.4.4 Apple Inc.
- 6.4.5 Snap Inc.
- 6.4.6 Niantic Inc.
- 6.4.7 PTC Inc.
- 6.4.8 Vuzix Corporation
- 6.4.9 Magic Leap Inc.
- 6.4.10 Seiko Epson Corporation
- 6.4.11 RealWear Inc.
- 6.4.12 Lenovo Group Ltd.
- 6.4.13 Fujitsu Ltd.
- 6.4.14 Kopin Corporation
- 6.4.15 Qualcomm Technologies Inc.
- 6.4.16 Unity Technologies
- 6.4.17 Optinvent SA
- 6.4.18 Samsung Electronics Co. Ltd.
- 6.4.19 Sony Corporation
7 MARKET OPPORTUNITIES AND FUTURE OUTLOOK
- 7.1 White-Space and Unmet-Need Assessment

 2026-2030年全球零售業擴增實境市場
 全球空間計算市場規模、佔有率、趨勢和成長分析報告(2026-2034)全球擴增實境(AR)市場規模、佔有率、趨勢和成長分析報告,2026-2034年
 企業級擴增實境:市場佔有率分析、產業趨勢與統計及成長預測(2026-2031 年)擴增實境(AR)包裝全球市場規模、佔有率、趨勢和成長分析報告(2026-2034)
 供應鏈市場中的擴增實境(AR)-2026-2032年全球市場預測AR內容串流:市場佔有率分析、產業趨勢與統計及成長預測(2026-2031年)擴增實境(AR)市場-2026-2032年全球市場預測數位學習中的擴增實境(AR)市場-2026年至2032年全球市場預測
 全球空間運算市場:機會與策略展望(至2035年)