


 |
市場調查報告書
商品編碼
2124943
亞太地區倉儲自動化:市場佔有率分析、產業趨勢與統計及成長預測(2026-2031)Asia-Pacific Warehouse Automation - Market Share Analysis, Industry Trends & Statistics, Growth Forecasts (2026 - 2031) |
||||||

※ 本網頁內容可能與最新版本有所差異。詳細情況請與我們聯繫。
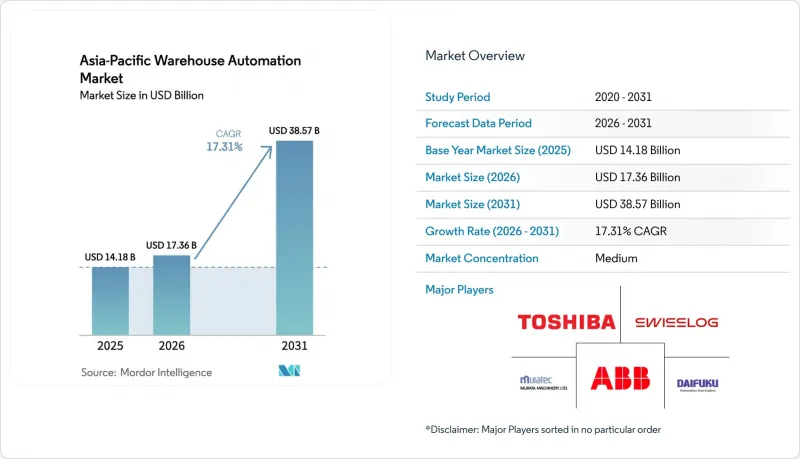
根據 Mordor Intelligence 預測,亞太地區倉庫自動化市場預計將從 2025 年的 141.8 億美元成長到 2026 年的 173.6 億美元,到 2031 年達到 385.7 億美元,2026 年至 2031 年的複合年成長率預計為 17.31%。
本報告按「組件」(硬體、軟體(倉庫管理系統 (WMS)、倉庫執行系統 (WES))、服務(附加價值服務、維護))、「最終用戶」(食品飲料、郵政小包裹服務、雜貨、一般商品、服裝、製造業及其他最終用戶)和「國家/地區」對行業進行分類。市場預測以美元 (USD) 為單位。
亞太地區倉儲自動化市場趨勢與洞察
電子商務行業的快速成長以及人們對當日送達的期望
預計到2024年,東南亞電子商務商品總值將達到1,390億美元,年增15%,這給雅加達和馬尼拉的物流配送帶來了巨大前置作業時間。 2024年中國的「雙十一」購物節期間,各大電商平台在72小時內處理了29億個小包裹,迫使物流業者部署每小時可處理3萬個包裹的分類機器人。在印度,58%的網購消費者希望在2024年享受電子產品和服飾訂單的當日送達服務,高於兩年前的41%。這使得倉庫在揀貨和包裝環節的自動化需求變得迫切。亞馬遜印度公司報告稱,引入「貨到人」機器人後,訂單到出貨的時間縮短了40%,在15個大都會圈實現了兩小時以內的配送服務。都市區需求的激增正在推動資本流入位於客戶 5 公里半徑範圍內的微型倉配中心,自動化正在抵消都市區房地產價格飆升的影響。
政府透過「工業4.0」計畫支持智慧製造
日本累計2,000億日圓(約18億美元)用於補貼協作機器人和倉庫執行系統,目標是在2027年前實現50%的物流自動化。中國的「十四五」規劃要求到2025年實現70%的冷鏈倉庫機械化,加快採用穿梭車和自動化立體倉庫系統(AS/RS),以減少食物廢棄物和單筆訂單的能源消耗。韓國於2024年推出了5億美元的智慧物流創新基金,為中小企業移動機器人的資本支出提供高達40%的補助。印度於2024年宣布的「生產連結獎勵計畫計畫」將為在2028年前實施自動化的倉庫提供相當於新增收入6%的稅額扣抵。這些財政支持措施將典型的投資回收期從五年縮短到不到三年,使以前中型第三方物流供應商難以負擔的專案變得可行。
大筆資本投入和較長的投資回收期
在10萬平方英尺的倉庫中實施自動化倉儲系統通常需要花費800萬至1500萬美元,投資回收期為3至5年,具體取決於薪資差距。每台自主機器人的成本在2萬至10萬美元之間,部署50台機器人將導致初始成本超過100萬美元,外加相當於硬體成本約20%的年度軟體使用費。預計到2024年,印度的商業貸款利率平均將達到9.5%,這將增加加權平均資本成本,並延後低利潤率企業的損益平衡點。機器人即服務(RaaS)合約的價格為每台機器人每月2000至4000美元,降低了准入門檻,但五年內的總成本將增加20%至30%。儘管越南和印尼的線上零售業發展強勁,但這些資金籌措使得兩國的自動化普及率仍低於12%。
細分市場分析
業務收益正以17.93%的複合年成長率成長,略高於硬體的17.31%。這是因為營運商開始意識到,專案成功取決於現有ERP、WMS和OT層的順利整合。即使到了2025年,硬體仍將佔據亞太地區倉庫自動化市場67.13%的佔有率,這主要是因為移動機器人、穿梭車系統和輸送機仍然是提高處理能力的基礎。光是移動機器人就佔組件銷售額的28%,這得益於處理時間縮短了35%,例如Yamato Logistics部署了1000台Geek+設備。軟體佔據18%的市場佔有率,隨著即時控制和預測性維護技術的成熟,其成長速度正在加快。 Blue Yonder和Manhattan Associates的WMS許可證銷售量激增40%就證明了這一點。
2024 年的一項調查顯示,68% 的受訪企業認為 IT 和 OT 的整合是他們面臨的最大挑戰,系統整合商預計將從中受益最多。顧問公司目前正透過將流程重組、安全認證和員工技能發展納入多年期合約來提高服務利潤率。硬體供應商正透過提供端到端解決方案來應對這一趨勢,但許多中型第三方物流公司更傾向於選擇能夠整合其混合設備組合的中立顧問。隨著倉庫複雜性的增加和亞太地區倉庫自動化市場的擴張,對注重網路安全的整合方案的需求正在超過對小型機械升級的追求。
受嚴格的溫度控制要求和一小時送達時限普及的推動,雜貨店正加快對機械化冷藏倉庫的投資,其複合年成長率高達18.77%。到2025年,亞太地區倉儲自動化市場中,食品飲料產業將維持23.44%的最大佔有率,這主要得益於飲料批發商利用碼垛機器人簡化重複的箱體處理流程。在中國,政府已規定到2025年冷鏈設施的機械化率要達到70%,順豐速運等物流公司正在推進多區域自動化儲存和檢索系統(AS/RS)的部署,這些系統能夠處理-25 度C至+15 度C的溫度範圍。
預計到2025年,郵政和小包裹業務將佔銷售額的19%,這主要得益於樞紐中心每小時處理超過18,000個小包裹的高速分類機。服裝和一般商品業務將佔22%,但SKU的多樣性阻礙了自動化進程,並使機器人搬運作業變得複雜。製造業將佔16%,汽車和電子工廠正在使用AGV(自動導引車)來提高安全性和空間利用率。在製藥、化學和其他細分領域,可追溯性標準正在擴展,以促進自動化資料收集。總體而言,對食品雜貨(尤其是冷凍和生鮮食品)日益成長的需求正在推動亞太地區倉儲自動化市場擺脫對傳統小包裹承運商的依賴。
其他好處
- Excel格式的市場預測(ME)表
- 3個月的分析師支持
目錄
第1章:引言
- 研究假設和市場定義
- 調查範圍
第2章:調查方法
第3章執行摘要
第4章 市場狀況
- 市場概覽
- 市場促進因素
- 電子商務行業的快速成長以及人們對當日送達的期望
- 政府透過「工業4.0」計畫支持智慧製造
- 亞太地區已開發國家勞動力老化導致人事費用上升。
- 城市地區對暗店和微型倉配的接受度正在迅速提高。
- 部署 5G 專用網路,實現超低延遲倉庫管理。
- 由於強制性脫碳政策,自動化正在不斷進步,以降低每筆訂單的能源消耗。
- 市場限制因素
- 大筆資本投入和較長的投資回收期
- 確保新興經濟體的低成本勞動力
- 整合傳統IT系統與OT系統的複雜性
- 聯網機器人的網路安全漏洞
- 產業價值鏈分析
- 監理情勢
- 技術展望
- 宏觀經濟因素對倉儲自動化市場的影響
- 新冠疫情對市場的影響
- 倉庫投資方案
- 波特五力分析
第5章 市場規模與成長預測
- 按組件
- 硬體
- 移動機器人(AGV、AMR)
- 自動化倉庫系統(AS/RS)
- 自動化運輸和分類系統
- 卸垛碼垛系統
- 自動識別資料收集(AIDC)
- 揀貨機器人
- 軟體
- 倉庫管理系統(WMS)
- 倉庫營運管理系統(WES)
- 服務
- 硬體
- 最終用戶
- 飲食
- 郵件和小包裹
- 雜貨
- 一般產品
- 服飾
- 製造業(耐久性消費品/非耐久性消費品)
- 其他
- 按功能分類的倉庫
- 物流中心
- 履約中心
- 退貨中心
- 冷藏設施
- 微型倉配中心
- 暗店
- 倉庫規模
- 小規模(小於50,000平方英尺)
- 中型(50,000 至 250,000 平方英尺)
- 大型(超過25萬平方英尺)
- 國家
- 中國
- 印度
- 日本
- 韓國
- 澳洲
- 亞太其他地區
第6章 競爭情勢
- 市場集中度
- 策略趨勢
- 市佔率分析
- 公司簡介
- Daifuku Co., Ltd.
- Murata Machinery, Ltd.
- Geek+Inc.
- GreyOrange Pte. Ltd.
- SSI Schaefer Group
- Swisslog Holding AG
- Toyota Material Handling
- HAI Robotics
- ABB Ltd.
- Yaskawa Electric Corporation
- Godrej Consoveyo Logistics Automation Ltd.
- Bastian Solutions
- ST Engineering
- Toshiba Global Commerce Solutions
- Vanderlande Industries
- Honeywell Intelligrated
- Knapp AG
- Locus Robotics Corp.
- Kion Group
第7章 市場機會與未來展望
According to Mordor Intelligence, the Asia-Pacific warehouse automation market size is expected to increase from USD 14.18 billion in 2025 to USD 17.36 billion in 2026 and reach USD 38.57 billion by 2031, growing at a CAGR of 17.31% over 2026-2031.
This report Segments the Industry Into Component (Hardware, Software (Warehouse Management Systems (WMS), Warehouse Execution Systems (WES)), Services (Value Added Services, Maintenance)), End-User (Food and Beverage, Post and Parcel, Groceries, General Merchandise, Apparel, Manufacturing, Other End-User Industries), and Country. The Market Forecasts are Provided in Terms of Value (USD).
Asia-Pacific Warehouse Automation Market Trends and Insights
Exponential Growth of the E-commerce Industry and Same-Day Delivery Expectations
Southeast Asia's e-commerce gross merchandise value reached USD 139 billion in 2024, a 15% year-on-year jump that tightened delivery windows across Jakarta and Manila. During China's Singles' Day 2024, platforms processed 2.9 billion parcels in 72 hours, forcing logistics providers to adopt sortation robots capable of handling 30,000 packages per hour. In India, 58% of online shoppers expected same-day service for electronics and apparel orders in 2024, up from 41% two years earlier, putting pressure on warehouses to automate pick-and-pack flows. Amazon India reported that goods-to-person robotics trimmed order-to-dispatch time by 40%, enabling two-hour delivery in 15 metropolitan areas. The surge in urban demand is pushing capital toward micro-fulfillment hubs within 5 kilometers of customers, where automation offsets urban real estate premiums.
Government Incentives for Smart Manufacturing Under Industry 4.0 Programs
Japan earmarked JPY 200 billion (USD 1.8 billion) in fiscal 2024 to subsidize collaborative robots and warehouse execution systems, aiming for 50% logistics automation by 2027. China's 14th Five-Year Plan mandates 70% mechanization in cold-chain warehouses by 2025, accelerating the deployment of shuttles and AS/RS systems that reduce food waste and energy per order. South Korea launched a USD 500 million Smart Logistics Innovation Fund in 2024, covering up to 40% of capital outlays for mobile robots for small and medium operators. India's Production-Linked Incentive scheme, announced in 2024, provides tax credits equal to 6% of incremental revenue for warehouses installing automation through 2028. These fiscal levers shorten typical payback periods from five years to under three, unlocking projects that mid-tier 3PLs once deemed unaffordable.
High Capital Expenditure and Long Payback Periods
Installing an automated storage and retrieval system for a 100,000 ft2 warehouse typically costs USD 8-15 million, with payback stretching three to five years depending on wage differentials. Autonomous mobile robots price between USD 20,000 and USD 100,000 each, and fleets of 50 units push upfront spend beyond USD 1 million, plus annual software fees near 20% of the hardware cost. Commercial loan rates in India averaged 9.5% in 2024, thereby inflating the weighted-average cost of capital and extending breakeven timelines for thin-margin operators. Robotics-as-a-service contracts at USD 2,000-4,000 per robot per month lower barriers but raise the total five-year cost 20-30%. These financing hurdles leave automation penetration below 12% in Vietnam and Indonesia, despite robust online retail growth.
Other drivers and restraints analyzed in the detailed report include:
- Rising Labor Costs Amid Aging Workforce in Developed Asia-Pacific Economies
- Surge in Dark Stores and Micro-Fulfillment Adoption in Urban Centers
- Availability of Low-Cost Labor in Emerging Economies
For complete list of drivers and restraints, kindly check the Table Of Contents.
Segment Analysis
Services revenue is growing at a 17.93% CAGR, slightly outpacing hardware's 17.31% trajectory, as operators discover that successful projects hinge on the smooth integration of legacy ERP, WMS, and OT layers. In 2025, hardware still delivered 67.13% of the Asia-Pacific warehouse automation market, largely because mobile robots, shuttle systems, and conveyors remain the backbone of throughput gains. Mobile fleets alone accounted for 28% of component turnover, buoyed by deployments such as 1,000 Geek+ units at Yamato Logistics, which trimmed processing time by 35%. Software captured 18% market share and is accelerating as real-time control and predictive maintenance mature, evidenced by a 40% jump in Blue Yonder and Manhattan Associates WMS licenses.
System integrators stand to benefit most, as 68% of operators surveyed in 2024 cited IT-OT convergence as their top hurdle. Consulting lines now bundle process redesign, safety certification, and workforce upskilling into multi-year contracts, swelling service margins. Hardware vendors respond by offering end-to-end packages, yet many mid-sized 3PLs prefer neutral advisers who can orchestrate mixed fleets. As warehouse complexity rises and the Asia-Pacific warehouse automation market expands, demand for cyber-secure integration eclipses the allure of marginal mechanical upgrades.
Grocery stores register the fastest 18.77% CAGR as strict temperature compliance and one-hour delivery windows intensify capital allocation toward mechanized cold storage. Food and beverage retained the largest 23.44% share of the Asia-Pacific warehouse automation market in 2025, underpinned by beverage distributors that streamline repetitive case handling with palletizing robots. State mandates in China require 70% mechanization of cold-chain sites by 2025, prompting carriers like SF Express to adopt multi-zone AS/RS systems with temperature ranges from -25 °C to +15 °C.
Post and parcel accounted for 19% of 2025 revenue, driven by high-speed sorters at hubs processing over 18,000 parcels per hour. Apparel and general merchandise accounted for 22%, but slower automation due to SKU variability complicates robotic grasping. Manufacturing accounted for 16%, with auto and electronics plants using AGVs to improve safety and increase space utilization. Pharmaceuticals, chemicals, and other niches expand on traceability standards that reward automated data capture. Overall, grocery momentum, especially for frozen and fresh produce, is driving the Asia-Pacific warehouse automation market beyond its historical reliance on parcel carriers.
Complete Report Scope:
- By Component
- Hardware
- Mobile Robots (AGV, AMR)
- Automated Storage and Retrieval Systems (AS/RS)
- Automated Conveyor and Sorting Systems
- De-palletizing/Palletizing Systems
- Automatic Identification and Data Collection (AIDC)
- Piece Picking Robots
- Software
- Warehouse Management Systems (WMS)
- Warehouse Execution Systems (WES)
- Services
- Hardware
- By End-User
- Food and Beverage
- Post and Parcel
- Groceries
- General Merchandise
- Apparel
- Manufacturing (Durable and Non-Durable)
- Other End-User
- By Warehouse Function
- Distribution Centers
- Fulfillment Centers
- Return Centers
- Cold Storage Facilities
- Micro-Fulfillment Centers
- Dark Stores
- By Warehouse Size
- Small (Below 50 000 sq ft)
- Medium (50 000 - 250 000 sq ft)
- Large (Above 250 000 sq ft)
- By Country
- China
- India
- Japan
- South Korea
- Australia
- Rest of Asia Pacific
List of Companies Covered in this Report:
- Daifuku Co., Ltd.
- Murata Machinery, Ltd.
- Geek+ Inc.
- GreyOrange Pte. Ltd.
- SSI Schaefer Group
- Swisslog Holding AG
- Toyota Material Handling
- HAI Robotics
- ABB Ltd.
- Yaskawa Electric Corporation
- Godrej Consoveyo Logistics Automation Ltd.
- Bastian Solutions
- ST Engineering
- Toshiba Global Commerce Solutions
- Vanderlande Industries
- Honeywell Intelligrated
- Knapp AG
- Locus Robotics Corp.
- Kion Group
Additional Benefits:
- The market estimate (ME) sheet in Excel format
- 3 months of analyst support
TABLE OF CONTENTS
1 INTRODUCTION
- 1.1 Study Assumptions and Market Definition
- 1.2 Scope of the Study
2 RESEARCH METHODOLOGY
3 EXECUTIVE SUMMARY
4 MARKET LANDSCAPE
- 4.1 Market Overview
- 4.2 Market Drivers
- 4.2.1 Exponential Growth of the E-commerce Industry and Same-Day Delivery Expectations
- 4.2.2 Government Incentives for Smart Manufacturing Under Industry 4.0 Programs
- 4.2.3 Rising Labor Costs Amid Aging Workforce in Developed Asia Pacific Economies
- 4.2.4 Surge in Dark Store and Micro-Fulfillment Adoption in Urban Centers
- 4.2.5 Deployment of 5G Private Networks Enabling Ultra-Low-Latency Warehouse Control
- 4.2.6 Decarbonization Mandates Driving Automation to Reduce Energy per Order
- 4.3 Market Restraints
- 4.3.1 High Capital Expenditure and Long Payback Periods
- 4.3.2 Availability of Low-Cost Labor in Emerging Economies
- 4.3.3 Complexity of Integrating Legacy IT and OT Systems
- 4.3.4 Cybersecurity Vulnerabilities in Connected Robotic Fleets
- 4.4 Industry Value Chain Analysis
- 4.5 Regulatory Landscape
- 4.6 Technological Outlook
- 4.7 Impact of Macroeconomic Factors on the Warehouse Automation Market
- 4.8 Impact of COVID-19 on the Market
- 4.9 Warehouse Investment Scenario
- 4.10 Porter's Five Forces Analysis
- 4.10.1 Threat of New Entrants
- 4.10.2 Bargaining Power of Buyers
- 4.10.3 Bargaining Power of Suppliers
- 4.10.4 Threat of Substitutes
- 4.10.5 Intensity of Competitive Rivalry
5 MARKET SIZE AND GROWTH FORECASTS (VALUE)
- 5.1 By Component
- 5.1.1 Hardware
- 5.1.1.1 Mobile Robots (AGV, AMR)
- 5.1.1.2 Automated Storage and Retrieval Systems (AS/RS)
- 5.1.1.3 Automated Conveyor and Sorting Systems
- 5.1.1.4 De-palletizing/Palletizing Systems
- 5.1.1.5 Automatic Identification and Data Collection (AIDC)
- 5.1.1.6 Piece Picking Robots
- 5.1.2 Software
- 5.1.2.1 Warehouse Management Systems (WMS)
- 5.1.2.2 Warehouse Execution Systems (WES)
- 5.1.3 Services
- 5.1.1 Hardware
- 5.2 By End-User
- 5.2.1 Food and Beverage
- 5.2.2 Post and Parcel
- 5.2.3 Groceries
- 5.2.4 General Merchandise
- 5.2.5 Apparel
- 5.2.6 Manufacturing (Durable and Non-Durable)
- 5.2.7 Other End-User
- 5.3 By Warehouse Function
- 5.3.1 Distribution Centers
- 5.3.2 Fulfillment Centers
- 5.3.3 Return Centers
- 5.3.4 Cold Storage Facilities
- 5.3.5 Micro-Fulfillment Centers
- 5.3.6 Dark Stores
- 5.4 By Warehouse Size
- 5.4.1 Small (Below 50 000 sq ft)
- 5.4.2 Medium (50 000 - 250 000 sq ft)
- 5.4.3 Large (Above 250 000 sq ft)
- 5.5 By Country
- 5.5.1 China
- 5.5.2 India
- 5.5.3 Japan
- 5.5.4 South Korea
- 5.5.5 Australia
- 5.5.6 Rest of Asia Pacific
6 COMPETITIVE LANDSCAPE
- 6.1 Market Concentration
- 6.2 Strategic Moves
- 6.3 Market Share Analysis
- 6.4 Company Profiles (includes Global Level Overview, Market Level Overview, Core Segments, Financials as Available, Strategic Information, Market Rank/Share for Key Companies, Products and Services, and Recent Developments)
- 6.4.1 Daifuku Co., Ltd.
- 6.4.2 Murata Machinery, Ltd.
- 6.4.3 Geek+ Inc.
- 6.4.4 GreyOrange Pte. Ltd.
- 6.4.5 SSI Schaefer Group
- 6.4.6 Swisslog Holding AG
- 6.4.7 Toyota Material Handling
- 6.4.8 HAI Robotics
- 6.4.9 ABB Ltd.
- 6.4.10 Yaskawa Electric Corporation
- 6.4.11 Godrej Consoveyo Logistics Automation Ltd.
- 6.4.12 Bastian Solutions
- 6.4.13 ST Engineering
- 6.4.14 Toshiba Global Commerce Solutions
- 6.4.15 Vanderlande Industries
- 6.4.16 Honeywell Intelligrated
- 6.4.17 Knapp AG
- 6.4.18 Locus Robotics Corp.
- 6.4.19 Kion Group
7 MARKET OPPORTUNITIES AND FUTURE OUTLOOK
- 7.1 White-Space and Unmet-Need Assessment

 北美倉儲自動化:市場佔有率分析、產業趨勢與統計及成長預測(2026-2031 年)歐洲倉儲自動化:市場佔有率分析、產業趨勢與統計及成長預測(2026-2031 年)倉儲自動化:市場佔有率分析、產業趨勢與統計、成長預測(2026-2031)
 自主倉庫揀選智慧市場預測至2034年-全球產品、組件、技術、揀選方法、應用、最終使用者和區域分析
 自動化倉庫揀貨市場-2026-2032年全球市場預測倉儲自動化市場:按自動化類型、類別、組件、功能、應用和最終用戶分類-2026-2032年全球市場預測倉儲自動化分析市場:預測至 2034 年 - 按組件、分析類型、部署模式、應用、最終用戶和地區分類的全球分析倉儲自動化市場預測至2034年—按組件、功能、技術、應用、最終用戶和地區分類的全球分析
 倉儲自動化市場(物流自動化)-預計到 2032 年將達到 640 億美元:按技術(AGV/AMR、ASRS、輸送機、分類、揀貨、AIDC、碼垛、ATLS、WMS/WES/WCS)、產業和地區/國家分類(版本 6)印度倉儲自動化:市場佔有率分析、產業趨勢與統計及成長預測(2026-2031)