


 |
市場調查報告書
商品編碼
2124633
亞洲和非洲食品罐頭市場:市場佔有率分析、行業趨勢和統計數據以及成長預測(2026-2031 年)Asia And Africa Food Cans - Market Share Analysis, Industry Trends & Statistics, Growth Forecasts (2026 - 2031) |
||||||

※ 本網頁內容可能與最新版本有所差異。詳細情況請與我們聯繫。
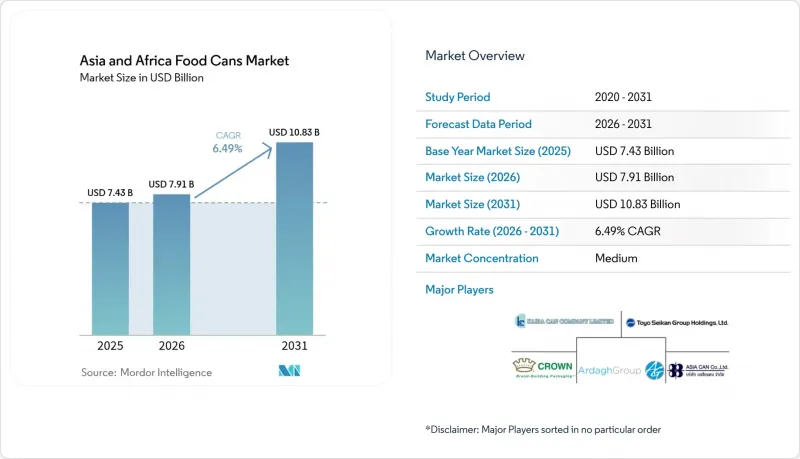
據 Mordor Intelligence 稱,亞洲和非洲的食品罐頭市場預計在 2026 年達到 79.1 億美元,高於 2025 年的 74.3 億美元,預計到 2031 年將達到 108.3 億美元。
預計 2026 年至 2031 年的複合年成長率為 6.49%。
本報告按材質(鋁罐、鋼罐和馬口鐵罐)、罐型(兩片罐、三片罐)、應用領域(魚貝類、水果蔬菜、加工食品、寵物食品等)、開啟方式(易拉罐等)以及地區(亞洲(中國、印度、韓國、東南亞)、非洲(南非))進行細分。市場預測以美元計價。
亞洲和非洲食品罐頭市場的趨勢和洞察
與其他材料相比,金屬罐的回收率更高。
在成熟市場,金屬罐的回收率已超過90%,使其比受到更嚴格監管的塑膠更具優勢。南非於2021年實施的生產者延伸責任制(EPR)計劃,對噸位價格進行差異化定價,並為高回收率材料提供經濟獎勵。中國便利商店連鎖品牌邊利豐已在其1500家門市部署QR碼系統以驗證產品真偽,展現了金屬包裝數位化的巨大潛力。在坦尚尼亞首都阿魯沙,市政當局每月收集超過314噸廢料,從而節省了未使用的鐵礦石和能源。這也向政策制定者表明,亞洲和非洲食品罐市場的循環價值可以在當地實現貨幣化。 ISO 14001認證如今已成為跨國食品加工企業的常用選擇標準,進一步增強了可回收罐的競爭優勢。
罐頭食品的需求主要受成本和便利性優勢的驅動。
都市區生活方式縮短了飲食準備時間,促使家庭選擇可常溫保存的蛋白質和蔬菜。印尼擁有超過41,000家雜貨店,罐頭產品在零售市場隨處可見。奈及利亞消費者越來越重視營養和食品安全,能夠傳達產品品質訊息的包裝會影響品牌偏好。在冷藏庫普及率較低的郊區,罐裝魚肉被視為可靠的蛋白質來源。越南海鮮產業預計到2024年11月將出口價值92億美元的加工產品,顯示罐頭加工將易腐水產品轉化為可出口的價值。 HACCP和GMP要求仍是產品上架當地超級市場貨架的必要條件。
塑膠仍然是一種可行的替代品。
軟包裝正在威脅罐頭食品在單一產品線中的主導地位。盧安達的塑膠禁令導致某些產品的單價飆升五倍,顯示全面禁令並非成本中立。西非的莫希納尼集團正在加納和奈及利亞建設年產3萬噸的再生聚對苯二甲酸乙二醇酯(rPET)工廠,為加工商提供低碳樹脂選擇。利樂公司宣稱其馬口鐵罐。然而,馬口鐵罐仍可承受超過攝氏121度的蒸餾加熱,這對於商用包裝和緊急救援食品供應至關重要。
細分市場分析
到2025年,鐵桶和馬口鐵桶將佔據亞洲和非洲食品罐市場的56.15%。這主要得益於廣東和江蘇兩省大規模綜合鋼廠建立的成熟供應鏈和價格優勢。該細分市場在商用番茄醬和大容量水果雞尾酒罐頭領域保持了價格競爭力,推動亞洲和非洲食品罐市場規模在同年達到41.7億美元。製造商正在採用連續退火和無鉻鈍化製程以符合歐盟食品接觸法規,並透過伺服控管封罐機來提高產品品質。
預計到2031年,鋁罐市場將以7.85%的複合年成長率成長,這主要得益於飲料罐製造商將其專業技術轉移到食品加工生產線,以及回收目標優先考慮輕質合金。皇冠控股公司2025年第一季的全球飲料罐銷量較去年同期成長24%,顯示鋁罐銷售量成長強勁。然而,供應限制反而加劇了這一領域的稀缺性。 2025年,三分之二的冶煉廠擴建工程集中在印度尼西亞,但地理分散導致運輸成本上升。基於ISO 14001的環境目標正在推動跨國食品加工企業採用鋁材,從而支撐了亞洲和非洲的食品罐市場。
到2025年,兩片式罐頭將佔市場佔有率的66.94%。這主要歸功於拉拔成型工藝,該工藝能夠實現高速生產並減少金屬用量,對於成本敏感的豆類和蛋白質食品而言至關重要。製程自動化包括線上視覺檢測和氮氣注入,以延長罐頭頂部空間的保存期限。皇冠公司已將生產線從胡志明市和新加坡轉移至位於頭頓的超級工廠,降低了當地客戶的加工成本。
三片式包裝的興起主要得益於奈及利亞和加納當地番茄加工商對高度和直徑差異的需求,預計其年複合成長率將達到7.05%。在丹格特集團位於卡達瓦的工廠,一台專為400克番茄醬最佳化的三片式焊接機每天可加工1,200噸番茄。這項技術的柔軟性彌補了封口工序較高的人事費用,而雷射側縫焊接則縮小了與兩片式罐頭在品質上的差距。此外,對自動化封口粉末噴塗設備和內部烤漆爐的投資也有助於維持產品品質的穩定性。
其他好處:
- Excel格式的市場預測(ME)表
- 3個月的分析師支持
目錄
第1章:引言
- 研究假設和市場定義
- 調查範圍
第2章:調查方法
第3章執行摘要
第4章 市場狀況
- 市場概覽
- 市場促進因素
- 與其他材質相比,金屬罐的回收適用性評分更高。
- 罐頭食品的需求主要受性價比和便利性驅動。
- 產品創新延長了產品的保存期限。
- 東南亞已烹調水產品出口量激增。
- 政府關於循環經濟的指令正在推動金屬包裝的發展。
- 智慧罐頭追蹤技術的興起及其作為防偽措施的作用。
- 市場限制因素
- 塑膠仍然是一種可行的替代材料。
- 鋁和鋼的價格波動
- 新興非洲市場冷鏈基礎設施分散
- 由於不含雙酚A的內裝材料普及速度緩慢,監管機構對其審查力道有所加大。
- 產業價值鏈分析
- 監理情勢
- 技術展望
- 波特五力分析
- 投資分析
第5章 市場規模與成長預測
- 材料
- 鋁罐
- 鋼罐/馬口鐵罐
- 罐型
- 2 件
- 3 件
- 透過使用
- 魚貝類
- 水果和蔬菜
- 加工食品
- 寵物食品
- 其他用途
- 透過開門法
- 易打開端
- 標準端
- 按地區
- 亞洲
- 中國
- 印度
- 韓國
- 東南亞
- 非洲
- 南非
- 亞洲
第6章 競爭情勢
- 市場集中度
- 策略趨勢
- 市佔率分析
- 公司簡介
- Crown Holdings Inc.
- Silgan Holdings Inc.
- Ardagh Group SA
- Toyo Seikan Group Holdings Ltd.
- ORG Packaging Co. Limited
- Kian Joo Can Factory Berhad
- Kaira Can Private Limited
- Asia Can Co. Ltd.
- Dongwon Systems Corporation
- Nampak Ltd.
- Can It(Pty)Ltd.
- Royal Cans Industries Company
- CanSmart Group
- MC Packaging Pte Ltd.
- Mahkota Can Manufacturing Sdn. Bhd.
- Shanghai Baosteel Packaging Co. Ltd.
- PT United Can Company
- Fujian Fuzheng Metal Packaging Co. Ltd.
- GuangDong Huayi Metal Packaging Co. Ltd.
第7章 市場機會與未來展望
According to Mordor Intelligence, Asia and Africa food cans market size in 2026 is estimated at USD 7.91 billion, growing from 2025 value of USD 7.43 billion with 2031 projections showing USD 10.83 billion, growing at 6.49% CAGR over 2026-2031.
This report is Segmented by Material (Aluminum Cans, and Steel and Tin Cans), Can Type (2-Piece, and 3-Piece), Application (Fish and Seafood, Fruits and Vegetables, Processed Food, Pet Food, and More), Opening Type (Easy-Open End, and More), and Geography (Asia (China, India, South Korea, Southeast Asia), and Africa (South Africa)). The Market Forecasts are Provided in Terms of Value (USD).
Asia And Africa Food Cans Market Trends and Insights
High Recyclable Score of Metal Cans Over Alternatives
Metal cans achieve recyclability rates above 90% in mature markets, positioning them favorably against plastics that face escalating regulatory scrutiny. South Africa's Extended Producer Responsibility program, in effect since 2021, imposes differentiated per-ton fees that financially reward highly recyclable substrates. China's convenience-store chain Bianlifeng has rolled out QR-code systems across 1,500 outlets to verify product authenticity, showcasing the digital potential of metal packaging. In Tanzania's Arusha city, municipal scrap collection exceeds 314 tonnes per month, resulting in conserved virgin iron ore and energy savings, and signaling to policymakers that the circular value of the Asia and Africa food cans market can be monetized locally. ISO 14001 certification is now a common selection criterion for multinational food processors, reinforcing the competitive edge of recyclable cans.
Demand for Canned Foods Driven by Cost and Convenience Advantages
Urban lifestyles compress meal-preparation time, pushing households toward shelf-stable proteins and vegetables. Indonesia hosts more than 41,000 grocery outlets, giving canned products deep retail reach. Nigerian shoppers increasingly prize nutrition and food safety, and packaging that communicates integrity drives brand preference. Limited refrigerators in peri-urban districts make canned fish and meats the reliable protein of choice. Vietnam's seafood industry shipped USD 9.2 billion worth of processed products by November 2024, illustrating how canning converts perishable marine harvests into exportable value. HACCP and GMP requirements remain entry tickets to regional supermarket shelves.
Plastic Remains a Credible Alternative
Flexible packs threaten cans in single-serve SKU lines. Rwanda's plastic ban raised per-unit costs five-fold for certain goods, showing that outright prohibition is not cost-neutral. West Africa's Mohinani Group built 30,000 tpa rPET plants in Ghana and Nigeria, giving converters low-carbon resin options. Tetra Recart cartons position themselves as 6 times lighter on the environment than tin cans for pet food. Yet cans still support retort temperatures above 121 °C, essential for institutional formats and emergency-relief rations.
Other drivers and restraints analyzed in the detailed report include:
- Product Innovations Increasing Shelf Life
- Surge in Ready-to-Eat Seafood Exports From Southeast Asia
- Price Volatility of Aluminum and Steel
For complete list of drivers and restraints, kindly check the Table Of Contents.
Segment Analysis
Steel and tin drums accounted for 56.15% of the Asia and Africa food cans market share in 2025, driven by established supply chains and price advantages associated with high-volume integrated steel mills in Guangdong and Jiangsu. The segment preserves competitive pricing for institutional tomato paste and large-format fruit cocktail, anchoring the Asia and Africa food cans market size at USD 4.17 billion that year. Producers utilize continuous annealing and chrome-free passivation to comply with EU food-contact regulations, while servo-controlled seamers enhance quality.
Aluminum cans are expected to grow at a 7.85% CAGR to 2031, driven by beverage converters transferring expertise to food lines and as recycling targets favor lightweight alloys. Crown Holdings grew global beverage-can income 24% year-over-year in Q1 2025, demonstrating aluminum's robust volume trajectory. Supply constraints paradoxically boost the segment's perceived scarcity value; Indonesia hosts two-thirds of the 2025 smelter additions, but geographic dispersion raises freight costs. Environmental targets under ISO 14001 align multinational food processors with aluminum adoption, underpinning the Asia and Africa food cans market.
Two-piece bodies controlled 66.94% market revenue in 2025, primarily through draw-and-iron lines that achieve high speed and low metal usage, crucial for cost-sensitive legumes and protein meals. Process automation includes in-line vision inspection and nitrogen dosing to extend headspace life. Crown transferred volumes from Ho Chi Minh City and Singapore into its Vung Tau super-plant, lowering conversion costs for regional accounts.
Three-piece formats show a 7.05% CAGR outlook, fueled by local tomato processors in Nigeria and Ghana that require variable heights and diameters. Dangote's Kadawa complex runs 1,200 tons per day through three-piece welders optimized for 400 g tomato paste. The technology's flexibility offsets its higher seam labor share, and laser side-seam welding narrows integrity gaps with two-piece bodies. Investments in automatic seam-powder sprinklers and internal lacquer ovens keep quality on par.
Complete Report Scope:
- By Material
- Aluminum Cans
- Steel/Tin Cans
- By Can Type
- 2-Piece
- 3-Piece
- By Application
- Fish and Seafood
- Fruits and Vegetables
- Processed Food
- Pet Food
- Other Applications
- By Opening Type
- Easy-Open End
- Standard End
- By Geography
- Asia
- China
- India
- South Korea
- Southeast Asia
- Africa
- South Africa
- Asia
List of Companies Covered in this Report:
- Crown Holdings Inc.
- Silgan Holdings Inc.
- Ardagh Group S.A.
- Toyo Seikan Group Holdings Ltd.
- ORG Packaging Co. Limited
- Kian Joo Can Factory Berhad
- Kaira Can Private Limited
- Asia Can Co. Ltd.
- Dongwon Systems Corporation
- Nampak Ltd.
- Can It (Pty) Ltd.
- Royal Cans Industries Company
- CanSmart Group
- MC Packaging Pte Ltd.
- Mahkota Can Manufacturing Sdn. Bhd.
- Shanghai Baosteel Packaging Co. Ltd.
- PT United Can Company
- Fujian Fuzheng Metal Packaging Co. Ltd.
- GuangDong Huayi Metal Packaging Co. Ltd.
Additional Benefits:
- The market estimate (ME) sheet in Excel format
- 3 months of analyst support
TABLE OF CONTENTS
1 INTRODUCTION
- 1.1 Study Assumptions and Market Definition
- 1.2 Scope of the Study
2 RESEARCH METHODOLOGY
3 EXECUTIVE SUMMARY
4 MARKET LANDSCAPE
- 4.1 Market Overview
- 4.2 Market Drivers
- 4.2.1 High Recyclable Score of Metal Cans Over Alternatives
- 4.2.2 Demand for Canned Foods Driven by Cost and Convenience Advantages
- 4.2.3 Product Innovations Increasing Shelf Life
- 4.2.4 Surge in Ready-to-Eat Seafood Exports From Southeast Asia
- 4.2.5 Government Circular-Economy Mandates Pushing Metal Packaging
- 4.2.6 Rise of Smart Can Tracking for Anti-Counterfeit Assurance
- 4.3 Market Restraints
- 4.3.1 Plastic Remains a Credible Alternative
- 4.3.2 Price Volatility of Aluminum and Steel
- 4.3.3 Fragmented Cold-Chain Infrastructure in Emerging African Markets
- 4.3.4 Slow Uptake of BPA-Free Linings Increasing Regulatory Scrutiny
- 4.4 Industry Value Chain Analysis
- 4.5 Regulatory Landscape
- 4.6 Technological Outlook
- 4.7 Porter's Five Forces Analysis
- 4.7.1 Bargaining Power of Suppliers
- 4.7.2 Bargaining Power of Consumers
- 4.7.3 Threat of New Entrants
- 4.7.4 Intensity of Competitive Rivalry
- 4.7.5 Threat of Substitutes
- 4.8 Investment Analysis
5 MARKET SIZE AND GROWTH FORECASTS (VALUE)
- 5.1 By Material
- 5.1.1 Aluminum Cans
- 5.1.2 Steel/Tin Cans
- 5.2 By Can Type
- 5.2.1 2-Piece
- 5.2.2 3-Piece
- 5.3 By Application
- 5.3.1 Fish and Seafood
- 5.3.2 Fruits and Vegetables
- 5.3.3 Processed Food
- 5.3.4 Pet Food
- 5.3.5 Other Applications
- 5.4 By Opening Type
- 5.4.1 Easy-Open End
- 5.4.2 Standard End
- 5.5 By Geography
- 5.5.1 Asia
- 5.5.1.1 China
- 5.5.1.2 India
- 5.5.1.3 South Korea
- 5.5.1.4 Southeast Asia
- 5.5.2 Africa
- 5.5.2.1 South Africa
- 5.5.1 Asia
6 COMPETITIVE LANDSCAPE
- 6.1 Market Concentration
- 6.2 Strategic Moves
- 6.3 Market Share Analysis
- 6.4 Company Profiles (includes Global level Overview, Market level overview, Core Segments, Financials as available, Strategic Information, Market Rank/Share for key companies, Products and Services, and Recent Developments)
- 6.4.1 Crown Holdings Inc.
- 6.4.2 Silgan Holdings Inc.
- 6.4.3 Ardagh Group S.A.
- 6.4.4 Toyo Seikan Group Holdings Ltd.
- 6.4.5 ORG Packaging Co. Limited
- 6.4.6 Kian Joo Can Factory Berhad
- 6.4.7 Kaira Can Private Limited
- 6.4.8 Asia Can Co. Ltd.
- 6.4.9 Dongwon Systems Corporation
- 6.4.10 Nampak Ltd.
- 6.4.11 Can It (Pty) Ltd.
- 6.4.12 Royal Cans Industries Company
- 6.4.13 CanSmart Group
- 6.4.14 MC Packaging Pte Ltd.
- 6.4.15 Mahkota Can Manufacturing Sdn. Bhd.
- 6.4.16 Shanghai Baosteel Packaging Co. Ltd.
- 6.4.17 PT United Can Company
- 6.4.18 Fujian Fuzheng Metal Packaging Co. Ltd.
- 6.4.19 GuangDong Huayi Metal Packaging Co. Ltd.
7 MARKET OPPORTUNITIES AND FUTURE OUTLOOK
- 7.1 White-Space and Unmet-Need Assessment

 食品罐頭:市佔率分析、產業趨勢與統計、成長預測(2026-2031)
 食品罐頭市場:機會、成長要素、產業趨勢分析及2026-2035年預測
 食品罐頭市場:2026-2032年全球市場預測(依材料、罐型、製造流程、罐頭形狀、封蓋類型、罐頭尺寸、產品類型、最終用戶和分銷管道分類)
 食品罐頭市場分析及預測(至2035年):類型、產品類型、材質類型、應用、技術、最終用戶、製程、功能、設備、解決方案
 2026年全球食品罐頭市場報告
 食品罐市場規模、佔有率和成長分析(按材料、罐型、蓋型、應用和地區分類)-2026-2033年產業預測2034年全球食品罐頭(不含飲料罐頭)市場機會與策略
 2030 年食品罐市場預測:按類型、材質、容量、蓋子類型、應用和地區進行的全球分析
 食品罐頭市場:未來預測(2025-2030年)
 全球金屬食品市場,2024-2028