

 |
市場調查報告書
商品編碼
2124278
食品罐頭:市佔率分析、產業趨勢與統計、成長預測(2026-2031)Food Cans - Market Share Analysis, Industry Trends & Statistics, Growth Forecasts (2026 - 2031) |
||||||

※ 本網頁內容可能與最新版本有所差異。詳細情況請與我們聯繫。
根據 Mordor Intelligence 預測,食品罐頭市場規模預計將在 2026 年達到 284.7 億美元,到 2031 年達到 358.6 億美元,複合年成長率為 4.72%。
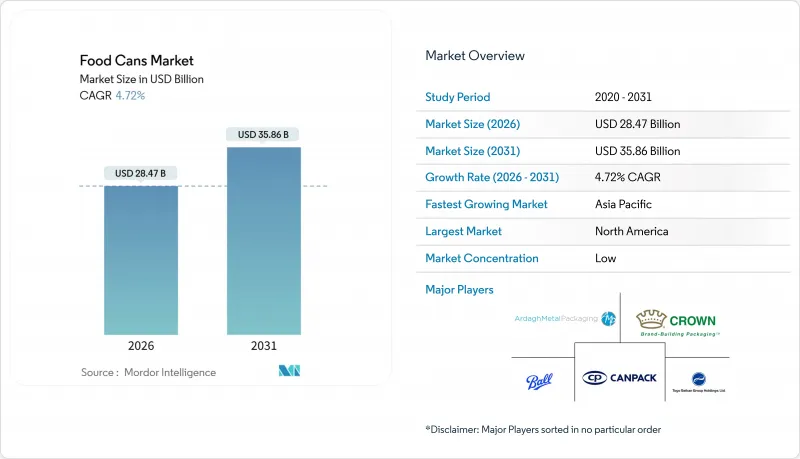
本報告按材質(鋼/馬口鐵、鋁)、罐體類型(兩片罐、三片罐)、罐體尺寸(小、中、大)、應用領域(調理食品、魚貝類、水果蔬菜、加工食品、寵物食品、其他)以及地區(北美、南美、歐洲、亞太、中東和非洲)進行細分。市場預測以美元計價。
全球食品罐頭市場趨勢與洞察
可支配收入的增加和都市化正在促進加工食品的消費。
印度、印尼和巴西的快速城市化減少了人們在家做飯的時間,導致家庭囤積無需冷藏的常溫保存蛋白質、水果和蔬菜。印度信實消費品公司決定投資4000億印度盧比(約48億美元)建造一個綜合食品園區,其首家工廠將建在庫爾努爾,專注於罐頭食品的生產。這表明,在冷鏈基礎設施完全建成之前,加工商將金屬包裝視為過渡階段的首選。預計到2024年,巴西的零售額將達到1,830億美元,但消費者並沒有放棄罐頭食品,而是更換價格實惠的罐裝主食,這一趨勢在南美洲的小城市也同樣存在。
透過現代零售和電子商務拓展食品分銷管道
在直接面對消費者的食品雜貨經營模式中,需要使用無需冷藏即可承受最後一公里運輸過程中震動的包裝,在這方面,金屬罐比玻璃瓶具有結構優勢。 2024年,墨西哥現代貿易部門的食品支出佔家庭食品支出的50%以上,電子商務銷售額達5.42億美元。這導致自有品牌罐裝豆類和辣椒的貨架空間增加。阿拉伯聯合大公國將於2026年禁用多種一次性塑膠製品,促使快餐店開始為外帶平台提供常溫保存的罐裝湯。
基於成本和重量優勢,轉向使用軟性塑膠袋和紙盒。
由於軟包裝袋比同類罐頭輕40%,旨在減少運輸過程中碳排放的品牌商正將其用於水果杯和肉汁澆頭等產品。東洋制菓公司報告稱,隨著自有品牌尋求更經濟實惠的單份包裝產品,其在2024年殺菌袋產品的市場佔有率有所成長。 SIG等紙盒供應商正在使用薄鋁複合材料來達到與金屬罐類似的阻隔性能,以在歐洲與常溫保存的湯類產品競爭。
細分市場分析
2025年,鋼罐和馬口鐵罐佔食品罐市場銷售額的63.06%,但鋁罐的成長速度最快,到2031年複合成長率(CAGR)將達到5.43%。鋁製食品罐的市場規模不斷擴大,是因為輕質合金的使用使得罐壁厚度減少10%至15%,而爆破強度卻絲毫不減。 2024年,諾貝麗斯(Novelis)在其所有軋延產品線中實現了63%的再生材料含量,這充分證明了閉合迴路經濟模式的有效性,與原生生產相比,該模式可將碳排放強度降低90%以上。鋁的可塑性使其能夠設計出無縫的兩片式結構,吸引了高階寵物食品和調理食品品牌的青睞。同時,在價格主導品類中,鋼罐仍然佔據主導地位,因為大規模生產可以攤提深拉模具的成本。
加工商更傾向於使用鋁罐向電商倉庫出貨,因為電商倉庫按體積重量收費,而且鋁是非鐵金屬,不易被酸性番茄醬腐蝕。磁性鋼罐便於市政部門進行分類,使其在成熟的北美回收系統中更具優勢。在新興市場,由於鋁罐的重熔能力有限,其應用受到限制,因此鋼罐在罐裝蔬菜領域仍佔有一席之地。在這種鋁罐和鋼罐並存的市場環境下,加工商通常會從多個供應商購買以規避價格波動風險,隨著企業不斷最佳化材料以適應其分銷管道和所在地區,食品罐頭市場也在不斷發展。
到2025年,三片式焊接罐將佔總銷量的58.63%,而兩片式粉碎成型和壓製成型罐的銷量將在2031年之前以5.32%的複合年成長率成長。克朗斯目前的填充生產線每小時可處理超過12萬罐,使加工商能夠更快地攤銷高昂的模具成本,並將每罐400克標準罐的成本降低到0.30美元以下。無縫罐體無需側面焊接,減少了塗層需求,並提升了其在展示中的吸引力,從而促進了其在高階寵物食品和微波爐蒸餾食品領域的應用。
兩片式食品罐的市場佔有率在亞太地區成長最為迅速,該地區新建工廠通常完全拋棄了傳統的焊接工藝。波爾公司計劃在安得拉邦投資6,000萬美元,以提高其兩片式罐的產能,以應對印度金屬包裝需求兩位數的成長。對於500克以上的商用罐,三片式製程仍然是首選,因為深拉成型需要更昂貴的模具。加工商在成本、速度和材料利用率之間權衡取捨,使得兩種製程並存,造就了食品罐市場基材的豐富多樣性。
區域分析
2025年,北美佔全球銷售額的39.87%。這得益於成熟的罐頭生產線、完善的供應鏈以及支撐基本銷售的高人均消費量。儘管由於人口成長趨於平緩,其成長率低於全球複合年成長率,但營運現代化正在提升利潤率。皇冠控股出售了其歐洲馬口鐵業務,將資金重新配置到其在北美的特殊食品罐頭業務,凸顯了其向高利潤利基市場的轉型。 2023年,鋼材價格波動以及43%的鋁罐回收率導致廢料供應緊張,迫使加工商將額外費用轉嫁給消費者。
亞太地區正以6.42%的複合年成長率快速擴張,這主要得益於都市化、可支配收入的成長以及對本地供應鏈的投資。波爾公司在斯里城和塔羅賈的擴張表明,大型全球企業正在對其兩片式罐生產線進行本地化改造,以滿足進入印度市場的跨國食品加工商的需求。結合日本塗層技術和本地分銷網路的合資企業在中國的馬口鐵廠和東南亞的金槍魚生產基地引起了廣泛關注。在印度舉行的世界食品印度高峰會上,共達成了1.02兆印度盧比(約122億美元)的投資承諾,顯示市場正在轉向罐頭產品,以彌補冷鏈的不足。
歐洲市場正以約4.3%的複合年成長率擴張,人口成長放緩抑制了這項成長速度,但永續發展法規的實施則推動了成長。 2024年12月生效的BPA禁令迫使加工商採用新一代內襯材料,增加了資金需求,但也為先發優勢創造了市場優勢。隨著折扣店大力推廣以性價比為導向的罐頭產品組合,自有品牌滲透率持續上升。南美、中東和非洲的成長率均達到中等個位數。巴西1,830億美元的零售市場依然強勁,而阿拉伯聯合大公國逐步實施的塑膠禁令進一步提升了餐飲服務業服務業對罐頭食品的需求。
其他好處
- Excel格式的市場預測(ME)表
- 3個月的分析師支持
目錄
第1章:引言
- 研究假設和市場定義
- 調查範圍
第2章:調查方法
第3章執行摘要
第4章 市場狀況
- 市場概覽
- 市場促進因素
- 可支配所得的增加和都市化促進了加工食品的消費。
- 現代零售和電子商務食品分銷管道的擴張
- 與軟包裝相比,具有更優異的阻隔性和更長的保存期限。
- 寵物數量的增加帶動了罐裝。
- 新興市場高速兩片式罐生產線的擴張
- 擴大智慧罐頭上QR碼的使用範圍,以實現可追溯性和消費者互動。
- 市場限制因素
- 由於成本和重量優勢,過渡到使用軟性塑膠袋和紙盒。
- 鋁和鋼價格波動會影響利潤率。
- 對含雙酚A環氧樹脂襯裡的嚴格監管
- 開發中國家。
- 產業價值鏈分析
- 宏觀經濟因素對市場的影響
- 監理情勢
- 技術展望
- 波特五力分析
- 投資分析
第5章 市場規模與成長預測
- 依材料類型
- 鋼/馬口鐵
- 鋁
- 可以透過類型
- 兩件套罐
- 三件組罐
- 按罐體尺寸
- 小號(200公克或以下)
- 中(201-500克)
- 大號(超過500公克)
- 透過使用
- 調理食品
- 魚貝類
- 水果和蔬菜
- 加工食品
- 寵物食品
- 其他
- 按地區
- 北美洲
- 美國
- 加拿大
- 墨西哥
- 南美洲
- 巴西
- 阿根廷
- 其他南美國家
- 歐洲
- 德國
- 英國
- 法國
- 義大利
- 西班牙
- 其他歐洲國家
- 亞太地區
- 中國
- 日本
- 印度
- 韓國
- 澳洲
- 其他亞太國家
- 中東和非洲
- 中東
- 沙烏地阿拉伯
- 阿拉伯聯合大公國
- 土耳其
- 其他中東國家
- 非洲
- 南非
- 埃及
- 奈及利亞
- 其他非洲地區
- 中東
- 北美洲
第6章 競爭情勢
- 市場集中度
- 策略趨勢
- 市佔率分析
- 公司簡介
- Crown Holdings Inc.
- Silgan Holdings Inc.
- Trivium Packaging
- Toyo Seikan Group Holdings Ltd.
- CANPACK SA
- Sonoco Products Company
- Ardagh Metal Packaging
- 波爾公司(食品罐頭部門)
- Wells Can Company
- Kian Joo Group
- Visy Industries
- Jamestrong Packaging
- Colep Packaging
- Aaron Packaging Inc.
- CPMC Holdings Ltd.
- Greif Inc.
- Daeryuk Can Co. Ltd.
- Huber Packaging Group
- Crown Asia Pacific Holdings
- HPM Packaging
第7章 市場機會與未來展望
According to Mordor Intelligence, the food cans market size stands at USD 28.47 billion in 2026 and is forecast to reach USD 35.86 billion by 2031, progressing at a 4.72% CAGR.
This report is Segmented by Material Type (Steel/Tin, and Aluminum), Can Type (2-Piece Cans, and 3-Piece Cans), Can Size (Small, Medium, and Large), Application (Ready Meals, Fish and Seafood, Fruits and Vegetables, Processed Food, Pet Food, and More), and Geography (North America, South America, Europe, Asia-Pacific, and Middle East and Africa). The Market Forecasts are Provided in Terms of Value (USD).
Global Food Cans Market Trends and Insights
Rising Disposable Incomes and Urbanization Boosting Packaged Food Consumption
Rapid migration to cities across India, Indonesia, and Brazil is shrinking the window for home cooking, so households are stocking shelf-stable proteins, fruits, and vegetables that require no refrigeration. India's Reliance Consumer Products has committed INR 40,000 crore (USD 4.8 billion) to integrated food parks, with the inaugural plant in Kurnool focusing on canned produce. This signals that processors view metal packaging as a first wave before cold-chain infrastructure matures.Brazil's retail turnover reached USD 183 billion in 2024, with consumers trading down into value-priced canned staples rather than exiting categories, a pattern replicated in secondary cities across South America.
Expansion of Modern Retail and E-commerce Grocery Channels
Direct-to-consumer grocery models rely on packaging that can withstand last-mile bumps without refrigeration, giving metal cans a structural advantage over glass. Mexico's modern retail sector captured more than 50% of household food expenditures in 2024, with e-commerce sales reaching USD 542 million, thereby widening shelf space for private-label canned beans and chilies.The United Arab Emirates banned several single-use plastic items in 2026, prompting quick-service restaurants to adopt ambient-stable canned soups for delivery platforms.
Shift Toward Flexible Plastic Pouches and Cartons Due to Cost and Weight Advantages
Flexible pouches weigh up to 40% less than equivalent cans, so brand owners chasing lower transport emissions adopt them for fruit cups and gravy toppers. Toyo Seikan reported share gains for its retort-pouch line in 2024 as private labels sought cheaper single-serve options. Carton suppliers such as SIG use thin aluminum laminate to approximate metal-can barrier properties, challenging ambient soup SKUs across Europe.
Other drivers and restraints analyzed in the detailed report include:
- Superior Barrier Properties and Shelf Life Extension Compared to Flexible Packaging
- Increasing Pet Ownership Driving Demand for Wet Pet Food in Metal Cans
- Volatility in Aluminum and Steel Prices Affecting Profit Margins
For complete list of drivers and restraints, kindly check the Table Of Contents.
Segment Analysis
Steel and tin-based cans generated 63.06% of food cans market revenue in 2025, yet aluminum posted the fastest 5.43% CAGR through 2031. The food cans market size for aluminum formats is widening because lightweight alloys allow 10%-15% thinner walls that reduce freight cost without compromising burst strength. Novelis delivered 63% recycled content across its rolled-product mix in 2024, validating closed-loop economics that reduce carbon intensity by more than 90% relative to primary production. Aluminum's malleability enables seamless two-piece designs that attract premium pet food and ready-meal brands, while steel stays dominant in price-led categories where deep-draw tooling amortizes over high volumes.
Converters favor aluminum when shipping to e-commerce warehouses that bill by dimensional weight, and the material's non-ferrous nature avoids corrosion in acidic tomato bases. Still, magnetic steel simplifies municipal sortation, an edge in mature North American recycling systems. In emerging markets, limited remelt capacity caps aluminum uptake, so steel maintains hold in staple canned vegetables. The dual-material landscape means processors often dual-source to hedge price swings, further advancing the food cans market as players align substrate to channel and geography.
Three-piece welded cans captured 58.63% of revenue in 2025, but two-piece drawn-and-ironed designs are expanding at a 5.32% CAGR through 2031. Krones filling lines now process more than 120,000 units per hour, allowing converters to amortize higher tooling costs faster and achieve a sub-USD 0.30 cost for a standard 400-gram can. Seamless bodies eliminate side welds, reducing coating needs and enhancing shelf appeal, which boosts adoption in premium pet food and microwavable ready meals.
The food cans market share for two-piece formats climbs fastest in the Asia-Pacific region, where greenfield plants often skip legacy welding altogether. Ball Corporation will invest USD 60 million in Andhra Pradesh to add two-piece capacity, in line with India's double-digit growth in metal packaging demand. Three-piece technology remains favored for institutional cans weighing above 500 grams because deep draws would require more costly tooling. As processors balance cost, speed, and material intensity, both formats coexist, giving the food cans market resilient substrate diversity.
Complete Report Scope:
- By Material Type
- Steel/Tin
- Aluminum
- By Can Type
- 2-piece Cans
- 3-piece Cans
- By Can Size
- Small (Less than Equal to 200 g)
- Medium (201-500 g)
- Large (More than 500 g)
- By Application
- Ready Meals
- Fish and Seafood
- Fruits and Vegetables
- Processed Food
- Pet Food
- Other Applications
- By Geography
- North America
- United States
- Canada
- Mexico
- South America
- Brazil
- Argentina
- Rest of South America
- Europe
- Germany
- United Kingdom
- France
- Italy
- Spain
- Rest of Europe
- Asia-Pacific
- China
- Japan
- India
- South Korea
- Australia
- Rest of Asia-Pacific
- Middle East and Africa
- Middle East
- Saudi Arabia
- United Arab Emirates
- Turkey
- Rest of Middle East
- Africa
- South Africa
- Egypt
- Nigeria
- Rest of Africa
- Middle East
- North America
Geography Analysis
North America held 39.87% of the global revenue in 2025, as entrenched canning lines, established supply chains, and high per-capita consumption sustain baseline volumes. Growth lags behind the global CAGR as the population plateaus, yet operational upgrades support margins. Crown Holdings sold its European tinplate arm to reallocate capital toward North American specialty food cans, underscoring a shift to higher-margin niches. Steel price volatility and a 43% aluminum-can recycling rate in 2023 have tightened scrap supply, nudging converters to pass through surcharges.
The Asia-Pacific region expands at the fastest rate, with a 6.42% CAGR, driven by urbanization, increased disposable income, and investment in local supply chains. Ball's Sri City and Taloja expansions demonstrate how global majors are localizing two-piece lines to cater to multinational food processors entering India. China's tinplate mills and Southeast Asian tuna corridors attract joint ventures blending Japanese coating know-how with local distribution. India's World Food India summit drew INR 1.02 trillion (USD 12.2 billion) in pledges, pivoting toward canned produce to circumvent limited cold chains.
Europe advances at roughly 4.3% CAGR, a pace dampened by slow demographic growth but energized by sustainability rules. The December 2024 BPA ban forces converters to adopt next-generation linings, amplifying capital needs yet giving early movers a marketing edge. Private-label penetration continues to rise as discounters promote value-oriented canned assortments. South America and the Middle East and Africa grow at mid-single digits; Brazil's USD 183 billion retail market shows resilience and the UAE plastic-ban shift adds incremental can volumes in foodservice settings.
- Crown Holdings Inc.
- Silgan Holdings Inc.
- Trivium Packaging
- Toyo Seikan Group Holdings Ltd.
- CANPACK S.A.
- Sonoco Products Company
- Ardagh Metal Packaging
- Ball Corporation (Food Can Division)
- Wells Can Company
- Kian Joo Group
- Visy Industries
- Jamestrong Packaging
- Colep Packaging
- Aaron Packaging Inc.
- CPMC Holdings Ltd.
- Greif Inc.
- Daeryuk Can Co. Ltd.
- Huber Packaging Group
- Crown Asia Pacific Holdings
- HPM Packaging
Additional Benefits:
- The market estimate (ME) sheet in Excel format
- 3 months of analyst support
TABLE OF CONTENTS
1 INTRODUCTION
- 1.1 Study Assumptions and Market Definition
- 1.2 Scope of the Study
2 RESEARCH METHODOLOGY
3 EXECUTIVE SUMMARY
4 MARKET LANDSCAPE
- 4.1 Market Overview
- 4.2 Market Drivers
- 4.2.1 Rising Disposable Incomes and Urbanization Boosting Packaged Food Consumption
- 4.2.2 Expansion of Modern Retail and E-commerce Grocery Channels
- 4.2.3 Superior Barrier Properties and Shelf Life Extension Compared to Flexible Packaging
- 4.2.4 Increasing Pet Ownership Driving Demand for Wet Pet Food in Metal Cans
- 4.2.5 Increased Adoption of High-speed Two-piece Can Manufacturing Lines in Emerging Markets
- 4.2.6 Growing Use of Smart Can QR Codes Enabling Traceability and Consumer Engagement
- 4.3 Market Restraints
- 4.3.1 Shift Toward Flexible Plastic Pouches and Cartons Due to Cost and Weight Advantages
- 4.3.2 Volatility in Aluminum and Steel Prices Affecting Profit Margins
- 4.3.3 Stringent Regulations Against BPA-based Epoxy Linings
- 4.3.4 Limited Recycling Infrastructure for Multi-layer Polymer Coated Steel Cans in Developing Economies
- 4.4 Industry Value Chain Analysis
- 4.5 Impact of Macroeconomic Factors on the Market
- 4.6 Regulatory Landscape
- 4.7 Technological Outlook
- 4.8 Porter's Five Forces Analysis
- 4.8.1 Bargaining Power of Suppliers
- 4.8.2 Bargaining Power of Buyers
- 4.8.3 Threat of New Entrants
- 4.8.4 Threat of Substitute Products
- 4.8.5 Intensity of Competitive Rivalry
- 4.9 Investment Analysis
5 MARKET SIZE AND GROWTH FORECASTS (VALUE)
- 5.1 By Material Type
- 5.1.1 Steel/Tin
- 5.1.2 Aluminum
- 5.2 By Can Type
- 5.2.1 2-piece Cans
- 5.2.2 3-piece Cans
- 5.3 By Can Size
- 5.3.1 Small (Less than Equal to 200 g)
- 5.3.2 Medium (201-500 g)
- 5.3.3 Large (More than 500 g)
- 5.4 By Application
- 5.4.1 Ready Meals
- 5.4.2 Fish and Seafood
- 5.4.3 Fruits and Vegetables
- 5.4.4 Processed Food
- 5.4.5 Pet Food
- 5.4.6 Other Applications
- 5.5 By Geography
- 5.5.1 North America
- 5.5.1.1 United States
- 5.5.1.2 Canada
- 5.5.1.3 Mexico
- 5.5.2 South America
- 5.5.2.1 Brazil
- 5.5.2.2 Argentina
- 5.5.2.3 Rest of South America
- 5.5.3 Europe
- 5.5.3.1 Germany
- 5.5.3.2 United Kingdom
- 5.5.3.3 France
- 5.5.3.4 Italy
- 5.5.3.5 Spain
- 5.5.3.6 Rest of Europe
- 5.5.4 Asia-Pacific
- 5.5.4.1 China
- 5.5.4.2 Japan
- 5.5.4.3 India
- 5.5.4.4 South Korea
- 5.5.4.5 Australia
- 5.5.4.6 Rest of Asia-Pacific
- 5.5.5 Middle East and Africa
- 5.5.5.1 Middle East
- 5.5.5.1.1 Saudi Arabia
- 5.5.5.1.2 United Arab Emirates
- 5.5.5.1.3 Turkey
- 5.5.5.1.4 Rest of Middle East
- 5.5.5.2 Africa
- 5.5.5.2.1 South Africa
- 5.5.5.2.2 Egypt
- 5.5.5.2.3 Nigeria
- 5.5.5.2.4 Rest of Africa
- 5.5.5.1 Middle East
- 5.5.1 North America
6 COMPETITIVE LANDSCAPE
- 6.1 Market Concentration
- 6.2 Strategic Moves
- 6.3 Market Share Analysis
- 6.4 Company Profiles (includes Global Level Overview, Market Level Overview, Core Segments, Financials as available, Strategic Information, Market Rank/Share for key companies, Products and Services, and Recent Developments)
- 6.4.1 Crown Holdings Inc.
- 6.4.2 Silgan Holdings Inc.
- 6.4.3 Trivium Packaging
- 6.4.4 Toyo Seikan Group Holdings Ltd.
- 6.4.5 CANPACK S.A.
- 6.4.6 Sonoco Products Company
- 6.4.7 Ardagh Metal Packaging
- 6.4.8 Ball Corporation (Food Can Division)
- 6.4.9 Wells Can Company
- 6.4.10 Kian Joo Group
- 6.4.11 Visy Industries
- 6.4.12 Jamestrong Packaging
- 6.4.13 Colep Packaging
- 6.4.14 Aaron Packaging Inc.
- 6.4.15 CPMC Holdings Ltd.
- 6.4.16 Greif Inc.
- 6.4.17 Daeryuk Can Co. Ltd.
- 6.4.18 Huber Packaging Group
- 6.4.19 Crown Asia Pacific Holdings
- 6.4.20 HPM Packaging
7 MARKET OPPORTUNITIES AND FUTURE OUTLOOK
- 7.1 White-space and Unmet-need Assessment

 食品罐頭市場:機會、成長要素、產業趨勢分析及2026-2035年預測
 食品罐頭市場:2026-2032年全球市場預測(依材料、罐型、製造流程、罐頭形狀、封蓋類型、罐頭尺寸、產品類型、最終用戶和分銷管道分類)
 食品罐頭市場分析及預測(至2035年):類型、產品類型、材質類型、應用、技術、最終用戶、製程、功能、設備、解決方案
 2026年全球食品罐頭市場報告
 食品罐市場規模、佔有率和成長分析(按材料、罐型、蓋型、應用和地區分類)-2026-2033年產業預測2034年全球食品罐頭(不含飲料罐頭)市場機會與策略
 2030 年食品罐市場預測:按類型、材質、容量、蓋子類型、應用和地區進行的全球分析
 食品罐頭市場:未來預測(2025-2030年)
 亞非罐頭食品 -市場佔有率分析、行業趨勢和統計、成長預測(2025-2030 年)
 全球金屬食品市場,2024-2028