


 |
市場調查報告書
商品編碼
2124018
感測器:市場佔有率分析、行業趨勢和統計數據、成長預測(2026-2031 年)Sensors - Market Share Analysis, Industry Trends & Statistics, Growth Forecasts (2026 - 2031) |
||||||

※ 本網頁內容可能與最新版本有所差異。詳細情況請與我們聯繫。
根據 Mordor Intelligence 預測,感測器市場規模將從 2025 年的 2,443.1 億美元成長到 2026 年的 2,694.3 億美元,到 2031 年將達到 4,396.6 億美元,2026 年至 2031 年的複合年成長率為 10.29%。
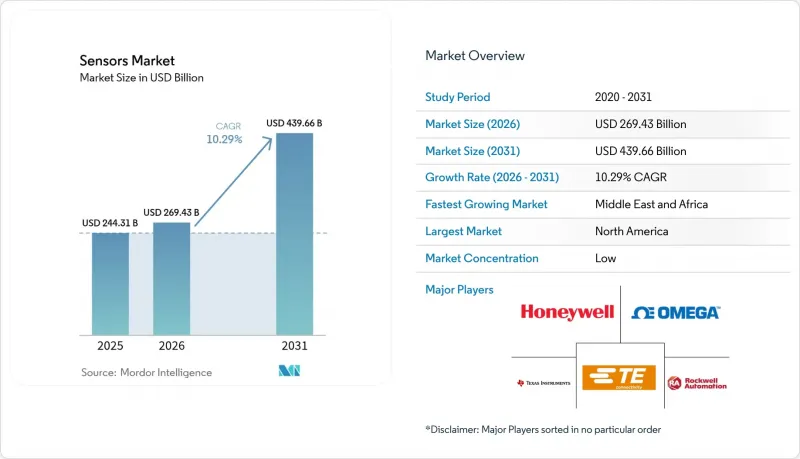
本報告按測量參數(溫度、流速等)、工作模式(光學、壓阻式、壓電等)、技術(MEMS、光子學等)、整合度(分立感測器、整合/嵌入式感測器)、輸出(類比、數位)、終端用戶產業(汽車、工業製造等)和地區進行細分。市場預測以美元計價。
全球感測器市場趨勢與洞察
多感測器融合技術在自動駕駛領域的應用日益廣泛
雷射雷達、雷達和攝影機的資料流現已整合到一個統一的感知堆疊中,確保冗餘性,從而滿足歐盟通用安全法規 2019/2144 對高級駕駛輔助系統 (ADAS) 的要求,適用於所有新車型。特斯拉的全自動駕駛電腦已能以 144 TOPS 的速度處理來自八個攝影機、十二個超音波感測器和一個雷達的輸入,樹立了性能標竿。一級供應商正積極回應,提供預校準的感知套件,從而降低整合成本、精簡材料清單(BOM) 並加快產品上市速度。
亞洲現有工廠向智慧工廠的維修正在迅速增加。
中國的「十四五」規劃撥款1.4兆美元用於數位基礎建設,其中大部分用於升級現有設備,加裝大量感測器,旨在實現預測性維護,並將設備使用壽命延長20%至30%。透過將安裝在現有生產線上的振動、溫度和流量測量設備的數據傳輸到雲端分析系統,無需重建整個工廠,即可減少停機時間,提高整體設備效率(OEE)。
汽車級MEMS代廠供應緊張
AEC-Q100認證週期最長可達兩年,亞太地區只有少數晶圓廠能夠達到這些嚴格的標準。義法半導體正在擴大其無塵面積,但電動車的普及帶來了新的壓力,對電池管理和熱監控提出了更高的要求。
細分市場分析
預計到2025年,溫度感測器將佔據感測器市場佔有率的22.74%,在汽車溫度控管迴路和工業製程控制中仍將發揮至關重要的作用。化學感測器是成長最快的,預計到2031年將以14.12%的複合年成長率成長,這主要得益於更嚴格的排放氣體監測和職場安全法規。流量、振動和壓力感測器透過拓展預測性維護的應用範圍,進一步擴大了感測器市場;而接近感測器則確保了對機器安全保護相關法規的合規性。
微型化技術的進步使得人工智慧引擎能夠整合到溫度感測器中,從而實現無需雲端延遲的本地異常檢測。目前,該產品系列涵蓋慣性感測器、磁性感測器、光學感測器和濕度感測器,可滿足從智慧型手機方向檢測到智慧城市空氣品質監測網路等廣泛的應用需求。
到2025年,電阻式感測器將佔感測器市場19.18%的佔有率,這主要得益於其低成本以及在工業和汽車儀錶板中的廣泛應用。雷射雷達系統是自動駕駛的關鍵技術,預計到2031年將以16.74%的複合年成長率成長,這反映了價格的下降以及向無需機械部件的固態陣列的轉變。光學、壓阻式、壓電式、電容壓電、磁性和聲學感測器涵蓋了多種應用,可滿足視覺、壓力、振動、觸覺和聲音等方面的需求。
Velodyne公司的4D雷射雷達等技術創新將速度向量與距離和角度相結合,提高了駕駛輔助功能中物體分類的精度。同時,壓電能源採集為安裝在遠端管道中的無電池感測器節點提供微焦耳的電能。
區域分析
到2025年,亞太地區將佔全球銷售額的36.21%。這主要得益於中國1.4兆美元的數位基礎建設、日本先進的汽車供應鏈以及韓國在微影術技術領域的領先地位。政府獎勵降低了晶圓廠和嵌入式感測器新創企業的資本門檻,促成了擁有集中設計和生產技術的區域叢集的形成。供應商正利用位置大多數消費性電子產品組裝線的優勢,縮短前置作業時間並降低物流成本。
在歐洲,受嚴格的安全和環保法規的推動,對高附加價值產品的需求仍然強勁。強制安裝高級駕駛輔助系統(ADAS)和工業脫碳目標正在推動對高性能、功能更安全產品的需求成長。歐盟「TIP法案」下的津貼以及歐洲投資銀行(EIB)的貸款,例如恩智浦半導體(NXP)獲得的10億歐元貸款,正在擴大國內汽車產能。
在中東和非洲地區,隨著波灣合作理事會(GCC)成員國推進智慧電網、海水淡化監測和大規模可再生能源部署,預計該地區的複合年成長率將達到14.58%。非洲的採礦和運輸走廊正擴大採用能夠承受灰塵、振動和電力不穩定的堅固耐用的感測器。在拉丁美洲,儘管規模仍然較小,但巴西和墨西哥正在進行智慧農業試點項目,需求正在逐步成長。
其他好處:
- Excel格式的市場預測(ME)表
- 3個月的分析師支持
目錄
第1章:引言
- 研究假設和市場定義
- 調查範圍
第2章:調查方法
第3章執行摘要
第4章 市場狀況
- 市場概覽
- 市場促進因素
- 在自動駕駛領域,多感測器融合技術的應用日益廣泛。
- 亞洲現有工廠向智慧工廠的維修正在迅速增加。
- 向海上能源領域基於狀態的資產監控轉型
- 歐盟下一代車輛必須強制安裝ADAS感測器系統。
- 用於無電池物聯網標籤的超低功耗環境感測
- 市場限制因素
- 汽車MEMS代工廠的產能正面臨壓力。
- 長壽命振動感測器的校準漂移挑戰
- 無線協定標準碎片化阻礙了智慧感測器的互通性。
- 價值和供應鏈分析
- 監管和技術展望
- 波特五力分析
- 軟性印刷感測器市場趨勢(現況與展望)
- 宏觀經濟和疫情影響評估
第5章 市場規模與成長預測
- 透過測量參數
- 溫度
- 流動
- 化學品
- 振動
- 壓力
- 鄰近性
- 慣性
- 其他參數
- 透過操作模式
- 光學
- 壓阻式
- 壓電
- 電阻
- 影像
- LiDAR
- 其他操作模式
- 透過技術
- MEMS
- 光子
- CMOS
- 電子機械系統(NEMS)
- 依整合程度
- 分立感測器
- 整合/嵌入式感測器
- 依輸出類型
- 模擬
- 數位的
- 按最終用戶行業分類
- 車
- 工業製造
- 醫療保健與健康
- 航太
- 家用電子產品
- 石油和天然氣
- 建造
- 防禦
- 按地區
- 北美洲
- 美國
- 加拿大
- 墨西哥
- 歐洲
- 英國
- 德國
- 法國
- 義大利
- 其他歐洲國家
- 亞太地區
- 中國
- 日本
- 印度
- 韓國
- 其他亞太國家
- 中東
- 以色列
- 沙烏地阿拉伯
- 阿拉伯聯合大公國
- 土耳其
- 其他中東國家
- 非洲
- 南非
- 埃及
- 其他非洲國家
- 南美洲
- 巴西
- 阿根廷
- 其他南美國家
- 北美洲
第6章 競爭情勢
- 市場集中度
- 策略趨勢
- 市佔率分析
- 公司簡介
- Honeywell International Inc.
- Bosch Sensortec GmbH
- Texas Instruments Inc.
- TE Connectivity Ltd
- Rockwell Automation Inc.
- OMEGA Engineering inc.
- STMicroelectronics NV
- Infineon Technologies AG
- NXP Semiconductors NV
- ams OSRAM AG
- Analog Devices Inc.
- Renesas Electronics Corp.
- Microchip Technology Inc.
- ROHM Semiconductor
- Omron Corp.
- ABB Ltd
- Sick AG
- Qualcomm Technologies Inc.
- Velodyne Lidar Inc.
- LeddarTech Inc.
- TDK Corp.
第7章 市場機會與未來展望
According to Mordor Intelligence, the sensors market size is expected to grow from USD 244.31 billion in 2025 to USD 269.43 billion in 2026 and is forecast to reach USD 439.66 billion by 2031 at 10.29% CAGR over 2026-2031.
This report is Segmented by Parameter Measured (Temperature, Flow and More), Mode of Operation (Optical, Piezoresistive, Piezoelectric, and More), Technology (MEMS, Photonic, and More), Integration Level (Discrete Sensors, Integrated/Embedded Sensors), Output (Analog, Digital), End-User Industry (Automotive, Industrial Manufacturing, and More), and Geography. The Market Forecasts are Provided in Terms of Value (USD).
Global Sensors Market Trends and Insights
Increasing adoption of multi-sensor fusion in autonomous mobility
LiDAR, radar, and camera streams are now integrated into unified perception stacks, creating redundancy that meets the EU General Safety Regulation 2019/2144 for advanced driver assistance in all new vehicles. Tesla's full self-driving computer already processes inputs from 8 cameras, 12 ultrasonic units, and a radar at 144 TOPS, setting a performance benchmark. Tier-1 suppliers are responding with pre-calibrated perception suites that lower integration cost, compress bill-of-materials, and accelerate time-to-market.
Proliferation of smart-factory retrofits in brown-field Asian plants
China's 14th Five-Year Plan earmarked USD 1.4 trillion for digital infrastructure, much of which targets sensor-rich upgrades of legacy machinery to unlock predictive maintenance and 20-30% lifecycle extensions. Vibration, temperature, and flow devices fitted to existing lines feed cloud analytics that cut downtime and lift overall equipment effectiveness without full plant reconstruction.
Supply tightness of automotive-grade MEMS foundry capacity
AEC-Q100 qualification cycles span up to two years and only a few Asia-Pacific fabs meet the stringent criteria. STMicroelectronics is expanding clean-room footprints, yet EV proliferation adds pressure by introducing fresh battery-management and thermal-monitoring loads.
Other drivers and restraints analyzed in the detailed report include:
- Shift toward condition-based asset monitoring in offshore energy
- Mandatory inclusion of ADAS sensing suites in next-gen EU vehicles
- Calibration drift challenges in long-life vibration sensors
For complete list of drivers and restraints, kindly check the Table Of Contents.
Segment Analysis
Temperature devices held 22.74% sensors market share in 2025 and remain indispensable for automotive thermal loops and industrial process control. Chemical variants are scaling fastest, on course for 14.12% CAGR through 2031 on rising emissions monitoring and workplace-safety mandates. Flow, vibration, and pressure categories together deepen the sensors market with predictive maintenance reach, while proximity units ensure machine-guarding compliance.
Continued miniaturization now allows integrated AI engines inside temperature elements, enabling local anomaly detection without cloud latency. Inertial, magnetic, optical, and humidity devices round out the portfolio, serving everything from smartphone orientation to smart-city air-quality grids.
Electrical-resistance designs accounted for 19.18% of the sensors market in 2025 thanks to low cost and broad design-in across industrial and vehicle dashboards. LiDAR systems, critical for autonomous navigation, are projected to rise at 16.74% CAGR through 2031, reflecting price drops and movement to solid-state arrays that shed mechanical parts. Optical, piezoresistive, piezoelectric, capacitive, magnetic, and acoustic modes complete a diverse field addressing vision, pressure, vibration, touch, and sound requirements.
Advances such as Velodyne's 4D LiDAR integrate velocity vectors with distance and angle, sharpening object classification for driver-assist functions. Meanwhile, piezoelectric harvesters supply micro-joule power budgets for battery-less sensor nodes in remote pipelines.
Complete Report Scope:
- By Parameter Measured
- Temperature
- Flow
- Chemical
- Vibration
- Pressure
- Proximity
- Inertial
- Other Parameters
- By Mode of Operation
- Optical
- Piezoresistive
- Piezoelectric
- Electrical Resistance
- Image
- LiDAR
- Other Modes
- By Technology
- MEMS
- Photonic
- CMOS
- Nano-electromechanical (NEMS)
- By Integration Level
- Discrete Sensors
- Integrated / Embedded Sensors
- By Output
- Analog
- Digital
- By End-user Industry
- Automotive
- Industrial Manufacturing
- Medical and Wellness
- Aerospace
- Consumer Electronics
- Oil and Gas
- Construction
- Defense
- By Geography
- North America
- United States
- Canada
- Mexico
- Europe
- United Kingdom
- Germany
- France
- Italy
- Rest of Europe
- Asia-Pacific
- China
- Japan
- India
- South Korea
- Rest of Asia-Pacific
- Middle East
- Israel
- Saudi Arabia
- United Arab Emirates
- Turkey
- Rest of Middle East
- Africa
- South Africa
- Egypt
- Rest of Africa
- South America
- Brazil
- Argentina
- Rest of South America
- North America
Geography Analysis
Asia-Pacific held 36.21% of global revenue in 2025, anchored by China's USD 1.4 trillion digital-infrastructure push, Japan's advanced automotive supply chains, and South Korea's lithography leadership. Government incentives lower capital hurdles for fabs and embedded-sensor startups alike, translating into a dense regional cluster of design and production know-how. Suppliers enjoy proximity to the bulk of consumer-electronics assembly lines, compressing lead times and logistics costs.
Europe delivers steady high-value demand around stringent safety and environmental regulations. Mandatory ADAS fitment and industrial decarbonization targets push purchasing toward higher-performance, functionally safe products. The EU's Chips Act grants and European Investment Bank loans such as NXP's EUR 1 billion facilities funnel fresh capacity into on-shore automotive-grade production.
Middle East & Africa is projected to expand at 14.58% CAGR as Gulf Cooperation Council states embed smart grids, desalination monitoring, and large-scale renewables. African mining and transport corridors increasingly deploy ruggedized sensors that tolerate dust, vibration, and power instability. Latin America, though smaller, sees smart-agriculture pilots across Brazil and Mexico, adding incremental volume.
- Honeywell International Inc.
- Bosch Sensortec GmbH
- Texas Instruments Inc.
- TE Connectivity Ltd
- Rockwell Automation Inc.
- OMEGA Engineering inc.
- STMicroelectronics N.V.
- Infineon Technologies AG
- NXP Semiconductors N.V.
- ams OSRAM AG
- Analog Devices Inc.
- Renesas Electronics Corp.
- Microchip Technology Inc.
- ROHM Semiconductor
- Omron Corp.
- ABB Ltd
- Sick AG
- Qualcomm Technologies Inc.
- Velodyne Lidar Inc.
- LeddarTech Inc.
- TDK Corp.
Additional Benefits:
- The market estimate (ME) sheet in Excel format
- 3 months of analyst support
TABLE OF CONTENTS
1 INTRODUCTION
- 1.1 Study Assumptions and Market Definition
- 1.2 Scope of the Study
2 RESEARCH METHODOLOGY
3 EXECUTIVE SUMMARY
4 MARKET LANDSCAPE
- 4.1 Market Overview
- 4.2 Market Drivers
- 4.2.1 Increasing adoption of multi-sensor fusion in autonomous mobility
- 4.2.2 Proliferation of smart-factory retrofits in brown-field Asian plants
- 4.2.3 Shift toward condition-based asset monitoring in offshore energy
- 4.2.4 Mandatory inclusion of ADAS sensing suites in next-gen EU vehicles
- 4.2.5 Ultra-low-power environmental sensing for battery-free IoT tags
- 4.3 Market Restraints
- 4.3.1 Supply tightness of automotive-grade MEMS foundry capacity
- 4.3.2 Calibration drift challenges in long-life vibration sensors
- 4.3.3 Fragmented wireless protocol standards hindering smart-sensor interoperability
- 4.4 Value and Supply-Chain Analysis
- 4.5 Regulatory and Technological Outlook
- 4.6 Porter's Five Forces Analysis
- 4.6.1 Bargaining Power of Suppliers
- 4.6.2 Bargaining Power of Buyers
- 4.6.3 Threat of New Entrants
- 4.6.4 Threat of Substitutes
- 4.6.5 Degree of Competition
- 4.7 Flexible and Printed Sensors Dynamics (current status, projections)
- 4.8 Macroeconomic and Pandemic Impact Assessment
5 MARKET SIZE AND GROWTH FORECASTS (VALUE)
- 5.1 By Parameter Measured
- 5.1.1 Temperature
- 5.1.2 Flow
- 5.1.3 Chemical
- 5.1.4 Vibration
- 5.1.5 Pressure
- 5.1.6 Proximity
- 5.1.7 Inertial
- 5.1.8 Other Parameters
- 5.2 By Mode of Operation
- 5.2.1 Optical
- 5.2.2 Piezoresistive
- 5.2.3 Piezoelectric
- 5.2.4 Electrical Resistance
- 5.2.5 Image
- 5.2.6 LiDAR
- 5.2.7 Other Modes
- 5.3 By Technology
- 5.3.1 MEMS
- 5.3.2 Photonic
- 5.3.3 CMOS
- 5.3.4 Nano-electromechanical (NEMS)
- 5.4 By Integration Level
- 5.4.1 Discrete Sensors
- 5.4.2 Integrated / Embedded Sensors
- 5.5 By Output
- 5.5.1 Analog
- 5.5.2 Digital
- 5.6 By End-user Industry
- 5.6.1 Automotive
- 5.6.2 Industrial Manufacturing
- 5.6.3 Medical and Wellness
- 5.6.4 Aerospace
- 5.6.5 Consumer Electronics
- 5.6.6 Oil and Gas
- 5.6.7 Construction
- 5.6.8 Defense
- 5.7 By Geography
- 5.7.1 North America
- 5.7.1.1 United States
- 5.7.1.2 Canada
- 5.7.1.3 Mexico
- 5.7.2 Europe
- 5.7.2.1 United Kingdom
- 5.7.2.2 Germany
- 5.7.2.3 France
- 5.7.2.4 Italy
- 5.7.2.5 Rest of Europe
- 5.7.3 Asia-Pacific
- 5.7.3.1 China
- 5.7.3.2 Japan
- 5.7.3.3 India
- 5.7.3.4 South Korea
- 5.7.3.5 Rest of Asia-Pacific
- 5.7.4 Middle East
- 5.7.4.1 Israel
- 5.7.4.2 Saudi Arabia
- 5.7.4.3 United Arab Emirates
- 5.7.4.4 Turkey
- 5.7.4.5 Rest of Middle East
- 5.7.5 Africa
- 5.7.5.1 South Africa
- 5.7.5.2 Egypt
- 5.7.5.3 Rest of Africa
- 5.7.6 South America
- 5.7.6.1 Brazil
- 5.7.6.2 Argentina
- 5.7.6.3 Rest of South America
- 5.7.1 North America
6 COMPETITIVE LANDSCAPE
- 6.1 Market Concentration
- 6.2 Strategic Moves
- 6.3 Market Share Analysis
- 6.4 Company Profiles (includes Global level Overview, Market level overview, Core Segments, Financials as available, Strategic Information, Market Rank/Share for key companies, Products and Services, and Recent Developments)
- 6.4.1 Honeywell International Inc.
- 6.4.2 Bosch Sensortec GmbH
- 6.4.3 Texas Instruments Inc.
- 6.4.4 TE Connectivity Ltd
- 6.4.5 Rockwell Automation Inc.
- 6.4.6 OMEGA Engineering inc.
- 6.4.7 STMicroelectronics N.V.
- 6.4.8 Infineon Technologies AG
- 6.4.9 NXP Semiconductors N.V.
- 6.4.10 ams OSRAM AG
- 6.4.11 Analog Devices Inc.
- 6.4.12 Renesas Electronics Corp.
- 6.4.13 Microchip Technology Inc.
- 6.4.14 ROHM Semiconductor
- 6.4.15 Omron Corp.
- 6.4.16 ABB Ltd
- 6.4.17 Sick AG
- 6.4.18 Qualcomm Technologies Inc.
- 6.4.19 Velodyne Lidar Inc.
- 6.4.20 LeddarTech Inc.
- 6.4.21 TDK Corp.
7 MARKET OPPORTUNITIES AND FUTURE OUTLOOK
- 7.1 White-space and Unmet-need Assessment

 AI封裝感測器市場:按技術、感測器類型、應用、材料、國家和地區分類-全球產業分析、市場規模、市場佔有率及2026年至2033年預測
 中國感測器市場:市場佔有率分析、產業趨勢與統計、成長預測(2026-2031)歐洲感測器:市場佔有率分析、行業趨勢和統計數據、成長預測(2026-2031 年)美洲感測器:市場佔有率分析、行業趨勢和統計數據、成長預測(2026-2031 年)壓電薄膜感測器市場報告:趨勢、預測和競爭分析(至2035年)
 MEMS和感測器材料市場預測至2034年—按材料類型、感測器類型、製造技術、應用和地區分類的全球分析航太感測器材料市場預測至2034年-全球分析(按材料類型、複合材料、功能特性、感測器技術、製造技術、航太平台、應用、最終用戶和地區分類)
 踢擊感測器市場規模、佔有率和成長分析:按感測器類型、應用、輸出類型、最終用戶、分銷管道和地區分類-2026-2033年產業預測
 薄膜感測器市場:2026-2032年全球市場預測(依產品類型、技術、基板類型、整合度及最終用途產業分類)大氣感測器市場:2026-2032年全球市場預測(按感測器類型、技術、安裝方式、應用和最終用戶分類)