


 |
市場調查報告書
商品編碼
2125651
美洲感測器:市場佔有率分析、行業趨勢和統計數據、成長預測(2026-2031 年)Americas Sensor - Market Share Analysis, Industry Trends & Statistics, Growth Forecasts (2026 - 2031) |
||||||

※ 本網頁內容可能與最新版本有所差異。詳細情況請與我們聯繫。
美國感測器市場預計將從 2025 年的 406 億美元成長到 2026 年的 432.4 億美元,到 2031 年將達到 581.7 億美元,2026 年至 2031 年的複合年成長率為 6.11%。
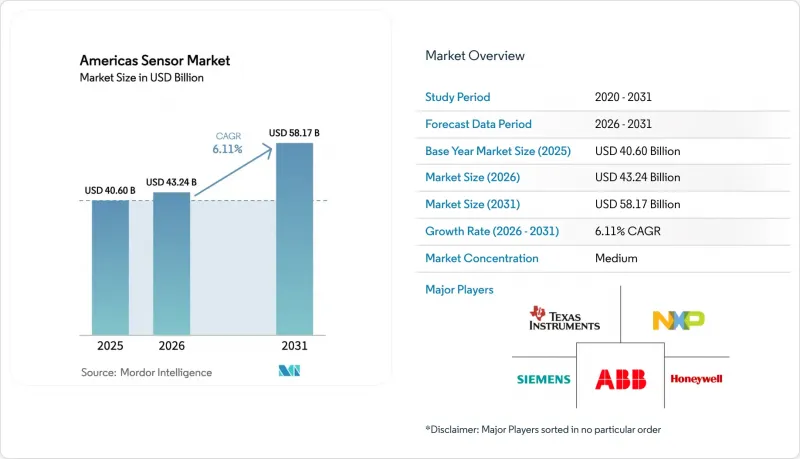
本報告按測量參數(溫度、壓力等)、工作模式(光學、電阻式、生物感測器等)、感測器技術(MEMS 和非 MEMS)、終端用戶產業(汽車、家用電子電器等)以及地區進行細分。市場預測以美元計價。
美國感測器市場的趨勢和洞察
消費性物聯網設備的快速普及
到2025年,北美地區的出貨量將達到12億台,溫度感測器、接近感測器和慣性感測器將整合到穿戴式裝置和智慧家居系統中。零售商對Matter協議的要求迫使供應商在MEMS封裝中預先安裝藍牙低功耗5.4和Thread無線電功能,從而減少了40%的外部組件數量。巴西國家電信和電信管理局(ANATEL)根據第715號決議簡化了認證流程,將本地產品上市週期縮短至三個月。這些監管方面的進步,加上對電池壽命超過五年的預期,使得超低功耗設計成為關鍵的採購標準。將Zigbee流量轉換為Matter流量的改裝閘道器預計將在2025年為市場帶來3.8億美元的銷售額,這反映了過渡性互通性帶來的機會。
製造業自動化投資增加
2024年,美國部署的工業機器人數量增加了12%,達到44,303台,力/扭力感測器、接近感測器和視覺感測器的運用,使得人機協作更加安全。在墨西哥,振動監測系統將意外停機時間減少了35%,促使每台機器人的感測器數量增加了28%。 80%的受訪製造商目前至少將五分之一的資本預算用於智慧工廠資產,感測器硬體在其優先列表中超過了軟體。巴西的「Rota 2030」獎勵計畫為配備感測器的機器提供加速折舊,鼓勵2015年之前建造的生產線維修。 2024年,美國將有244,940個工作機會回流,將進一步提振國內對感測器的需求。
對安全關鍵感測器進行嚴格的監管認證
2025年,FDA對II類及III類醫療設備的上市前核准平均耗時14個月。血糖值和血壓感測器需要在不同人群中達到±10%的精度。美國國家公路交通安全管理局(NHTSA)於2025年6月發布的一項命令強制要求提交涉及事故的高級駕駛輔助系統(ADAS)感測器的實際性能數據,這將使一級供應商的年度合規成本增加200萬至300萬美元。巴西國家衛生監督局(ANVISA)第822號決議強制要求即使在獲得FDA批准後也必須進行本地臨床試驗,這實際上使產品上市時間延長了一倍,並使巴西本土供應商佔據了18%的消費者健康穿戴裝置市場佔有率。美洲各地不同的法規迫使供應商維護多種產品變體和文檔,這增加了固定成本,並阻礙了小規模參與企業的市場准入。儘管存在區域貿易協定,但監管協調進展緩慢。
細分市場分析
隨著美國收緊顆粒物和臭氧標準並新增1200個連續監測站點,化學感測器預計將在2026年至2031年間以6.59%的複合年成長率實現最高成長。溫度測量儀器在2025年將占美國感測器市場佔有率的19.85%,對於暖通空調(HVAC)和冷鏈物流仍然至關重要,但目前正面臨價格下降和成長放緩的局面。壓力測量產品為頁岩氣開採提供支持,預計到2025年,二疊紀盆地將安裝8,500個地下壓力表。液位測量儀器則為每日處理總合180億加侖的市政水質淨化廠提供支援。
一次性生物反應器中的流量測量技術隨著一次性熱式質量流量感測器的應用而取得進步,檢驗週期已縮短至三天。接近感測器滿足了大批量需求,使亞馬遜設施中75萬台移動機器人運作。慣性模組、磁感測器、振動感測器和環境探測器正在滿足從智慧型手機到預測性維護解決方案等各種小眾但不斷擴展的應用場景,凸顯了美國感測器市場的廣闊前景。
2025年,光學感測技術佔銷售額的23.43%,其應用範圍涵蓋智慧型手機光電二極體到橋樑光纖應變計等。隨著無人駕駛計程車的普及,美洲感測器市場(包括LiDAR)預計將以6.96%的複合年成長率成長,Waymo已獲准在德克薩斯州新增200輛無人駕駛計程車。電阻元件仍是工業溫度迴路的核心零件,預計2025年出貨量將達到1,200萬台。在生物感測器領域,隨著雅培公司的連續酮體監測儀於2025年8月獲得FDA批准,其應用範圍進一步擴大。
壓電汽車歧管感測器、堆疊式CMOS影像感測器、電容式觸控控制器、壓電超音波元件和雷達積體電路支援從資訊娛樂到主動式車距維持定速系統等廣泛的應用,從而豐富了美國的感測器市場。這些工作模式協同工作,形成了一個功能全面的工具包,服務於消費性電子、工業和移動出行生態系統。
其他好處:
- Excel格式的市場預測(ME)表
- 3個月的分析師支持
目錄
第1章:引言
- 研究假設和市場定義
- 調查範圍
第2章:調查方法
第3章執行摘要
第4章 市場狀況
- 市場概覽
- 市場促進因素
- 消費性物聯網設備的快速普及
- 美洲製造業自動化投資增加
- 政府對智慧基礎設施維修的支持措施
- 電動車和自動駕駛汽車的激增需要多感測器套件
- 低功耗邊緣人工智慧的出現,使得在感測器上進行分析成為可能。
- 為實現ESG目標,對可生物分解生態感測器的需求日益成長
- 市場限制因素
- 對安全關鍵感測器進行嚴格的監管認證
- 對MEMS生產線的大量資本投資
- 特種材料(氮化鎵、碳化矽)供應鏈集中化
- 與感測器資料完整性相關的網路安全責任
- 產業價值鏈分析
- 監理情勢
- 技術展望
- 波特五力分析
- 宏觀經濟因素對市場的影響
第5章 市場規模與成長預測
- 透過測量參數
- 溫度
- 壓力
- 等級
- 流動
- 鄰近性
- 環境
- 化學品
- 慣性
- 磁性
- 振動
- 其他測量參數
- 透過操作模式
- 光學
- 電阻
- 生物感測器
- 壓阻式
- 影像
- 電容式
- 壓電
- LiDAR
- 雷達
- 其他營運形式
- 感測器技術
- MEMS感測器
- 非MEMS感測器
- 按最終用戶行業分類
- 車
- 家用電子產品
- 智慧型手機
- 平板電腦、筆記型電腦和電腦
- 穿戴式裝置
- 智慧家庭設備
- 其他家用電子電器
- 能源公用事業
- 工業自動化
- 醫療保健與健康
- 建築業、農業、礦業
- 航太
- 國防與安全
- 按地區
- 北美洲
- 美國
- 加拿大
- 南美洲
- 巴西
- 墨西哥
- 阿根廷
- 智利
- 其他南美國家
- 北美洲
第6章 競爭情勢
- 市場集中度
- 策略趨勢
- 市佔率分析
- 公司簡介
- Texas Instruments Incorporated
- TE Connectivity Ltd.
- Omega Engineering Inc.
- Honeywell International Inc.
- Rockwell Automation Inc.
- Siemens AG
- ams-OSRAM AG
- NXP Semiconductors NV
- Infineon Technologies AG
- Bosch Sensortec GmbH
- SICK AG
- ABB Ltd.
- OMRON Corporation
- STMicroelectronics NV
- Analog Devices, Inc.
- Microchip Technology Inc.
- Sensata Technologies Holding plc
- Murata Manufacturing Co., Ltd.
- Panasonic Holdings Corporation
- Qualcomm Incorporated
第7章 市場機會與未來展望
According to Mordor Intelligence, the Americas sensor market size is expected to grow from USD 40.60 billion in 2025 to USD 43.24 billion in 2026 and is forecast to reach USD 58.17 billion by 2031 at 6.11% CAGR over 2026-2031.
This report is Segmented by Parameter Measured (Temperature, Pressure, and More), Mode of Operation (Optical, Electrical Resistance, Biosensor, and More), Sensor Technology (MEMS, and Non-MEMS), End-User Industry (Automotive, Consumer Electronics, and More), and Geography. The Market Forecasts are Provided in Terms of Value (USD).
Americas Sensor Market Trends and Insights
Rapid Proliferation of Consumer IoT Devices
North American shipments reached 1.2 billion units in 2025, embedding temperature, proximity, and inertial components in wearables and home-automation systems. Retailer mandates around the Matter protocol are pushing vendors to preload Bluetooth Low Energy 5.4 and Thread radios inside MEMS packages, trimming external component counts by 40%. Brazil's ANATEL streamlined certification under Resolution 715, cutting local launch cycles to three months. These regulatory wins, paired with battery-life expectations beyond five years, are elevating ultra-low-power design to a core purchasing criterion. Retrofit gateways translating Zigbee traffic into Matter added USD 380 million in 2025 revenue, reflecting an interim interoperability opportunity.
Rising Automation Investments in Manufacturing
Industrial robot installations in the United States climbed 12% to 44,303 units during 2024, with force-torque, proximity, and vision sensors enabling safe human-robot collaboration. Sensor content per robot rose 28% in Mexico as vibration-monitoring systems cut unplanned downtime by 35%. Eighty percent of surveyed manufacturers now channel at least one-fifth of capital budgets into smart-factory assets where sensing hardware eclipses software on the priority list. Brazil's Rota 2030 incentives, offering accelerated depreciation for sensor-equipped machinery, fuel retrofits of pre-2015 production lines. The reshoring of 244,940 U.S. jobs during 2024 further brightens domestic sensor demand.
Stringent Regulatory Certification for Safety-Critical Sensors
FDA premarket approvals for Class II and III devices averaged 14 months in 2025, with glucose and pressure sensors requiring +-10% accuracy across diverse cohorts. NHTSA's June 2025 order mandates real-world performance data for any Advanced Driver Assistance System sensor tied to a crash, adding USD 2-3 million in annual compliance for tier-1 suppliers. Brazil's ANVISA Resolution 822 now obliges local trials even when FDA clearance exists, effectively doubling time-to-market and giving domestic vendors an 18% share in consumer wellness wearables. Divergent rules across the Americas force vendors to maintain multiple product variants and documentation sets, inflating fixed costs and deterring small entrants. Harmonization lags despite regional trade pacts.
Other drivers and restraints analyzed in the detailed report include:
- Government Incentives for Smart-Infrastructure Retrofits
- Expansion Of Electric and Autonomous Vehicles
- High Capital Expenditure for MEMS Fabrication Lines
For complete list of drivers and restraints, kindly check the Table Of Contents.
Segment Analysis
Chemical devices are set for the fastest 6.59% CAGR during 2026-2031 as the United States enforces tighter particulate-matter and ozone standards, adding 1,200 continuous-monitoring sites. Temperature units, which held 19.85% of the Americas sensor market share in 2025, remain pivotal in HVAC and cold-chain logistics yet face price erosion that is moderating growth. Pressure products underpin shale extraction, with 8,500 downhole gauges deployed in the Permian Basin in 2025. Level instrumentation supports municipal water plants that collectively oversee 18 billion gallons daily.
Flow sensing in single-use bioreactors advanced when a disposable thermal mass-flow sensor cut validation cycles to three days. Proximity sensors enable 750,000 mobile robots in Amazon facilities, sustaining high-volume demand. Inertial modules, magnetics, vibration, and environmental detectors each address niche but expanding use cases from smartphones to predictive-maintenance suites, underscoring the broad terrain of the Americas sensor market.
Optical sensing kept a 23.43% revenue slice in 2025, spanning photodiodes for smartphones and fiber-optic strain gauges on bridges. The Americas sensor market size attached to LiDAR is projected to rise at 6.96% CAGR on the heels of robotaxi scaling, with Waymo cleared to add 200 vehicles in Texas. Electrical resistance elements continue to anchor industrial temperature loops, shipping 12 million units in 2025. Biosensors broadened horizons when Abbott's continuous ketone monitor secured FDA clearance in August 2025.
Piezoresistive automotive manifold sensors, stacked CMOS image sensors, capacitive touch controllers, piezoelectric ultrasound elements, and radar ICs together provide depth to the Americas sensor market, supporting applications from infotainment to adaptive cruise control. Collectively, these operational modes frame a versatile toolkit serving consumer, industrial, and mobility ecosystems.
Complete Report Scope:
- By Parameter Measured
- Temperature
- Pressure
- Level
- Flow
- Proximity
- Environmental
- Chemical
- Inertial
- Magnetic
- Vibration
- Other Parameter Measured
- By Mode of Operation
- Optical
- Electrical Resistance
- Biosensor
- Piezoresistive
- Image
- Capacitive
- Piezoelectric
- LiDAR
- Radar
- Other Mode of Operation
- By Sensor Technology
- MEMS Sensors
- Non-MEMS Sensors
- By End-User Industry
- Automotive
- Consumer Electronics
- Smartphones
- Tablets, Laptops and Computers
- Wearable Devices
- Smart Appliances
- Other Consumer Electronics
- Energy and Utilities
- Industrial Automation
- Medical and Wellness
- Construction, Agriculture and Mining
- Aerospace
- Defense and Security
- By Geography
- North America
- United States
- Canada
- South America
- Brazil
- Mexico
- Argentina
- Chile
- Rest of South America
- North America
List of Companies Covered in this Report:
- Texas Instruments Incorporated
- TE Connectivity Ltd.
- Omega Engineering Inc.
- Honeywell International Inc.
- Rockwell Automation Inc.
- Siemens AG
- ams-OSRAM AG
- NXP Semiconductors N.V.
- Infineon Technologies AG
- Bosch Sensortec GmbH
- SICK AG
- ABB Ltd.
- OMRON Corporation
- STMicroelectronics N.V.
- Analog Devices, Inc.
- Microchip Technology Inc.
- Sensata Technologies Holding plc
- Murata Manufacturing Co., Ltd.
- Panasonic Holdings Corporation
- Qualcomm Incorporated
Additional Benefits:
- The market estimate (ME) sheet in Excel format
- 3 months of analyst support
TABLE OF CONTENTS
1 INTRODUCTION
- 1.1 Study Assumptions and Market Definition
- 1.2 Scope of the Study
2 RESEARCH METHODOLOGY
3 EXECUTIVE SUMMARY
4 MARKET LANDSCAPE
- 4.1 Market Overview
- 4.2 Market Drivers
- 4.2.1 Rapid Proliferation of Consumer IoT Devices
- 4.2.2 Rising Automation Investments in North and South American Manufacturing
- 4.2.3 Government Incentives for Smart-Infrastructure Retrofits
- 4.2.4 Expansion of Electric and Autonomous Vehicles Requiring Multi-Sensor Suites
- 4.2.5 Emergence of Low-Power Edge AI Enabling On-Sensor Analytics
- 4.2.6 Growing Demand for Biodegradable Eco-Sensors to Meet ESG Targets
- 4.3 Market Restraints
- 4.3.1 Stringent Regulatory Certification for Safety-Critical Sensors
- 4.3.2 High Capital Expenditure for MEMS Fabrication Lines
- 4.3.3 Supply-Chain Concentration in Exotic Materials (GaN, SiC)
- 4.3.4 Cyber-Security Liabilities Tied to Sensor Data Integrity
- 4.4 Industry Value-Chain Analysis
- 4.5 Regulatory Landscape
- 4.6 Technological Outlook
- 4.7 Porter's Five Forces Analysis
- 4.7.1 Bargaining Power of Suppliers
- 4.7.2 Bargaining Power of Consumers
- 4.7.3 Threat of New Entrants
- 4.7.4 Threat of Substitute Products
- 4.7.5 Intensity of Competitive Rivalry
- 4.8 Impact of Macroeconomic Factors on the Market
5 MARKET SIZE AND GROWTH FORECASTS (VALUE)
- 5.1 By Parameter Measured
- 5.1.1 Temperature
- 5.1.2 Pressure
- 5.1.3 Level
- 5.1.4 Flow
- 5.1.5 Proximity
- 5.1.6 Environmental
- 5.1.7 Chemical
- 5.1.8 Inertial
- 5.1.9 Magnetic
- 5.1.10 Vibration
- 5.1.11 Other Parameter Measured
- 5.2 By Mode of Operation
- 5.2.1 Optical
- 5.2.2 Electrical Resistance
- 5.2.3 Biosensor
- 5.2.4 Piezoresistive
- 5.2.5 Image
- 5.2.6 Capacitive
- 5.2.7 Piezoelectric
- 5.2.8 LiDAR
- 5.2.9 Radar
- 5.2.10 Other Mode of Operation
- 5.3 By Sensor Technology
- 5.3.1 MEMS Sensors
- 5.3.2 Non-MEMS Sensors
- 5.4 By End-User Industry
- 5.4.1 Automotive
- 5.4.2 Consumer Electronics
- 5.4.2.1 Smartphones
- 5.4.2.2 Tablets, Laptops and Computers
- 5.4.2.3 Wearable Devices
- 5.4.2.4 Smart Appliances
- 5.4.2.5 Other Consumer Electronics
- 5.4.3 Energy and Utilities
- 5.4.4 Industrial Automation
- 5.4.5 Medical and Wellness
- 5.4.6 Construction, Agriculture and Mining
- 5.4.7 Aerospace
- 5.4.8 Defense and Security
- 5.5 By Geography
- 5.5.1 North America
- 5.5.1.1 United States
- 5.5.1.2 Canada
- 5.5.2 South America
- 5.5.2.1 Brazil
- 5.5.2.2 Mexico
- 5.5.2.3 Argentina
- 5.5.2.4 Chile
- 5.5.2.5 Rest of South America
- 5.5.1 North America
6 COMPETITIVE LANDSCAPE
- 6.1 Market Concentration
- 6.2 Strategic Moves
- 6.3 Market Share Analysis
- 6.4 Company Profiles (includes Global Level Overview, Market Level Overview, Core Segments, Financials as available, Strategic Information, Market Rank/Share, Products and Services, Recent Developments)
- 6.4.1 Texas Instruments Incorporated
- 6.4.2 TE Connectivity Ltd.
- 6.4.3 Omega Engineering Inc.
- 6.4.4 Honeywell International Inc.
- 6.4.5 Rockwell Automation Inc.
- 6.4.6 Siemens AG
- 6.4.7 ams-OSRAM AG
- 6.4.8 NXP Semiconductors N.V.
- 6.4.9 Infineon Technologies AG
- 6.4.10 Bosch Sensortec GmbH
- 6.4.11 SICK AG
- 6.4.12 ABB Ltd.
- 6.4.13 OMRON Corporation
- 6.4.14 STMicroelectronics N.V.
- 6.4.15 Analog Devices, Inc.
- 6.4.16 Microchip Technology Inc.
- 6.4.17 Sensata Technologies Holding plc
- 6.4.18 Murata Manufacturing Co., Ltd.
- 6.4.19 Panasonic Holdings Corporation
- 6.4.20 Qualcomm Incorporated
7 MARKET OPPORTUNITIES AND FUTURE OUTLOOK
- 7.1 White-Space and Unmet-Need Assessment

 AI封裝感測器市場:按技術、感測器類型、應用、材料、國家和地區分類-全球產業分析、市場規模、市場佔有率及2026年至2033年預測
 中國感測器市場:市場佔有率分析、產業趨勢與統計、成長預測(2026-2031)歐洲感測器:市場佔有率分析、行業趨勢和統計數據、成長預測(2026-2031 年)壓電薄膜感測器市場報告:趨勢、預測和競爭分析(至2035年)感測器:市場佔有率分析、行業趨勢和統計數據、成長預測(2026-2031 年)
 MEMS和感測器材料市場預測至2034年—按材料類型、感測器類型、製造技術、應用和地區分類的全球分析航太感測器材料市場預測至2034年-全球分析(按材料類型、複合材料、功能特性、感測器技術、製造技術、航太平台、應用、最終用戶和地區分類)
 踢擊感測器市場規模、佔有率和成長分析:按感測器類型、應用、輸出類型、最終用戶、分銷管道和地區分類-2026-2033年產業預測
 薄膜感測器市場:2026-2032年全球市場預測(依產品類型、技術、基板類型、整合度及最終用途產業分類)大氣感測器市場:2026-2032年全球市場預測(按感測器類型、技術、安裝方式、應用和最終用戶分類)