


 |
市場調查報告書
商品編碼
2123774
太陽能追蹤器:市場佔有率分析、行業趨勢和統計數據、成長預測(2026-2031)Solar Tracker - Market Share Analysis, Industry Trends & Statistics, Growth Forecasts (2026 - 2031) |
||||||

※ 本網頁內容可能與最新版本有所差異。詳細情況請與我們聯繫。
預計到 2026 年,太陽能追蹤器市場價值將達到 733.5 億美元,預計在預測期(2026-2031 年)內將以 21.46% 的複合年成長率成長,到 2031 年將達到 1938.9 億美元。
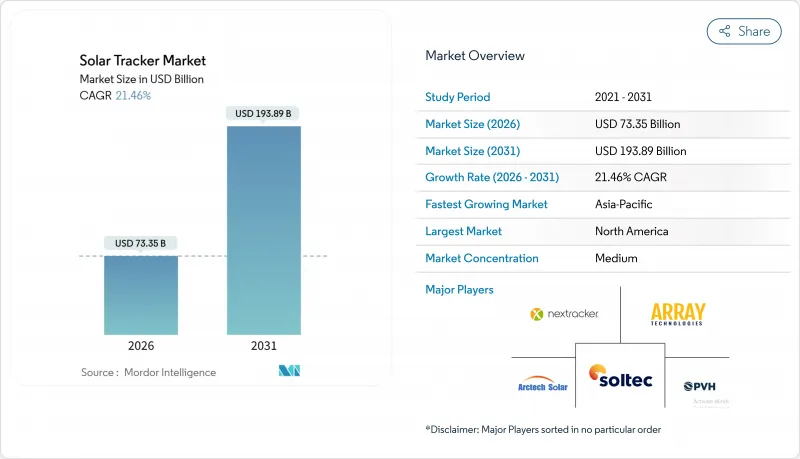
本報告按軸類型(單軸和雙軸)、技術(光伏、聚光型太陽光電、聚光型太陽光電)、驅動系統(馬達、線性致動器、液壓)、應用(公用事業規模、商業和工業、住宅和微電網、農業光伏)以及地區(北美、歐洲、亞太地區、南美、中東和非洲)進行分類。
全球太陽能追蹤器市場趨勢與洞察
受美國《通貨膨脹控制法案》(IRA)支持的公用事業規模購電協議(PPA)正在促成多重成長追蹤合約的實施。
高達10個百分點的國內採購獎勵稅收稅額扣抵加速了供應鏈的重組。 NEXTracker和Array Technologies已成功實現Nucor和SDI 100%美國採購,並擴大了在新墨西哥州和加州的工廠,從而使國內訂單年增40%。進口鋼材的前置作業時間曾長達9個月,如今已縮短至10週,使開發商能夠更早利用稅收股權。 45倍的先進製造業稅額扣抵進一步增強了對鋼材的補貼,即使熱軋鋼卷的平均價格為每噸750美元,也能降低每瓦交付。所有這些機制共同推動了吉瓦級購電協議(PPA)的激增,使追蹤器能夠整合到專案的核心設計中,而不僅僅是作為可選方案。
透過印度和中東及北非地區的 1P 模組化設計,降低追蹤器資本支出(CapEx)/MW。
一家採用單排1P架構的印度開發商,透過減少鋼材用量和基礎工程,將每兆瓦的資本支出降低了15-20%,並在太陽能公司(Solar Energy Corporation)的競標中成功中標,創下競標最低價。沙烏地阿拉伯的NEOM計畫和阿拉伯聯合大公國的第五期計畫也體現了這一轉變,並指出這種架構提高了在崎嶇沙漠地形中的施工速度。每排都配備獨立的執行器,從而提高了故障隔離能力,並減少了維運(O&M)所需的現場巡檢次數。這在沙漠地區尤其重要,因為沙漠工人需要跋涉200多公里才能到達現場。這種模組化模式在勞動人事費用低於進口鋼材成本的地區尤其具有吸引力,建造商可以透過增加排數來降低每瓦的硬體成本。
北美結構鋼價格上漲及232條款關稅
2024年至2025年間,熱軋鋼卷的平均價格為每噸700至800美元,比疫情前水準高出約40%。同時,對進口鋼材徵收25%的關稅使Array Technologies公司的追蹤業務毛利率下降了320個基點。根據《美國聯邦稅收法典》第232條提出的豁免申請可能需要長達九個月的時間,這可能會延誤採購並導致電力購買協議(PPA)下的罰款。小規模供應商退出北美市場,導致市場佔有率集中在擁有自有鋼廠穩定供應鏈的垂直整合型公司手中。
細分市場分析
儘管雙軸追蹤器的數量預計將以22.5%的複合年成長率成長,但即使到2025年,單軸追蹤器預計仍將佔總出貨量的52.7%。單軸太陽能追蹤器的市場佔有率得益於其久經考驗的可靠性、每排僅需一台馬達的簡單設計以及易於資金籌措等優勢,這些優勢使其在近期美國公用事業建設項目中幾乎得到普遍採用。然而,在智利阿塔卡馬沙漠和澳洲皮爾巴拉等地區,由於土地和太陽輻射條件提高了能量密度,開發商願意接受高出30%至40%的硬體成本,以換取25%至35%的發電量成長。
在與儲能系統結合的專案中,隨著日照時間延長,電池充放電循環次數減少,雙軸系統的溢價優勢更凸顯。 AllEarth Renewables 和 Deger Energie 正在商業和工業 (C&I) 屋頂市場開闢一個獨特的細分領域,在該市場中,安裝面積限制比資本支出 (CAPEX) 更為重要。雖然鋰離子電池成本的下降可能會減緩雙軸追蹤系統在廣袤土地上的普及,但這項技術的緊湊性將確保其在鐵路沿線、港口和島嶼微電網太陽能追日系統市場進一步成長。
晶體矽成本的降低和貸款機構信心的增強,使得太陽能追蹤器在2025年將佔太陽能發電裝置總量的85.5%。雖然目前集中式光伏(CPV)追蹤器僅佔總量的一小部分,但隨著海水淡化廠和礦山為降低土地購置成本而追求40%至47%的組件效率,其市場佔有率正以26.6%的複合年成長率快速成長。智利Soytec公司的系統和澳洲Insolite公司的陣列已證明CPV在無塵環境下的可行性,但由於需要保持雙軸追蹤器的精度並清潔光學元件,其營運成本仍然很高。
主流光伏追蹤器由於易於與雙面光伏板整合且無需主動冷卻,仍然佔據太陽能追蹤器市場的最大佔有率。聚光太陽能發電(CSP)追蹤器主要集中在摩洛哥和阿拉伯聯合大公國,這些國家利用儲熱技術來滿足夜間用電需求。除非聚光光電發電能夠降低系統總成本並展現出25年的使用壽命,否則它很可能仍將扮演專業附加設備的角色,而非大眾市場的有力競爭者。
區域分析
預計到2025年,北美市場佔有率將達到73.0%,這清楚地表明了《通膨控制法案》(IRA)帶來的利多。 NextEra Energy和AES等電力公司已簽署了數吉瓦級追蹤器訂購契約,要求在國內採購,並從紐柯公司採購鋼材,從美國供應商採購電機,以獲得額外稅收抵免。然而,根據《232條款》徵收的關稅以及每噸750美元的熱軋鋼卷價格正在威脅中小型工程總承包(EPC)公司的利潤率,推動產業整合。在加拿大,各省發布的「儲能+太陽能發電」計畫提案書(RFP)進展緩慢;而在墨西哥,加工出口區的產能正被用於規避關稅。
亞太地區複合年成長率最高,達27.9%。在印度總額達50吉瓦的競標中,單相模組化追蹤器因其可降低15-20%的資本支出而備受青睞。由於澳洲的電網組建法規,雙軸追蹤器正在西唐斯和萬端南電站部署,透過延長發電時間來提高電池往返效率。中國出口商在東南亞市場佔據主導地位,但在日本和澳大利亞,由於IEC-62817標準的限制,面臨融資合格的障礙。
在歐洲,由於「REPowerEU」計劃,太陽能發電的普及速度正在加快。德國對農業太陽能發電的優惠上網電價、法國批准的1.2吉瓦項目以及西班牙部署雙面追蹤器的計劃,都為太陽能發電的成長奠定了基礎。同時,由於凍脹風險,北歐國家的太陽能發電裝置速度放緩。在中東,NEOM和杜拜五期計畫正在使用單相追蹤器來加快沙漠地區的建設;在南非的儲能掛鉤競標中,雙軸精密追蹤器更受青睞。在撒哈拉以南非洲,由於維運人員和工程師短缺,太陽能發電的進展較為緩慢;而在拉丁美洲,需求主要集中在智利的阿塔卡馬地區和巴西東北部。這些地區擁有充足的陽光和較低的土地成本,使得資金籌措更加可靠。
其他好處:
- Excel格式的市場預測(ME)表
- 3個月的分析師支持
目錄
第1章:引言
- 研究假設和市場定義
- 調查範圍
第2章:調查方法
第3章執行摘要
第4章 市場狀況
- 市場促進因素
- 受美國《通貨膨脹控制法案》(IRA) 的支持,公用事業規模的購電協議 (PPA) 正在促成多成長追蹤合約的實施。
- 由於印度和中東及北非(MENA)地區採用1P模組化設計,每兆瓦追蹤器的資本投資減少。
- 在高反照率地區(阿塔卡馬沙漠、北歐國家),針對雙面接收最佳化的追蹤器可提高 IRR。
- 美國雲端運算和礦業公司全天候積極採購可再生能源。
- 歐盟的REPower計劃加速了Agrivoltikes的發展——用於農田的超薄低矮型追蹤器
- 在澳大利亞,併網儲能專案正在推動雙軸系統的應用。
- 市場限制因素
- 北美結構鋼價格上漲及232條款關稅
- 在易受凍脹影響的地區,例如北歐和阿爾卑斯山區的公用事業農場,追蹤器有故障風險。
- 撒哈拉以南非洲地區分散式執行器熟練維護和操作 (O&M) 人員短缺
- 對未參加IEC 62817考試的中國新參與企業獲得融資合格表示擔憂。
- 供應鏈分析
- 監理展望
- 技術展望
- 波特五力模型
第5章 市場規模與成長預測
- 按軸類型
- 單軸
- 雙軸
- 透過技術
- 太陽能發電(PV)
- 聚光型太陽熱能發電(CSP)
- 聚光型太陽光電(CPV)
- 透過使用
- 公用事業規模
- 商業和工業用途
- 住宅及微電網
- 農業光電/農業太陽能
- 透過驅動系統
- 電動機
- 線性致動器
- 油壓
- 按地區
- 北美洲
- 美國
- 加拿大
- 墨西哥
- 歐洲
- 英國
- 德國
- 法國
- 西班牙
- 北歐國家
- 俄羅斯
- 其他歐洲國家
- 亞太地區
- 中國
- 印度
- 日本
- 韓國
- 馬來西亞
- 泰國
- 印尼
- 越南
- 澳洲
- 其他亞太國家
- 南美洲
- 巴西
- 阿根廷
- 哥倫比亞
- 其他南美國家
- 中東和非洲
- 阿拉伯聯合大公國
- 沙烏地阿拉伯
- 南非
- 埃及
- 其他中東和非洲國家
- 北美洲
第6章 競爭情勢
- 市場集中度
- 策略趨勢(併購、聯盟、購電協議)
- 市場佔有率分析(主要公司的市場排名和市場佔有率)
- 公司簡介
- NEXTracker Inc.
- Array Technologies Inc.
- Arctech Solar Holdings Co. Ltd.
- Soltec Power Holdings SA
- PV Hardware Solutions SLU
- Valmont Industries Inc.(Convert Italia)
- Trina Solar Co. Ltd.(TrinaTracker)
- GameChange Solar
- Ideematec Deutschland GmbH
- Meca Solar
- STI Norland
- Antai Solar
- SunPower Corporation
- FTC Solar
- Abengoa Solar SA
- AllEarth Renewables
- Deger energie GmbH
- Mahindra Susten
- Solar FlexRack
- Convert Italia SpA
第7章 市場機會與未來展望
According to Mordor Intelligence, the solar tracker market size is estimated at USD 73.35 billion in 2026, and is expected to reach USD 193.89 billion by 2031, at a CAGR of 21.46% during the forecast period (2026-2031).
This report is Segmented by Axis Type (Single Axis and Dual Axis), Technology (Photovoltaic, Concentrated Solar Power, and Concentrated Photovoltaic), Drive Type (Electric Motor, Linear Actuator, and Hydraulic), Application (Utility-Scale, Commercial and Industrial, Residential and Micro-Grid, and Agrivoltaics), and Geography (North America, Europe, Asia-Pacific, South America, and Middle East and Africa).
Global Solar Tracker Market Trends and Insights
U.S. IRA-Fueled Utility-Scale PPAs Unlocking Multi-GW Tracker Contracts
Domestic-content bonus credits worth up to 10 percentage points on the investment tax credit have redrawn supply chains. NEXTracker and Array Technologies achieved 100% U.S. content by sourcing steel from Nucor and SDI and expanding New Mexico and California plants, lifting domestic orders 40% year over year. Lead times that once stretched nine months for imported steel now compress to ten weeks, letting developers monetize tax equity sooner. The 45X advanced-manufacturing credit further subsidizes steel inputs, lowering delivered cost per watt even as hot-rolled coil averages USD 750 per ton. Together, these mechanisms underpin a multi-gigawatt PPA wave that locks trackers into baseline project design rather than optional scope.
Diminishing Tracker CapEx/MW via 1P Modular Designs in India & MENA
Indian developers adopting single-row 1P architectures trimmed capital outlay 15%-20% per megawatt by reducing steel tonnage and foundation work, helping them clear record-low Solar Energy Corporation auction tariffs. Saudi Arabia's NEOM and the UAE's Phase V projects mirror the shift, citing faster erection on variable desert terrain. Because each row has its own actuator, fault isolation improves, and O&M visits fall, a key benefit where desert crews travel over 200 km to the site. The modular model is especially attractive in regions where labor is inexpensive relative to imported steel, letting builders trade higher row counts for lower per-watt hardware spend.
Elevated Structural Steel Prices & Section 232 Tariffs in North America
Hot-rolled coil averaged USD 700-800 per ton during 2024-2025, about 40% above pre-pandemic norms, while 25% tariffs on imported steel squeezed tracker gross margins by 320 basis points for Array Technologies. Section 232 exemption requests can take nine months, delaying procurement and triggering PPA penalties. Smaller suppliers exited North America, consolidating share among vertically integrated players with captive mill supply.
Other drivers and restraints analyzed in the detailed report include:
- Bifacial-Optimized Trackers Raising IRR in High-Albedo Regions
- Aggressive 24/7 Renewable Procurement by U.S. Cloud & Mining Firms
- Tracker Failure Risk on Frost-Heave Sites-Nordic & Alpine Utility Farms
For complete list of drivers and restraints, kindly check the Table Of Contents.
Segment Analysis
Dual-axis installations are forecast to expand at a 22.5% CAGR, while single-axis installations retained 52.7% of shipments in 2025. The solar tracker market share for single-axis designs is anchored by proven reliability, one-motor-per-row simplicity, and financing familiarity, features that delivered near-ubiquity in recent U.S. utility builds. Yet developers in Chile's Atacama and Australia's Pilbara accept 30%-40% higher hardware cost in exchange for 25%-35% more generation, where land and irradiance conditions reward energy density.
The dual-axis premium gains additional appeal in storage-paired projects because longer daylight capture reduces battery cycling depth. AllEarth Renewables and Deger Energie have carved niches on C&I rooftops where footprint limits trump capex. Looking forward, falling lithium-ion costs may temper dual-axis adoption in land-abundant geographies, but in rail-side, port, and island microgrids, the technology's compactness is likely to secure incremental solar tracker market growth.
Photovoltaic trackers commanded 85.5% of 2025 deployments thanks to crystalline-silicon cost declines and lender comfort. CPV trackers, while only a sliver today, are scaling at 26.6% CAGR as desalination plants and mines pursue 40%-47% module efficiency that shrinks land take. Soitec systems in Chile and Insolight arrays in Australia proved CPV viability in dust-controlled sites, though dual-axis precision and optical cleaning needs keep opex high.
Mainstream PV trackers retain the largest slice of the solar tracker market size because they integrate easily with bifacial panels and need no active cooling. CSP trackers remain concentrated in Morocco and the UAE, where thermal storage backs evening demand. Unless CPV reduces balance-of-system cost and shows 25-year durability, its role will remain a specialized add-on rather than a mass-market challenger.
Complete Report Scope:
- By Axis Type
- Single Axis
- Dual Axis
- By Technology
- Photovoltaic (PV)
- Concentrated Solar Power (CSP)
- Concentrated Photovoltaic (CPV)
- By Application
- Utility-Scale
- Commercial and Industrial
- Residential and Micro-grid
- Agrivoltaics/Agri-solar
- By Drive Type
- Electric Motor
- Linear Actuator
- Hydraulic
- By Geography
- North America
- United States
- Canada
- Mexico
- Europe
- United Kingdom
- Germany
- France
- Spain
- Nordic Countries
- Russia
- Rest of Europe
- Asia-Pacific
- China
- India
- Japan
- South Korea
- Malaysia
- Thailand
- Indonesia
- Vietnam
- Australia
- Rest of Asia-Pacific
- South America
- Brazil
- Argentina
- Colombia
- Rest of South America
- Middle East and Africa
- United Arab Emirates
- Saudi Arabia
- South Africa
- Egypt
- Rest of Middle East and Africa
- North America
Geography Analysis
North America's 73.0% 2025 share underscores IRA tailwinds. Utilities such as NextEra Energy and AES signed multi-gigawatt domestic-content tracker orders, locking in steel from Nucor and motors from U.S. suppliers to secure bonus credits. Section 232 tariffs and hot-rolled coil at USD 750 per ton, however, threaten margins for smaller EPCs, prompting consolidation. Canada inches forward under provincial storage-plus-solar RFPs, while Mexico leverages maquiladora capacity to avoid tariffs.
Asia-Pacific delivers the fastest 27.9% CAGR. India's 50 GW tender pipeline favors 1P modular trackers that cut capex 15%-20%. Australia's grid-forming rule drives dual-axis uptake at Western Downs and Wandoan South, where extended output improves battery round-trip efficiency. Chinese exporters dominate Southeast Asia but face IEC-62817 bankability barriers in Japan and Australia.
Europe accelerates under REPowerEU. Germany's premium tariff for agrivoltaics, France's 1.2 GW approvals, and Spain's bifacial-tracker pipeline anchor growth, while frost-heave risk slows Nordic installs. In the Middle East, NEOM and Dubai Phase V adopt 1P trackers to speed desert builds; South Africa's storage-linked tenders favor dual-axis precision. Sub-Saharan Africa lags due to O&M skill shortages, and Latin America concentrates demand in Chile's Atacama and Brazil's northeast, where direct irradiance and low land cost aid bankability.
- NEXTracker Inc.
- Array Technologies Inc.
- Arctech Solar Holdings Co. Ltd.
- Soltec Power Holdings S.A.
- PV Hardware Solutions S.L.U.
- Valmont Industries Inc. (Convert Italia)
- Trina Solar Co. Ltd. (TrinaTracker)
- GameChange Solar
- Ideematec Deutschland GmbH
- Meca Solar
- STI Norland
- Antai Solar
- SunPower Corporation
- FTC Solar
- Abengoa Solar S.A.
- AllEarth Renewables
- Deger energie GmbH
- Mahindra Susten
- Solar FlexRack
- Convert Italia S.p.A.
Additional Benefits:
- The market estimate (ME) sheet in Excel format
- 3 months of analyst support
TABLE OF CONTENTS
1 Introduction
- 1.1 Study Assumptions & Market Definition
- 1.2 Scope of the Study
2 Research Methodology
3 Executive Summary
4 Market Landscape
- 4.1 Market Drivers
- 4.1.1 U.S. IRA-fuelled Utility-Scale PPAs Unlocking Multi-GW Tracker Contracts
- 4.1.2 Diminishing Tracker Cap-Ex/ MW via 1P Modular Designs in India & MENA
- 4.1.3 Bifacial-Optimized Trackers Raising IRR in High-Albedo Regions (Atacama, Nordics)
- 4.1.4 Aggressive 24/7 Renewable Procurement by U.S. Cloud & Mining Firms
- 4.1.5 EU REPower Acceleration of Agrivoltaics - Slim-Row Trackers for Cropland
- 4.1.6 Grid-Forming Storage-Coupled Projects Pushing Dual-Axis Adoption in Australia
- 4.2 Market Restraints
- 4.2.1 Elevated Structural Steel Prices & Section 232 Tariffs in North America
- 4.2.2 Tracker Failure Risk on Frost-Heave Sites-Nordic & Alpine Utility Farms
- 4.2.3 Scarcity of Skilled O&M Crews for Decentralized Actuators in SSA
- 4.2.4 Bankability Concerns for New Chinese Entrants Without IEC 62817 Testing
- 4.3 Supply-Chain Analysis
- 4.4 Regulatory Outlook
- 4.5 Technological Outlook
- 4.6 Porter's Five Forces
- 4.6.1 Threat of New Entrants
- 4.6.2 Bargaining Power of Suppliers
- 4.6.3 Bargaining Power of Consumers
- 4.6.4 Threat of Substitutes
- 4.6.5 Intensity of Competitive Rivalry
5 Market Size & Growth Forecasts
- 5.1 By Axis Type
- 5.1.1 Single Axis
- 5.1.2 Dual Axis
- 5.2 By Technology
- 5.2.1 Photovoltaic (PV)
- 5.2.2 Concentrated Solar Power (CSP)
- 5.2.3 Concentrated Photovoltaic (CPV)
- 5.3 By Application
- 5.3.1 Utility-Scale
- 5.3.2 Commercial and Industrial
- 5.3.3 Residential and Micro-grid
- 5.3.4 Agrivoltaics/Agri-solar
- 5.4 By Drive Type
- 5.4.1 Electric Motor
- 5.4.2 Linear Actuator
- 5.4.3 Hydraulic
- 5.5 By Geography
- 5.5.1 North America
- 5.5.1.1 United States
- 5.5.1.2 Canada
- 5.5.1.3 Mexico
- 5.5.2 Europe
- 5.5.2.1 United Kingdom
- 5.5.2.2 Germany
- 5.5.2.3 France
- 5.5.2.4 Spain
- 5.5.2.5 Nordic Countries
- 5.5.2.6 Russia
- 5.5.2.7 Rest of Europe
- 5.5.3 Asia-Pacific
- 5.5.3.1 China
- 5.5.3.2 India
- 5.5.3.3 Japan
- 5.5.3.4 South Korea
- 5.5.3.5 Malaysia
- 5.5.3.6 Thailand
- 5.5.3.7 Indonesia
- 5.5.3.8 Vietnam
- 5.5.3.9 Australia
- 5.5.3.10 Rest of Asia-Pacific
- 5.5.4 South America
- 5.5.4.1 Brazil
- 5.5.4.2 Argentina
- 5.5.4.3 Colombia
- 5.5.4.4 Rest of South America
- 5.5.5 Middle East and Africa
- 5.5.5.1 United Arab Emirates
- 5.5.5.2 Saudi Arabia
- 5.5.5.3 South Africa
- 5.5.5.4 Egypt
- 5.5.5.5 Rest of Middle East and Africa
- 5.5.1 North America
6 Competitive Landscape
- 6.1 Market Concentration
- 6.2 Strategic Moves (M&A, Partnerships, PPAs)
- 6.3 Market Share Analysis (Market Rank/Share for key companies)
- 6.4 Company Profiles (includes Global-level Overview, Market-level Overview, Core Segments, Financials, Strategic Info, Products & Services, Recent Developments)
- 6.4.1 NEXTracker Inc.
- 6.4.2 Array Technologies Inc.
- 6.4.3 Arctech Solar Holdings Co. Ltd.
- 6.4.4 Soltec Power Holdings S.A.
- 6.4.5 PV Hardware Solutions S.L.U.
- 6.4.6 Valmont Industries Inc. (Convert Italia)
- 6.4.7 Trina Solar Co. Ltd. (TrinaTracker)
- 6.4.8 GameChange Solar
- 6.4.9 Ideematec Deutschland GmbH
- 6.4.10 Meca Solar
- 6.4.11 STI Norland
- 6.4.12 Antai Solar
- 6.4.13 SunPower Corporation
- 6.4.14 FTC Solar
- 6.4.15 Abengoa Solar S.A.
- 6.4.16 AllEarth Renewables
- 6.4.17 Deger energie GmbH
- 6.4.18 Mahindra Susten
- 6.4.19 Solar FlexRack
- 6.4.20 Convert Italia S.p.A.
7 Market Opportunities & Future Outlook
- 7.1 White-space & Unmet-Need Assessment

 全球單軸太陽能追蹤器市場(2026-2030 年)
 歐洲太陽能追蹤器:市場佔有率分析、行業趨勢和統計數據以及成長預測(2026-2031 年)
 太陽能追蹤器市場-2026-2032年全球市場預測雙軸太陽能追蹤器市場—2026-2032年全球市場預測
 雙軸太陽能追蹤器市場規模、佔有率和趨勢分析報告:按類型、應用、地區和細分市場分類(2026-2033 年)太陽能追蹤器市場規模、佔有率和趨勢分析報告:按技術、類型、應用、地區和細分市場分類(2026-2033 年)
 太陽能追蹤器市場機會、成長促進因素、產業趨勢分析及預測(2026-2035)
 單軸太陽能追蹤器市場預測至2034年—按產品類型、旋轉軸、應用和區域分類的全球分析
 太陽能追蹤器市場規模、佔有率和成長分析:按類型、軸類型、應用和地區分類-2026-2033年產業預測
 太陽能追蹤器市場規模、佔有率、趨勢和預測:按類型、追蹤方法、技術、應用和地區分類(2026-2034 年)