


 |
市場調查報告書
商品編碼
2038751
公用事業太陽能追蹤器市場機會、成長要素、產業趨勢分析及2026-2035年預測Utility Solar Tracker Market Opportunity, Growth Drivers, Industry Trend Analysis, and Forecast 2026 - 2035 |
||||||
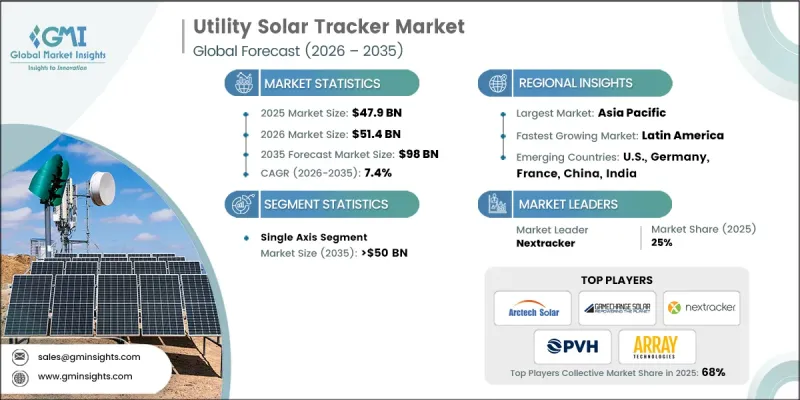
2025 年全球公用事業太陽能追蹤器市場規模預計為 479 億美元,預計到 2035 年將以 7.4% 的複合年成長率成長至 980 億美元。
隨著全球能源系統持續向更清潔、更永續的替代能源轉型,太陽能市場正穩步發展。有利的法規結構、強力的政策支持以及市場主導的舉措,為全球太陽能的普及應用奠定了堅實的基礎。隨著太陽能發電成本持續下降,而傳統能源成本不斷上升,相關人員越來越傾向於分散式能源模式。同時,太陽能追蹤技術的進步提高了精度、效率和可靠性,從而提升了系統的整體性能。創新和競爭性製造帶來的成本降低,推動了對大型太陽能發電設施投資的增加,進而促進了市場擴張。此外,為確保開發中國家的能源安全而採取的措施,也加速了公用事業規模太陽能解決方案的普及。與傳統能源相比,太陽能發電的平準化度電成本(LCOE)更低,使其更具經濟可行性,從而吸引了更多投資。隨著對永續能源需求的成長,產業相關人員正積極擴大產能,以滿足不斷變化的能源需求。
| 市場範圍 | |
|---|---|
| 開始年份 | 2025 |
| 預測期 | 2026-2035 |
| 上市時的市場規模 | 479億美元 |
| 預計金額 | 980億美元 |
| 複合年成長率 | 7.4% |
預計到2035年,單軸太陽能追蹤器市場規模將達到500億美元,主要得益於系統設計和運作效率的持續技術進步。增強的控制機制和智慧整合能力正在提升發電潛力,並進一步加速其部署。隨著分散式能源系統的推進以及輸出性能的提高,公用事業太陽能追蹤器市場中該細分領域的市場前景仍然強勁。
預計到2035年,歐洲公用事業太陽能追蹤器市場規模將達到110億美元,主要得益於對節能解決方案日益成長的需求以及向可再生能源系統的持續轉型。強大的工業基礎,加上對先進技術研發投入的增加,正在支撐該地區的成長。不斷擴大的生產基礎設施和以創新為導向的策略,進一步提升了全部區域市場競爭力。
目錄
第1章:調查方法和範圍
第2章執行摘要
第3章業界考察
- 產業生態系統
- 監理情勢
- 影響產業的因素
- 促進因素
- 產業潛在風險與挑戰
- 成長潛力分析
- 價格趨勢分析
- 波特五力分析
- PESTEL 分析
- 成本結構分析
- 價格趨勢分析,2022-2035年
- 依產品
- 按地區
- 新機會和趨勢
- 數位化和物聯網整合
- 投資分析及未來展望
第4章 競爭情勢
- 介紹
- 企業市佔率分析:按地區分類
- 北美洲
- 歐洲
- 亞太地區
- 中東
- 非洲
- 拉丁美洲
- 競爭定位矩陣
- 主要進展
- 併購
- 夥伴關係與合作
- 新產品發布
- 業務拓展計劃及資金籌措
第5章 市場規模及預測:依產品分類,2022-2035年
- 單軸
- 雙軸
第6章 市場規模及預測:依地區分類,2022-2035年
- 北美洲
- 美國
- 加拿大
- 墨西哥
- 歐洲
- 英國
- 法國
- 荷蘭
- 德國
- 瑞典
- 西班牙
- 奧地利
- 亞太地區
- 中國
- 日本
- 韓國
- 印度
- 澳洲
- 中東
- 沙烏地阿拉伯
- 阿拉伯聯合大公國
- 約旦
- 以色列
- 非洲
- 南非
- 埃及
- 阿爾及利亞
- 奈及利亞
- 摩洛哥
- 拉丁美洲
- 巴西
- 智利
第7章:公司簡介
- Abengoa
- Antai Technologies
- ArcelorMittal
- Arctech Solar
- Array Technologies
- DEGERENERGIE
- FTC Solar
- GameChange Solar
- Gonvarri Solar Steel
- Haosolar
- Ideematec
- Mecasolar
- Nclave
- Nextracker
- Powerway Renewable Energy
- PVHardware
- Scorpius Trackers
- SOLTEC
- STI Norland
- Trina Solar
The Global Utility Solar Tracker Market was valued at USD 47.9 billion in 2025 and is estimated to grow at a CAGR of 7.4% to reach USD 98 billion by 2035.
The market is gaining steady momentum as global energy systems continue shifting toward cleaner and more sustainable alternatives. Favorable regulatory frameworks, combined with strong policy support and market-driven initiatives, are creating a solid foundation for solar deployment worldwide. Stakeholders are increasingly focusing on distributed energy models as the cost of solar continues to decline while conventional energy expenses rise. At the same time, advancements in solar tracking technologies are improving precision, efficiency, and reliability, which is enhancing overall system performance. Growing investments in large-scale solar installations, supported by cost reductions driven by innovation and competitive manufacturing, are reinforcing market expansion. In addition, the push for energy security across developing economies is accelerating the adoption of utility-scale solar solutions. Lower levelized cost of energy has made solar power more economically viable compared to traditional sources, attracting greater investment interest. As demand for sustainable energy rises, industry participants are actively scaling their capabilities to meet evolving energy requirements.
| Market Scope | |
|---|---|
| Start Year | 2025 |
| Forecast Year | 2026-2035 |
| Start Value | $47.9 Billion |
| Forecast Value | $98 Billion |
| CAGR | 7.4% |
The single-axis segment is expected to reach USD 50 billion by 2035, supported by continuous technological improvements in system design and operational efficiency. Enhanced control mechanisms and smarter integration capabilities are contributing to higher energy generation potential, further accelerating adoption. The growing transition toward decentralized energy systems, combined with improved output performance, continues to strengthen the segment's outlook within the utility solar tracker market.
Europe Utility Solar Tracker Market is projected to reach USD 11 billion by 2035, driven by increasing demand for energy-efficient solutions and the ongoing transition toward renewable energy systems. Strong industrial capabilities, coupled with rising investments in advanced technology development, are supporting regional growth. Expanding production infrastructure and innovation-focused strategies are further enhancing the competitiveness of the market across the region.
Key players operating in the Global Utility Solar Tracker Market include Nextracker, Array Technologies, Arctech Solar, Trina Solar, GameChange Solar, FTC Solar, PVHardware, SOLTEC, STI Norland, Ideematec, Gonvarri Solar Steel, Powerway Renewable Energy, Antai Technologies, Scorpius Trackers, Mecasolar, Nclave, Abengoa, DEGERENERGIE, ArcelorMittal, and Hao Solar. Companies in the utility solar tracker market are adopting a range of strategic initiatives to strengthen their market position and expand their global presence. They are prioritizing investments in research and development to deliver advanced tracking systems with improved efficiency and durability. Strategic partnerships and collaborations are being leveraged to enhance technological capabilities and broaden market reach. Many players are also focusing on expanding manufacturing capacities and entering emerging markets to capture new growth opportunities. In addition, companies are working on optimizing supply chains and reducing production costs to remain competitive.
Table of Contents
Chapter 1 Methodology & Scope
- 1.1 Research design
- 1.2 Quality commitment
- 1.2.1 GMI AI policy & data integrity commitment
- 1.2.1.1 Source consistency protocol
- 1.2.1 GMI AI policy & data integrity commitment
- 1.3 Research trail & Confidence Scoring
- 1.3.1 Research trail components
- 1.3.2 Scoring components
- 1.4 Data Collection
- 1.4.1 Partial list of primary sources
- 1.5 Data mining sources
- 1.5.1 Paid sources
- 1.5.1.1 Sources, by region
- 1.5.1 Paid sources
- 1.6 Base estimates and calculations
- 1.6.1 Base year calculation for any one approach
- 1.7 Forecast model
- 1.8 Research transparency addendum
- 1.8.1 Source attribution framework
- 1.8.2 Quality assurance metrics
- 1.8.3 Our commitment to trust
- 1.9 Market definitions
Chapter 2 Executive Summary
- 2.1 Industry synopsis, 2022 - 2035
- 2.2 Business trends
- 2.3 Product trends
- 2.4 Regional trends
Chapter 3 Industry Insights
- 3.1 Industry ecosystem
- 3.2 Regulatory landscape
- 3.3 Industry impact forces
- 3.3.1 Growth drivers
- 3.3.2 Industry pitfalls & challenges
- 3.4 Growth potential analysis
- 3.5 Price trend analysis
- 3.6 Porter's analysis
- 3.6.1 Bargaining power of suppliers
- 3.6.2 Bargaining power of buyers
- 3.6.3 Threat of new entrants
- 3.6.4 Threat of substitutes
- 3.7 PESTEL analysis
- 3.7.1 Political factors
- 3.7.2 Economic factors
- 3.7.3 Social factors
- 3.7.4 Technological factors
- 3.7.5 Legal factors
- 3.7.6 Environmental factors
- 3.8 Cost structure analysis
- 3.9 Price trend analysis, 2022-2035
- 3.9.1 By Product
- 3.9.2 By Region
- 3.10 Emerging opportunities & trends
- 3.10.1 Digitalization & IoT integration
- 3.10.2 Investment analysis & future outlook
Chapter 4 Competitive landscape, 2026
- 4.1 Introduction
- 4.2 Company market share analysis, by region, 2025
- 4.2.1 North America
- 4.2.2 Europe
- 4.2.3 Asia Pacific
- 4.2.4 Middle East
- 4.2.5 Africa
- 4.2.6 Latin America
- 4.3 Competitive positioning matrix
- 4.4 Key developments
- 4.4.1 Mergers & acquisitions
- 4.4.2 Partnerships & collaborations
- 4.4.3 New product launches
- 4.4.4 Expansion plans & funding
Chapter 5 Market Size and Forecast, By Product, 2022 - 2035 (USD Billion & MW)
- 5.1 Key trends
- 5.2 Single axis
- 5.3 Dual axis
Chapter 6 Market Size and Forecast, By Region, 2022 - 2035 (USD Billion & MW)
- 6.1 Key trends
- 6.2 North America
- 6.2.1 U.S.
- 6.2.2 Canada
- 6.2.3 Mexico
- 6.3 Europe
- 6.3.1 UK
- 6.3.2 France
- 6.3.3 Netherlands
- 6.3.4 Germany
- 6.3.5 Sweden
- 6.3.6 Spain
- 6.3.7 Austria
- 6.4 Asia Pacific
- 6.4.1 China
- 6.4.2 Japan
- 6.4.3 South Korea
- 6.4.4 India
- 6.4.5 Australia
- 6.5 Middle East
- 6.5.1 Saudi Arabia
- 6.5.2 UAE
- 6.5.3 Jordan
- 6.5.4 Israel
- 6.6 Africa
- 6.6.1 South Africa
- 6.6.2 Egypt
- 6.6.3 Algeria
- 6.6.4 Nigeria
- 6.6.5 Morocco
- 6.7 Latin America
- 6.7.1 Brazil
- 6.7.2 Chile
Chapter 7 Company Profiles
- 7.1 Abengoa
- 7.2 Antai Technologies
- 7.3 ArcelorMittal
- 7.4 Arctech Solar
- 7.5 Array Technologies
- 7.6 DEGERENERGIE
- 7.7 FTC Solar
- 7.8 GameChange Solar
- 7.9 Gonvarri Solar Steel
- 7.10 Haosolar
- 7.11 Ideematec
- 7.12 Mecasolar
- 7.13 Nclave
- 7.14 Nextracker
- 7.15 Powerway Renewable Energy
- 7.16 PVHardware
- 7.17 Scorpius Trackers
- 7.18 SOLTEC
- 7.19 STI Norland
- 7.20 Trina Solar
 太陽能追蹤器市場機會、成長促進因素、產業趨勢分析及預測(2026-2035)
 單軸太陽能追蹤器市場預測至2034年—按產品類型、旋轉軸、應用和區域分類的全球分析
 太陽能追蹤器市場規模、佔有率和成長分析:按類型、軸類型、應用和地區分類-2026-2033年產業預測
 太陽能追蹤器市場規模、佔有率、趨勢和預測:按類型、追蹤方法、技術、應用和地區分類(2026-2034 年)商業和工業太陽能追蹤器的市場機會、成長要素、產業趨勢分析和預測(2026-2035 年)住宅太陽能追蹤器市場機會、成長要素、產業趨勢分析及2026-2035年預測單軸太陽能追蹤器市場機會、成長要素、產業趨勢分析及2026-2035年預測。雙軸太陽能追蹤器市場機會、成長要素、產業趨勢分析及2026-2035年預測。
 2026年全球智慧太陽能追蹤簾子市場報告
 太陽能追蹤器市場:按類型、技術、系統類型和應用分類-2026-2032年全球市場預測