

 |
市場調查報告書
商品編碼
2123418
美國自動化物料輸送:市場佔有率分析、產業趨勢與統計、成長預測(2026-2031)United States Automated Material Handling - Market Share Analysis, Industry Trends & Statistics, Growth Forecasts (2026 - 2031) |
||||||

※ 本網頁內容可能與最新版本有所差異。詳細情況請與我們聯繫。
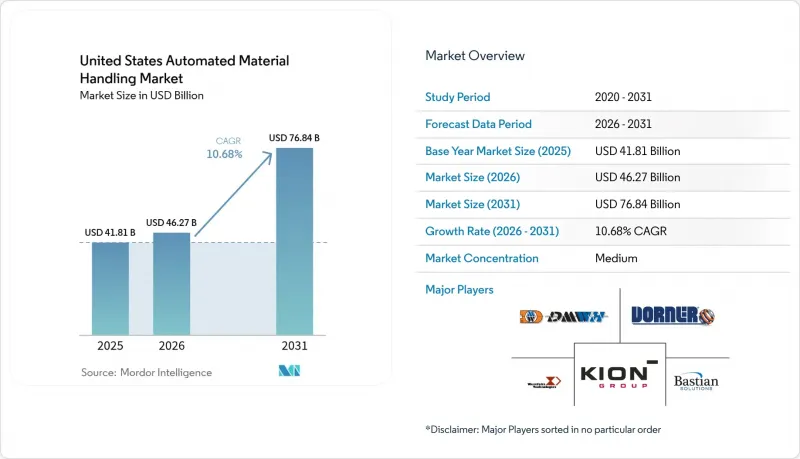
根據 Mordor Intelligence 預測,美國自動化物料輸送市場規模將從 2025 年的 418.1 億美元成長到 2026 年的 462.7 億美元,然後在 2031 年達到 768.4 億美元,2026 年至 2031 年的複合年成長率為 10.68%。
本報告依產品類型(硬體、軟體、服務)、設備類型(AGV、AMR、雷射導引車、ASRS、分類系統)、系統類型(物料搬運、倉儲、包裝、分類/碼垛系統)以及最終用戶產業(機場、汽車、食品飲料等)分類。市場預測以美元(USD)計價。
美國自動化物料輸送市場趨勢與洞察
製造流程日益複雜化與技術的普及
在汽車、航太和電子工廠,數萬個活躍SKU同時進行處理,固定式輸送機佈局正逐漸淘汰。靈活的自動化平台整合了機器學習演算法,能夠即時重新規劃料箱和托盤的路徑,在維持產能的同時,將揀貨錯誤率降低40%。數位孿生模擬降低了資本項目的風險,並使工程師能夠在鋼骨混凝土施工之前模擬物料流動場景。採用這種方法的工廠報告稱,上運作後生產線生產率提高了25%至35%。開放式軟體架構有助於在產品生命週期縮短的情況下快速重新配置,並在客製化日益普遍的情況下保障投資報酬率(ROI)。這形成了一個良性循環。日益成長的複雜性推動了對自動化的需求,而控制這種複雜性的智慧系統則使製造商能夠在不相應增加員工的情況下擴展營運規模。隨著零件價格的下降和整合商提供的承包解決方案的普及,曾經僅限於一級OEM製造商的先進機器人技術,現在也為中型工廠所用。
對提高訂單準確率和增加 SKU 的需求不斷成長。
為了滿足當日送達的要求,履約中心需要達到 99.9% 的準確率,而以目前的人工揀貨工資水平,這一目標難以實現。透過將視覺引導分類機與人工智慧驅動的品質檢測相結合,物流中心現在每小時可以處理多達 15,000 件商品,準確率高達 99.95%,從而顯著降低退貨率並提高利潤率。由於機器人可以全天運作且無需支付加班費,人事費用降低了 60-70%。實現了揀貨和包裝自動化的零售商,其淨推薦值 (NPS) 實現了兩位數的成長,因為消費者能夠更快地收到正確的商品。此外,高準確率還減少了來自電商平台的扣回爭議帳款,從而保護了賣家的聲譽並維持了業務成長。財務收益也十分可觀。由於投資回收期不到兩年,財務長可以批准在多個地點部署自動化系統,並將其深度整合到網路策略中。
供應鏈技能缺口與勞動力短缺
德勤估計,到2033年,美國製造業將有190萬個職缺,其中自動化工程師是最緊缺的職位之一。由於缺乏具備PLC程式設計和機器人故障排除技能的本地工程師,系統整合商經常反映試運行延誤6到12個月。員工流動導致企業內部知識流失的速度超過了社區大學課程的補充速度,進一步加劇了人才短缺。雇主們正在透過建立內部培訓計畫和與職業學校合作來應對這個問題,但這些努力需要數年時間才能見效。在人才供應管道拓展之前,計畫工期將持續延長,從而限制美國自動化物料輸送市場的成長潛力。
細分市場分析
到2025年,硬體仍將佔據美國自動化物料輸送市場66.35%的佔有率,因為起重機、輸送機和機器人仍將是所有物料輸送設備的基礎。同時,隨著雲端平台、人工智慧引擎和預測性物料輸送市場正在擴張。
倉庫管理套件現在可以採集所有資產的遙測數據,運行機器學習模型來最佳化路線,並在幾秒鐘內向機器人發送更新。整合商業智慧(BI) 儀表板的設施透過每日調整工作流程設置,處理能力提高了 15% 至 25%。訂閱授權將資本支出 (Capex) 轉化為營運支出 (OpEx),因此可以進行季節性成本調整,同時確保持續的功能更新。這項服務完善了這三大支柱。專家審核、全天候遠端診斷和分階段維修確保了運作並延長了資產使用壽命,從而提高了美國更廣泛的自動化物料輸送市場中供應商的忠誠度。
到2025年,自動化倉儲系統(AS/RS)的銷售額將佔總銷售額的24.20%,這主要得益於空間受限的物流中心(DC)對最大容量和可追溯性的需求。然而,自主移動機器人(AMR)才是成長的主要驅動力,其複合年成長率(CAGR)高達13.08%,正在重塑待開發區和棕地設施內部的物流流程。由於AMR無需遵循固定的引導路徑即可移動,因此能夠大幅降低全通路商務中因產品組合每日變化而產生的重新配置成本。
雖然試點車隊通常規模小規模,但API優先的架構使營運商無需進行大規模重新設計即可擴展到數百台設備。凱傲與Fox Robotics合作開發的自動拖車裝載機,正是實現堆場作業自動化這一端到端物流流程最後一道難關的典型例子。傳統的AGV、雷射導引車和堆垛機在重型貨物和可預測路線的運輸中仍然發揮著重要作用,而高速分揀系統在小包裹樞紐中也佔有一席之地,因為在這些樞紐中,處理能力比柔軟性更為重要。整體而言,美國自動化物料輸送市場仍青睞兼具固定精度和移動性的設備組合。
其他好處:
- Excel格式的市場預測(ME)表
- 3個月的分析師支持
目錄
第1章:引言
- 研究假設和市場定義
- 調查範圍
第2章:調查方法
第3章執行摘要
第4章 市場狀況
- 市場概覽
- 市場促進因素
- 電子商務發展導致倉庫擴張
- 中小企業對「即服務」模式的支援日益成長。
- 勞動力短缺導致自動化進程加速
- 美國銀行對ESG掛鉤貸款的獎勵
- 二手設備經銷市場的流動性
- 基於第 179 條款扣除的聯邦稅優惠
- 市場限制因素
- AGV的殘值存在高度不確定性。
- 2024年起,銀行將收緊信用評分審核流程。
- 基準利率波動
- 租賃協議中包含網路風險溢價
- 產業價值鏈分析
- 監理情勢
- 技術展望
- 波特五力分析
第5章 市場規模與成長預測
- 依設備類型
- 堆高機
- 自動導引運輸車(AGV)
- 傳送系統
- 儲存和搜尋系統
- 起重機和起吊裝置
- 按最終用戶行業分類
- 電子商務與第三方物流
- 食品/飲料
- 製造業
- 零售(不含電子商務)
- 製藥
- 按生產能力範圍分類
- 不到5000英鎊
- 5,000英鎊至10,000英鎊
- 10,001英鎊至20,000英鎊
- 20,000英鎊或以上
- 按資金籌措類型分類
- 經營租賃
- 資本租賃
- 貸款/分期付款銷售
- 售後回租
第6章 競爭情勢
- 市場集中度
- 策略趨勢
- 市佔率分析
- 公司簡介
- CIT Group Inc.
- Crest Capital LLC
- Element Fleet Management Corp.
- Trust Capital LLC
- DLL Finance LLC
- Pacific Rim Capital Inc.
- CLARK Material Handling Company
- Taylor Leasing and Rental Inc.
- Evolve Bank and Trust
- Toyota Material Handling USA Inc.
- Bank of the West
- HomeTrust Bank
- TCF Bank
- Hanmi Bank
- Bank of America Corp.
- Wells Fargo and Company
第7章 市場機會與未來展望
According to Mordor Intelligence, the United States automated material handling market size is expected to grow from USD 41.81 billion in 2025 to USD 46.27 billion in 2026 and is forecast to reach USD 76.84 billion by 2031 at 10.68% CAGR over 2026-2031.
This report is Segmented by Product Type (Hardware, Software, and Services), Equipment Type (AGV, AMR, Laser Guided Vehicle, ASRS, and Sortation System), System Type (Material Transport, Storage, Packaging, and Sorting and Palletizing Systems), End-User Vertical (Airport, Automotive, Food and Beverage, and More). The Market Forecasts are Provided in Terms of Value (USD).
United States Automated Material Handling Market Trends and Insights
Increasing Manufacturing Complexity and Technology Availability
Automotive, aerospace, and electronics plants now juggle tens of thousands of active SKUs, making fixed conveyor layouts obsolete. Flexible automation platforms integrate machine-learning algorithms that re-route totes or pallets in real time, trimming picking errors by 40% while preserving throughput. Digital-twin simulations de-risk capital projects, letting engineers model material-flow scenarios before steel meets concrete; facilities that embrace this approach report 25-35% higher line productivity after go-live. Open software architectures encourage rapid reconfiguration when product lifecycles shrink, safeguarding return on investment as customization proliferates. The result is a virtuous cycle: heightened complexity sparks automation demand, while intelligent systems tame that complexity, allowing manufacturers to scale without proportional labour growth. As component prices fall and integrators package turnkey solutions, even mid-sized plants can deploy advanced robotics once reserved for tier-one OEMs.
Increasing Demand for Improving Order Accuracy and SKU Proliferation
Same-day delivery promises drive fulfilment centers toward 99.9% accuracy, a bar unattainable with manual picking at current wage levels. Vision-guided sorters paired with AI quality checks now process up to 15,000 units per hour and deliver 99.95% precision, slashing returns and boosting margin. Labor savings range from 60-70% because robots operate every shift without overtime premiums. Retailers that automate both picking and pack-out note double-digit jumps in Net Promoter Scores as consumers receive the right goods faster. Furthermore, high accuracy curtails chargebacks from marketplace partners, preserving seller reputations and sustaining growth. The financial logic is compelling: payback periods under two years allow CFOs to green-light multi-site rollouts, embedding automation deep into network strategy.
Gap in Supply-Chain Skills and Workforce Shortage
Deloitte estimates 1.9 million U.S. manufacturing jobs could remain unfilled by 2033, with automation technicians among the scarcest roles. Integrators routinely cite commissioning delays of six to twelve months because local talent pools lack PLC programming and robotics troubleshooting capability. Retirements drain institutional knowledge faster than community-college curricula can replenish it, magnifying the shortfall. Employers respond by launching internal academies and partnering with vocational schools, but these efforts take years to bear fruit. Until the pipeline widens, project timelines will extend, constraining the growth potential of the United States automated material handling market.
Other drivers and restraints analyzed in the detailed report include:
- Emergence of Smart City Logistics and Wide Adoption of Robotics in Warehouse Applications
- Tax Incentives Under Section 179 Accelerated Depreciation for Automation Equipment
- Semiconductor Supply-Chain Volatility Limiting Sensor Availability
For complete list of drivers and restraints, kindly check the Table Of Contents.
Segment Analysis
Hardware maintained 66.35% of the United States automated material handling market share in 2025 because cranes, conveyors, and robots remain the backbone of any automated installation. Software, however, is projected to expand at a 14.74% CAGR as cloud platforms, AI engines, and predictive-maintenance modules become indispensable. The United States automated material handling market size captured by software-centric deals is rising as operators seek unified control towers that telescope across multiple sites.
Warehouse management suites now ingest telemetry from every asset, run machine-learning models to optimize routings, and push updates back to robots in seconds. Facilities that integrate business-intelligence dashboards see 15-25% throughput gains by dialling workflow settings daily. Subscription licenses convert capex to opex, aligning costs with seasonality while ensuring continuous feature updates. Services complete the triad: expert audits, 24-7 remote diagnostics, and phased retrofits preserve uptime and stretch asset lives, reinforcing vendor stickiness in the broader United States automated material handling market.
Automated storage and retrieval systems held a 24.20% revenue share in 2025 because space-constrained DCs require cubic maximization and inventory traceability. Yet autonomous mobile robots headline growth with a 13.08% CAGR, redefining intralogistics flow across greenfield and brownfield sites. AMRs navigate without fixed guide paths, slashing reconfiguration cost when product mixes shift an everyday reality in omnichannel commerce.
Pilot fleets typically start small, but API-first architectures let operators scale to hundreds of units without forklift-heavy redesigns. KION's partnership with Fox Robotics to build autonomous trailer loaders exemplifies a push to automate yard operations, the final frontier in end-to-end flow. Traditional AGVs, laser-guided vehicles, and palletizers remain relevant in heavy or predictable routes, while high-speed sortation maintains a foothold in parcel hubs that prize throughput over flexibility. Overall, the United States automated material handling market continues to favour equipment portfolios that combine fixed precision with mobile agility.
Complete Report Scope:
- By Equipment Type
- Forklifts
- Automated Guided Vehicles (AGVs)
- Conveyor Systems
- Storage and Retrieval Systems
- Cranes and Hoists
- By End-User Industry
- E-commerce and 3PL
- Food and Beverage
- Manufacturing
- Retail (non-e-commerce)
- Pharmaceuticals
- By Capacity Range
- Below 5,000 lbs
- 5,000 - 10,000 lbs
- 10,001 - 20,000 lbs
- Above 20,000 lbs
- By Financing Type
- Operating Lease
- Capital Lease
- Loan / Hire-Purchase
- Sale and Lease-Back
List of Companies Covered in this Report:
- CIT Group Inc.
- Crest Capital LLC
- Element Fleet Management Corp.
- Trust Capital LLC
- DLL Finance LLC
- Pacific Rim Capital Inc.
- CLARK Material Handling Company
- Taylor Leasing and Rental Inc.
- Evolve Bank and Trust
- Toyota Material Handling USA Inc.
- Bank of the West
- HomeTrust Bank
- TCF Bank
- Hanmi Bank
- Bank of America Corp.
- Wells Fargo and Company
Additional Benefits:
- The market estimate (ME) sheet in Excel format
- 3 months of analyst support
TABLE OF CONTENTS
1 INTRODUCTION
- 1.1 Study Assumptions and Market Definition
- 1.2 Scope of the Study
2 RESEARCH METHODOLOGY
3 EXECUTIVE SUMMARY
4 MARKET LANDSCAPE
- 4.1 Market Overview
- 4.2 Market Drivers
- 4.2.1 Rising e-commerce warehouse expansion
- 4.2.2 Growing preference for "as-a-service" models among SMEs
- 4.2.3 Accelerated automation mandates due to labor constraints
- 4.2.4 ESG-linked financing incentives from U.S. banks
- 4.2.5 Secondary market liquidity for used equipment
- 4.2.6 Federal tax advantages under Section 179 deduction
- 4.3 Market Restraints
- 4.3.1 High residual-value uncertainty for AGVs
- 4.3.2 Bank tightening on credit scores post-2024
- 4.3.3 Volatility in benchmark interest rates
- 4.3.4 Cyber-risk premiums embedded in lease contracts
- 4.4 Industry Value-Chain Analysis
- 4.5 Regulatory Landscape
- 4.6 Technological Outlook
- 4.7 Porter's Five Forces Analysis
- 4.7.1 Threat of New Entrants
- 4.7.2 Bargaining Power of Suppliers
- 4.7.3 Bargaining Power of Buyers
- 4.7.4 Threat of Substitutes
- 4.7.5 Competitive Rivalry
5 MARKET SIZE AND GROWTH FORECASTS (VALUE)
- 5.1 By Equipment Type
- 5.1.1 Forklifts
- 5.1.2 Automated Guided Vehicles (AGVs)
- 5.1.3 Conveyor Systems
- 5.1.4 Storage and Retrieval Systems
- 5.1.5 Cranes and Hoists
- 5.2 By End-User Industry
- 5.2.1 E-commerce and 3PL
- 5.2.2 Food and Beverage
- 5.2.3 Manufacturing
- 5.2.4 Retail (non-e-commerce)
- 5.2.5 Pharmaceuticals
- 5.3 By Capacity Range
- 5.3.1 Below 5,000 lbs
- 5.3.2 5,000 - 10,000 lbs
- 5.3.3 10,001 - 20,000 lbs
- 5.3.4 Above 20,000 lbs
- 5.4 By Financing Type
- 5.4.1 Operating Lease
- 5.4.2 Capital Lease
- 5.4.3 Loan / Hire-Purchase
- 5.4.4 Sale and Lease-Back
6 COMPETITIVE LANDSCAPE
- 6.1 Market Concentration
- 6.2 Strategic Moves
- 6.3 Market Share Analysis
- 6.4 Company Profiles (includes Global level Overview, Market level overview, Core Segments, Financials as available, Strategic Information, Market Rank/Share for key companies, Products and Services, and Recent Developments)
- 6.4.1 CIT Group Inc.
- 6.4.2 Crest Capital LLC
- 6.4.3 Element Fleet Management Corp.
- 6.4.4 Trust Capital LLC
- 6.4.5 DLL Finance LLC
- 6.4.6 Pacific Rim Capital Inc.
- 6.4.7 CLARK Material Handling Company
- 6.4.8 Taylor Leasing and Rental Inc.
- 6.4.9 Evolve Bank and Trust
- 6.4.10 Toyota Material Handling USA Inc.
- 6.4.11 Bank of the West
- 6.4.12 HomeTrust Bank
- 6.4.13 TCF Bank
- 6.4.14 Hanmi Bank
- 6.4.15 Bank of America Corp.
- 6.4.16 Wells Fargo and Company
7 MARKET OPPORTUNITIES AND FUTURE OUTLOOK
- 7.1 White-Space and Unmet-Need Assessment

 2026-2030年全球自動化物料輸送(AMH)市場
 冷氣動力噴塗設備市場分析及預測(至2035年):依類型、產品、服務、技術、組件、應用、材料類型、製程及最終用戶分類
 單元貨載系統市場規模、佔有率和成長分析:按產品類型、組件、應用、最終用戶、自動化程度和地區分類 - 產業預測,2026-2033 年
 亞太地區自動化物料輸送:市場佔有率分析、產業趨勢與統計及成長預測(2026-2031 年)亞太地區自動化物料輸送和儲存系統:市場佔有率分析、產業趨勢和統計數據以及成長預測(2026-2031 年)
 自動化物料輸送市場-全球市場預測(2026-2032年)北美自動化物料輸送:市場佔有率分析、產業趨勢與統計及成長預測(2026-2031 年)自動化物料輸送(AMH):市場佔有率分析、產業趨勢與統計資料、成長預測(2026-2031)
 小型貨梯市場規模、佔有率和成長分析:按產品類型、載重能力、應用、最終用戶、安裝類型、分銷管道和地區分類-2026-2033年產業預測
 智慧托盤化與裝載最佳化包裝市場,2034 年