


 |
市場調查報告書
商品編碼
2122253
亞太地區自動化物料輸送:市場佔有率分析、產業趨勢與統計及成長預測(2026-2031 年)Asia Pacific Automated Material Handling - Market Share Analysis, Industry Trends & Statistics, Growth Forecasts (2026 - 2031) |
||||||

※ 本網頁內容可能與最新版本有所差異。詳細情況請與我們聯繫。
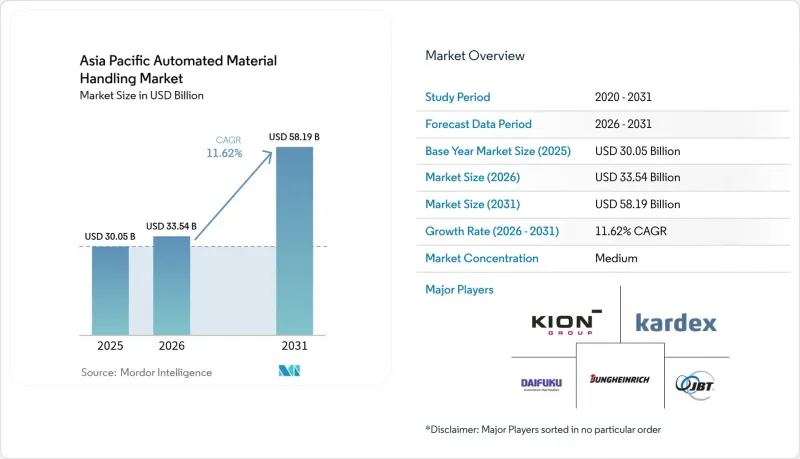
據 Mordor Intelligence 稱,亞太地區自動化物料輸送市場規模預計在 2026 年達到 335.4 億美元,高於 2025 年的 300.5 億美元,預計到 2031 年將達到 581.9 億美元。
預計 2026 年至 2031 年的複合年成長率為 11.62%。
本報告按產品類型(硬體、軟體、服務)、設備類型(移動機器人、自動化立體倉庫等)、終端用戶產業(機場、汽車、其他)、有效載荷能力(500公斤以下、500公斤至1500公斤、其他)、導航技術(雷射導引、視覺導引、其他)和地區進行細分。市場預測以美元計價。
亞太地區自動化物料輸送市場趨勢及洞察。
加大對物流設施工業4.0的投資
區域製造商正投入創紀錄的預算,用於升級整合生產線、倉庫管理系統和企業軟體的網實整合系統。中國每年在智慧工廠的支出已超過2,000億美元,而日本的「社會5.0」計畫也為工業IoT撥款1,300億美元。這些努力直接促成了對自主拖船、穿梭車和堆高機的訂單,這些設備能夠將即時規劃系統與物料流同步。新加坡的「智慧國家」計畫展示了公共共同投資如何加速技術應用;到2024年,新加坡40%的倉庫將使用自主移動機器人。營運商現在將整合物料輸送視為實現工業4.0所承諾的效率的先決條件。
電子商務履約中心的激增
2024年,亞太地區線上零售市場滲透率將達到總銷售額的18.3%,超過其他所有地區。訂單激增縮短了配送前置作業時間,迫使履約中心實現揀貨、分類和出貨的自動化。在2024年中國的「雙十一」購物節期間,24小時內處理了14.8億個小包裹——這項壯舉只有高吞吐量的自主機器人才能實現。京東等平台目前營運超過1000個自動化倉庫,促使該地區的競爭對手,如Shopee和Lazada,效仿類似的機器人部署策略。每個新的履約中心都會帶動上下游物流中心的同步投資,從而維持對自動化解決方案的良性循環需求。
整合自動化專案需要較高的初始資本投入
即使扣除建築維修和變更管理成本,為中型倉庫實施一套端到端系統通常也需要 200 萬至 500 萬美元。對於年收入低於 1,000 萬美元的印尼倉庫業者而言,這筆投資相當於其年收入的 25% 至 50%。資金籌措管道仍然有限,雖然機器人即服務 (RaaS) 方案降低了進入門檻,但可能會推高總擁有成本 (TCO)。在設備價格下降或融資管道擴大之前,小規模業者可能會推遲採用該系統,這可能會減緩整體市場成長。
細分市場分析
預計到2025年,硬體將在亞太地區的自動化物料輸送市場佔據60.63%的佔有率,這再次印證了實體資產仍然是營運的基礎。然而,隨著企業追求數據驅動的效能提升,軟體收入預計到2031年將以13.32%的複合年成長率成長。隨著預測性維護、能源最佳化和基於人工智慧的路線規劃等技術被整合到現有設備中,自動化物料輸送市場的軟體部分預計將逐年擴張。隨著系統複雜性的增加,對諮詢、整合和生命週期支援的需求也隨之成長,業務收益也穩定成長。凱傲(KION)等供應商已透過收購德馬泰克(Dematic)等公司進入軟體領域,這表明以往以機器為中心的企業正在轉向提供綜合解決方案。
預計2019年至2024年間硬體成長速度將放緩,因為第一波部署已基本完成。營運商目前正透過軟體驅動的微調來提高盈利,而非大規模的設備升級。監理重點也正轉向ISO 3691-4定義的韌體安全檢查,更重視程式碼品質而非鋼材強度。隨著區域網路日趨成熟,硬體升級週期預計將會延長,而以軟體為中心的服務預計將獲得更多預算,並提高已部署設備的留存率。
預計到2025年,移動機器人將佔設備需求的33.22%,並有望在2031年之前以12.21%的複合年成長率成長。這些平台由於對固定基礎設施的要求極低,准入門檻較低,並且無需昂貴的維修即可在現有設施(棕地)中實現自動化通道。在亞太地區的物料輸送設備市場,自動化倉庫系統(ASRS)憑藉其高密度應用場景仍佔據主導地位,而輸送機在散裝物流中仍然至關重要。然而,自主移動機器人(AMR)憑藉其在SKU波動性高和SKU快速擴張環境中的卓越性能,正在不斷擴大市場佔有率。
從自動導引運輸車(AGV) 到能夠適應自然環境的自主移動機器人 (AMR) 的轉變,凸顯了人們對柔軟性的更廣泛偏好。 AMR 配備視覺感測器和人工智慧演算法,能夠產生自適應路徑,從而避開固定的引導路線。固定系統在盈利的細分市場中仍然具有價值,尤其是在那些對處理能力要求較高、變化頻率相對較低的市場。然而,研究數據證實,預算分配正轉向能夠與倉庫執行系統 (WES) 無縫整合的、軟體豐富的行動平台。符合 IEC 61508 功能安全標準也增強了受監管產業對行動解決方案的信心。
其他好處:
- Excel格式的市場預測(ME)表
- 3個月的分析師支持
目錄
第1章:引言
- 研究假設和市場定義
- 調查範圍
第2章:調查方法
第3章執行摘要
第4章 市場狀況
- 市場概覽
- 市場促進因素
- 加大對物流設施「工業4.0」的投資
- 電子商務履約中心的激增
- 倉庫運作中自主移動機器人的快速普及
- 亞太地區人事費用上升和勞動力短缺
- 東協政府對智慧工業園區的獎勵措施
- 透過整合 5G 專用網路實現即時車隊協調。
- 市場限制因素
- 整合自動化專案的初始資本投資規模
- 供應商生態系統之間互通性標準的局限性
- 新興經濟體港口基礎設施數位化落後
- 雲端管理物料輸送車輛的資料安全問題
- 產業價值鏈分析
- 監理情勢
- 技術展望
- 宏觀經濟因素的影響
- 波特五力分析
- 投資分析
第5章 市場規模與成長預測
- 依產品類型
- 硬體
- 軟體
- 服務
- 依設備類型
- 移動機器人
- 自動導引運輸車(AGV)
- 自動堆高機
- 自動牽引車/曳引機/拖輪
- 單元貨載
- 組裝
- 特殊用途
- 自主移動機器人(AMR)
- 雷射導引車輛
- 自動導引運輸車(AGV)
- 自動化倉庫系統(ASRS)
- 固定巷道式(堆垛機高機+接駁車系統)
- 旋轉木馬(水平旋轉木馬+垂直旋轉木馬)
- 垂直升降模組
- 自動輸送機
- 腰帶
- 滾筒
- 調色盤
- 開賣
- 堆垛機
- 傳統型(高位+低位)
- 機器人
- 分類系統
- 移動機器人
- 按最終用戶行業分類
- 飛機場
- 車
- 食品/飲料
- 零售/倉儲/配送/物流中心
- 一般製造業
- 製藥
- 郵件和小包裹
- 其他終端用戶產業
- 按載重能力
- 500公斤或以下
- 500 kg~1,500 kg
- 1500公斤或以上
- 導航技術
- 雷射導
- 視覺引導
- 磁帶/導線導
- 引導式山地地圖繪製(SLAM)
- 按地區
- 中國
- 日本
- 印度
- 韓國
- 澳洲
- 印尼
- 泰國
- 新加坡
- 馬來西亞
- 台灣
- 其他亞太國家
第6章 競爭情勢
- 市場集中度
- 策略趨勢
- 市佔率分析
- 公司簡介
- DAIFUKU Co., Ltd.
- Kardex Holding AG
- KION GROUP AG
- John Bean Technologies Corporation
- JUNGHEINRICH AG
- SSI SCHAEFER AG
- VisionNav Robotics Co., Ltd.
- System Logistics SpA
- BEUMER Group GmbH and Co. KG
- Interroll Holding AG
- WITRON Logistik and Informatik GmbH
- KUKA Aktiengesellschaft
- Honeywell International Inc.
- Murata Machinery, Ltd.
- Toyota Industries Corporation
- GreyOrange Pte. Ltd.
- Geekplus Technology Co., Ltd.
- Hyster-Yale Materials Handling, Inc.
- Mitsubishi Logisnext Co., Ltd.
- Shenzhen Casun Intelligent Robot Co., Ltd.
第7章 市場機會與未來展望
According to Mordor Intelligence, Asia Pacific automated material handling market size in 2026 is estimated at USD 33.54 billion, growing from 2025 value of USD 30.05 billion with 2031 projections showing USD 58.19 billion, growing at 11.62% CAGR over 2026-2031.
This report is Segmented by Product Type (Hardware, Software, and Services), Equipment Type (Mobile Robots, ASRS, and More), End-User Vertical (Airport, Automotive, and More), Payload Capacity (Up To 500 Kg, 500 Kg - 1, 500 Kg, and More), Navigation Technology (Laser Guidance, Vision Guidance, and More), and Geography. The Market Forecasts are Provided in Terms of Value (USD).
Asia Pacific Automated Material Handling Market Trends and Insights
Increasing Industry 4.0 Investments in Logistics Facilities
Regional manufacturers channel record budgets into cyber-physical upgrades that unite production lines, warehouse control systems, and enterprise software. China's annual smart-factory spend already exceeds USD 200 billion, while Japan's Society 5.0 program earmarks USD 130 billion for industrial IoT. These commitments translate directly into orders for autonomous tuggers, shuttles, and forklifts that synchronize material flows with real-time planning systems. Singapore's Smart Nation agenda shows how public co-investment catalyzes adoption: 40% of the city-state's warehouses had deployed autonomous mobile robots by 2024. Operators now view integrated material handling as a prerequisite for extracting promised Industry 4.0 efficiency gains.
Proliferation of E-Commerce Fulfillment Centers
Asia Pacific online retail penetration rose to 18.3% of total sales in 2024, outpacing all other regions. Massive order surges compress delivery windows, forcing fulfillment hubs to automate picking, sorting, and dispatch. China's 2024 Singles Day moved 1.48 billion parcels within 24 hours, a feat achievable only through high-throughput autonomous fleets. Platforms such as JD.com now operate more than 1,000 automated warehouses, prompting regional peers Shopee and Lazada to replicate similar robotics playbooks. Each new fulfillment node spurs parallel investments in upstream and downstream logistics sites, sustaining a virtuous demand cycle for autonomous solutions.
High Upfront Capex of Integrated Automation Projects
Deploying end-to-end systems often requires USD 2-5 million for a mid-size site, excluding building modifications and change-management costs. Indonesian warehouses earning under USD 10 million annually view such commitments as 25%-50% of yearly turnover. Financing channels remain limited, and robotics-as-a-service plans, while reducing entry fees, can inflate the total cost of ownership. Until equipment prices fall or credit access widens, smaller operators may delay adoption, moderating overall market growth.
Other drivers and restraints analyzed in the detailed report include:
- Rapid Adoption of Autonomous Mobile Robots in Warehousing
- Rising Labor Cost and Scarcity in the Asia Pacific
- Limited Interoperability Standards Across Vendor Ecosystems
For complete list of drivers and restraints, kindly check the Table Of Contents.
Segment Analysis
Hardware held 60.63% of the Asia Pacific automated material handling market share in 2025, reaffirming that physical assets still anchor operations. Yet software revenue will climb at a 13.32% CAGR through 2031 as enterprises pursue data-centric performance boosts. The autonomous material handling market size for software is projected to widen each year as predictive maintenance, energy optimization, and AI-based routing stack on top of existing fleets. Services revenues grow steadily because rising system complexity pushes demand for consulting, integration, and lifecycle support. Vendors such as KION expanded into software by acquiring Dematic, illustrating how mechanical-first firms pivot toward holistic solutions.
Hardware growth decelerates from the 2019-2024 period because many first-wave installations are complete. Operators now refine returns through software-enabled tweaks rather than large capital swaps. Regulatory focus also shifts toward firmware safety checks in ISO 3691-4, amplifying the value of code quality over steel strength. As regional networks mature, software-centric offerings should capture incremental budgets while hardware refresh cycles lengthen, deepening the installed base's stickiness.
Mobile robots controlled 33.22% of equipment demand in 2025 and will grow at a 12.21% CAGR through 2031. These platforms lower entry barriers because they require minimal fixed infrastructure, enabling brownfield sites to automate aisles without costly retrofits. Within the Asia Pacific automated material handling market size for equipment, automated storage and retrieval systems (ASRS) still corner high-density use cases, while conveyors remain indispensable for bulk flow. Nonetheless, AMRs win share by excelling in variable SKUs and rapid SKU expansion environments.
The shift from automated guided vehicles to natural-navigation AMRs underscores a broader preference for flexibility. AMRs equipped with vision sensors and AI algorithms plot adaptive routes, sidestepping rigid guidepaths. Fixed systems still serve profitable niches, especially where high throughput outweighs change frequency. Yet survey data confirm budget allocations moving toward software-rich mobile platforms that integrate seamlessly with warehouse execution systems. Compliance with IEC 61508 functional safety elevates trust in mobile options across regulated industries.
Complete Report Scope:
- By Product Type
- Hardware
- Software
- Services
- By Equipment Type
- Mobile Robots
- Automated Guided Vehicles (AGV)
- Automated Forklift
- Automated Tow / Tractor / Tug
- Unit Load
- Assembly Line
- Special Purpose
- Autonomous Mobile Robots (AMR)
- Laser Guided Vehicle
- Automated Guided Vehicles (AGV)
- Automated Storage and Retrieval System (ASRS)
- Fixed Aisle (Stacker Crane + Shuttle System)
- Carousel (Horizontal Carousel + Vertical Carousel)
- Vertical Lift Module
- Automated Conveyor
- Belt
- Roller
- Pallet
- Overhead
- Palletizer
- Conventional (High Level + Low Level)
- Robotic
- Sortation System
- Mobile Robots
- By End-User Vertical
- Airport
- Automotive
- Food and Beverage
- Retail / Warehousing / Distribution / Logistics Centers
- General Manufacturing
- Pharmaceuticals
- Post and Parcel
- Other End-User Verticals
- By Payload Capacity
- Up to 500 kg
- 500 kg - 1,500 kg
- Above 1,500 kg
- By Navigation Technology
- Laser Guidance
- Vision Guidance
- Magnetic Tape / Wire Guidance
- Natural Feature Guidance (SLAM)
- By Region
- China
- Japan
- India
- South Korea
- Australia
- Indonesia
- Thailand
- Singapore
- Malaysia
- Taiwan
- Rest of Asia Pacific
List of Companies Covered in this Report:
- DAIFUKU Co., Ltd.
- Kardex Holding AG
- KION GROUP AG
- John Bean Technologies Corporation
- JUNGHEINRICH AG
- SSI SCHAEFER AG
- VisionNav Robotics Co., Ltd.
- System Logistics S.p.A.
- BEUMER Group GmbH and Co. KG
- Interroll Holding AG
- WITRON Logistik and Informatik GmbH
- KUKA Aktiengesellschaft
- Honeywell International Inc.
- Murata Machinery, Ltd.
- Toyota Industries Corporation
- GreyOrange Pte. Ltd.
- Geekplus Technology Co., Ltd.
- Hyster-Yale Materials Handling, Inc.
- Mitsubishi Logisnext Co., Ltd.
- Shenzhen Casun Intelligent Robot Co., Ltd.
Additional Benefits:
- The market estimate (ME) sheet in Excel format
- 3 months of analyst support
TABLE OF CONTENTS
1 INTRODUCTION
- 1.1 Study Assumptions and Market Definition
- 1.2 Scope of the Study
2 RESEARCH METHODOLOGY
3 EXECUTIVE SUMMARY
4 MARKET LANDSCAPE
- 4.1 Market Overview
- 4.2 Market Drivers
- 4.2.1 Increasing Industry 4.0 Investments in Logistics Facilities
- 4.2.2 Proliferation of E-Commerce Fulfillment Centers
- 4.2.3 Rapid Adoption of Autonomous Mobile Robots in Warehousing
- 4.2.4 Rising Labor Cost and Scarcity in Asia Pacific
- 4.2.5 Government Incentives for Smart Industrial Parks in ASEAN
- 4.2.6 Integration of 5G Private Networks Enabling Real-Time Fleet Coordination
- 4.3 Market Restraints
- 4.3.1 High Upfront Capex of Integrated Automation Projects
- 4.3.2 Limited Interoperability Standards Across Vendor Ecosystems
- 4.3.3 Delayed Port Infrastructure Digitalization in Emerging Economies
- 4.3.4 Data Security Concerns in Cloud-Managed Material Handling Fleets
- 4.4 Industry Value Chain Analysis
- 4.5 Regulatory Landscape
- 4.6 Technological Outlook
- 4.7 Impact of Macroeconomic Factors
- 4.8 Porter's Five Forces Analysis
- 4.8.1 Threat of New Entrants
- 4.8.2 Bargaining Power of Buyers
- 4.8.3 Bargaining Power of Suppliers
- 4.8.4 Threat of Substitute Products
- 4.8.5 Intensity of Competitive Rivalry
- 4.9 Investment Analysis
5 MARKET SIZE AND GROWTH FORECASTS (VALUE)
- 5.1 By Product Type
- 5.1.1 Hardware
- 5.1.2 Software
- 5.1.3 Services
- 5.2 By Equipment Type
- 5.2.1 Mobile Robots
- 5.2.1.1 Automated Guided Vehicles (AGV)
- 5.2.1.1.1 Automated Forklift
- 5.2.1.1.2 Automated Tow / Tractor / Tug
- 5.2.1.1.3 Unit Load
- 5.2.1.1.4 Assembly Line
- 5.2.1.1.5 Special Purpose
- 5.2.1.2 Autonomous Mobile Robots (AMR)
- 5.2.1.3 Laser Guided Vehicle
- 5.2.1.1 Automated Guided Vehicles (AGV)
- 5.2.2 Automated Storage and Retrieval System (ASRS)
- 5.2.2.1 Fixed Aisle (Stacker Crane + Shuttle System)
- 5.2.2.2 Carousel (Horizontal Carousel + Vertical Carousel)
- 5.2.2.3 Vertical Lift Module
- 5.2.3 Automated Conveyor
- 5.2.3.1 Belt
- 5.2.3.2 Roller
- 5.2.3.3 Pallet
- 5.2.3.4 Overhead
- 5.2.4 Palletizer
- 5.2.4.1 Conventional (High Level + Low Level)
- 5.2.4.2 Robotic
- 5.2.5 Sortation System
- 5.2.1 Mobile Robots
- 5.3 By End-User Vertical
- 5.3.1 Airport
- 5.3.2 Automotive
- 5.3.3 Food and Beverage
- 5.3.4 Retail / Warehousing / Distribution / Logistics Centers
- 5.3.5 General Manufacturing
- 5.3.6 Pharmaceuticals
- 5.3.7 Post and Parcel
- 5.3.8 Other End-User Verticals
- 5.4 By Payload Capacity
- 5.4.1 Up to 500 kg
- 5.4.2 500 kg - 1,500 kg
- 5.4.3 Above 1,500 kg
- 5.5 By Navigation Technology
- 5.5.1 Laser Guidance
- 5.5.2 Vision Guidance
- 5.5.3 Magnetic Tape / Wire Guidance
- 5.5.4 Natural Feature Guidance (SLAM)
- 5.6 By Region
- 5.6.1 China
- 5.6.2 Japan
- 5.6.3 India
- 5.6.4 South Korea
- 5.6.5 Australia
- 5.6.6 Indonesia
- 5.6.7 Thailand
- 5.6.8 Singapore
- 5.6.9 Malaysia
- 5.6.10 Taiwan
- 5.6.11 Rest of Asia Pacific
6 COMPETITIVE LANDSCAPE
- 6.1 Market Concentration
- 6.2 Strategic Moves
- 6.3 Market Share Analysis
- 6.4 Company Profiles (includes Global level Overview, Market level Overview, Core Segments, Financials as available, Strategic Information, Market Rank/Share for key companies, Products and Services, and Recent Developments)
- 6.4.1 DAIFUKU Co., Ltd.
- 6.4.2 Kardex Holding AG
- 6.4.3 KION GROUP AG
- 6.4.4 John Bean Technologies Corporation
- 6.4.5 JUNGHEINRICH AG
- 6.4.6 SSI SCHAEFER AG
- 6.4.7 VisionNav Robotics Co., Ltd.
- 6.4.8 System Logistics S.p.A.
- 6.4.9 BEUMER Group GmbH and Co. KG
- 6.4.10 Interroll Holding AG
- 6.4.11 WITRON Logistik and Informatik GmbH
- 6.4.12 KUKA Aktiengesellschaft
- 6.4.13 Honeywell International Inc.
- 6.4.14 Murata Machinery, Ltd.
- 6.4.15 Toyota Industries Corporation
- 6.4.16 GreyOrange Pte. Ltd.
- 6.4.17 Geekplus Technology Co., Ltd.
- 6.4.18 Hyster-Yale Materials Handling, Inc.
- 6.4.19 Mitsubishi Logisnext Co., Ltd.
- 6.4.20 Shenzhen Casun Intelligent Robot Co., Ltd.
7 MARKET OPPORTUNITIES AND FUTURE OUTLOOK
- 7.1 White-Space and Unmet-Need Assessment

 2026-2030年全球自動化物料輸送(AMH)市場
 美國自動化物料輸送:市場佔有率分析、產業趨勢與統計、成長預測(2026-2031)
 冷氣動力噴塗設備市場分析及預測(至2035年):依類型、產品、服務、技術、組件、應用、材料類型、製程及最終用戶分類
 單元貨載系統市場規模、佔有率和成長分析:按產品類型、組件、應用、最終用戶、自動化程度和地區分類 - 產業預測,2026-2033 年亞太地區自動化物料輸送和儲存系統:市場佔有率分析、產業趨勢和統計數據以及成長預測(2026-2031 年)
 自動化物料輸送市場-全球市場預測(2026-2032年)北美自動化物料輸送:市場佔有率分析、產業趨勢與統計及成長預測(2026-2031 年)自動化物料輸送(AMH):市場佔有率分析、產業趨勢與統計資料、成長預測(2026-2031)
 小型貨梯市場規模、佔有率和成長分析:按產品類型、載重能力、應用、最終用戶、安裝類型、分銷管道和地區分類-2026-2033年產業預測
 智慧托盤化與裝載最佳化包裝市場,2034 年