


 |
市場調查報告書
商品編碼
2123394
資料中心互連:市場佔有率分析、產業趨勢與統計、成長預測(2026-2032)Data Center Interconnect - Market Share Analysis, Industry Trends & Statistics, Growth Forecasts (2026 - 2032) |
||||||

※ 本網頁內容可能與最新版本有所差異。詳細情況請與我們聯繫。
據 Mordor Intelligence 稱,2025 年資料中心互連市場價值為 162.4 億美元,預計將從 2026 年的 186.2 億美元成長到 2032 年的 424.5 億美元。
預測期(2026-2032 年)的複合年成長率預計為 14.73%。
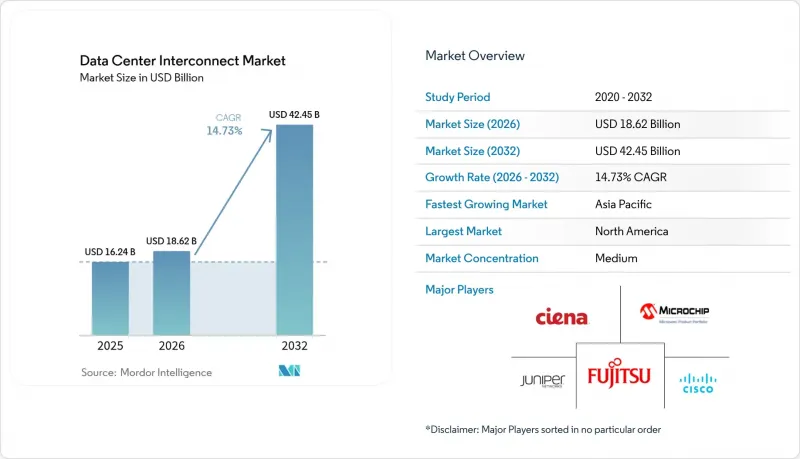
本報告按組件(硬體等)、連接類型(短距離等)、應用(災害復原等)、最終用戶產業(電信服務供應商等)和地區(北美等)進行細分。市場預測以美元計價。
全球資料中心互連市場趨勢與洞察
擴大邊緣和超大規模資料中心的覆蓋範圍
超大規模營運商正投入1800億美元用於分散式基礎設施建設,將運算資源部署得更靠近用戶,這迫使互連設計從傳統的星型拓撲結構轉向高密度網狀拓撲結構。亞馬遜1000億美元的擴張計劃和Meta 650億美元的項目便是這一轉變的例證。預計以37.9%的複合年成長率成長的邊緣微型設施需要節能的短距離光纖通訊設備和可程式設計路由,以便即時重新分配流量。營運商機房如今也扮演著邊緣節點的角色,雲端、內容和網路營運商在此匯聚,從而催生了對多租戶城域內鏈路的新需求。
人工智慧/高效能運算流量的激增需要超過 400 Gbps 的連結。
訓練人工智慧模型會產生「全對全」的流量模式,這種模式會使傳統的 100 Gbps 網路達到飽和。這種快速轉變在 2024 年尤其明顯,屆時 400G/800G光學模組的出貨量將超過 2,000 萬個。 NVIDIA 的 800G 光子交換器藍圖和 IEEE 800G 乙太網路標準清楚地表明,整個生態系統正在向連貫光技術轉型,目標是實現 1.6 Tbps 的通道速率。光子交換架構可以減少跳數和延遲,從而實現人工智慧叢集的擴展,而不會像傳統的脊葉樹架構那樣因過載而導致效能下降。
連貫光學技術和ROADM的高初始部署成本
先進的連貫路和可重構光加取多工器(ROADM)的價格比傳統設備高出300%,給中型業者的資本投資預算帶來了壓力。 ROADM市場預計到2026年將達到12億美元,反映出龐大的投資需求。對成本敏感的區域營運商正在推遲升級,導致全球部署日益兩極化的趨勢。
細分市場分析
預計到2025年,硬體收入將佔總收入的47.35%。這主要得益於業者採購高密度DWDM機架和連貫收發器,以支援資料中心互連市場。隨著控制器在頻寬化、延遲控制和容錯移轉自動化方面取得進展,軟體產業預計將實現16.12%的複合年成長率。致力於共封裝光元件的供應商正在將矽開關和嵌入式雷射融合在一起,以降低每位元功耗並縮小面積。服務收入也相應成長,反映了對設計、整合和生命週期支援的需求。
隨著人工智慧叢集的部署,資料中心互連硬體市場預計將會擴張,但可程式設計編配仍是一項策略差異化優勢。電信業者正在利用開放API將多廠商的光學模組整合到單一的基於意圖的架構中,從而將配置週期從數週縮短到數小時。
到2025年,短距離鏈路(小於80公里)將佔總收入的60.25%,這主要得益於城域園區、雲端接入點和營運商機房對高密度東西向頻寬的需求。隨著超大規模資料中心超大規模資料中心業者尋求跨區域容錯能力,預計長距離系統將以14.88%的複合年成長率加速成長。 1.6Tbps連貫平台能夠將更多容量整合到現有光纖中,從而推動長距離資料中心互連市場規模的擴大。
諸如「美杜莎」海底光纜之類的計畫正在開闢連接歐洲和非洲的新路徑,從而創造新的需求來源。同時,邊緣運算的成長支撐著短程流量,確保城域網路和骨幹網路領域之間資本投資的均衡配置。
區域分析
北美憑藉其高度集中的超大規模資料中心園區、先進的光纖走廊和充滿活力的開放原始碼生態系統,引領資料中心互連市場。達拉斯DE-CIX資料中心的400千兆乙太網路升級項目,象徵城域網路線路密度的不斷提升。在雄厚的創業投資資金和優惠的稅收政策支持下,美國正積極推動光子交換機的應用計畫。
亞太地區是成長最快的地區,預計到2033年,資料中心容量將成長兩倍,這主要得益於中國、日本、印度和東協市場對雲端服務的廣泛應用。中國對人工智慧的熱情以及5G的部署,正在加速短途城域網路和長途跨境網路的建設。
在歐洲,永續性法規與數位主權目標之間正尋求平衡。僅在德國,資料中心的價值預計到2029年將達到253億美元,高效的光纖通訊設備正在部署中,以回應歐盟的碳中和承諾。諸如2Africa之類的海底光纜正在提高容錯能力,並支援與中東和非洲樞紐的內容交換。
拉丁美洲正崛起為新的投資舞台,其中巴西的全部區域投資額的40%。 Brookfield尋求與Ascenty合作,進一步增強了人們對超大規模成長的信心。墨西哥克雷塔羅叢集正吸引許多尋求低於20毫秒延遲的大型雲端公司進軍美國市場。
在中東和非洲,獨具特色的AI和雲端舉措正在積極推進。在海灣國家,與太陽能發電廠相連的水冷資料中心正在部署中;同時,紅海沿岸的陸上線路以及在肯亞鋪設的新海底光纜正在擴大整個非洲大陸的覆蓋範圍。
其他好處:
- Excel格式的市場預測(ME)表
- 3個月的分析師支持
目錄
第1章:引言
- 研究假設和市場定義
- 調查範圍
第2章:調查方法
第3章執行摘要
第4章 市場狀況
- 市場概覽
- 市場促進因素
- 擴大邊緣和超大規模資料中心的覆蓋範圍
- 人工智慧/高效能運算流量的激增需要超過 400 Gbps 的連結。
- 商用 5G 的部署正在加速對低延遲回程傳輸的需求。
- 校園內引入水冷系統,促進了短距離光纖通訊領域的支出。
- 衛星地面站的共址部署創造了新的資料中心互連(DCI)節點。
- 強制性淨零排放目標正在推動光子交換結構的應用。
- 市場限制因素
- 連貫光學元件和ROADM的初始成本較高
- 與多廠商互通性和網路複雜性相關的挑戰
- 紡織建築業技術純熟勞工短缺
- 大都會圈。
- 價值供應鏈分析
- 監理情勢
- 技術展望
- 波特五力模型
第5章 市場規模與成長預測
- 按組件
- 硬體(DWDM、OTN、資料包)
- 軟體定義網路與控制
- 服務(託管、專業)
- 按連線類型
- 短距離
- 長途
- 透過使用
- 災害復原和業務永續營運
- 共用資料和資源的叢集
- 資料(儲存)移動性
- 其他用途
- 按最終用戶行業分類
- 電信服務供應商(CSP)
- 網路內容/營運商中立供應商 (ICP/CNP)
- 政府、研究和教育
- 其他行業
- 按地區
- 北美洲
- 美國
- 加拿大
- 墨西哥
- 南美洲
- 巴西
- 阿根廷
- 其他南美國家
- 歐洲
- 德國
- 英國
- 法國
- 俄羅斯
- 西班牙
- 義大利
- 其他歐洲國家
- 亞太地區
- 中國
- 日本
- 印度
- 韓國
- 澳洲和紐西蘭
- 其他亞太國家
- 中東和非洲
- 中東
- UAE
- 沙烏地阿拉伯
- 土耳其
- 其他中東國家
- 非洲
- 南非
- 奈及利亞
- 肯亞
- 其他非洲國家
- 中東
- 北美洲
第6章 競爭情勢
- 市佔率分析
- 公司簡介
- Ciena Corporation
- Cisco Systems Inc.
- Infinera Corporation
- Huawei Technologies Co. Ltd.
- Nokia Corporation(Nokia Networks)
- Juniper Networks Inc.
- ADVA Optical Networking SE
- Fujitsu Ltd.
- ZTE Corporation
- Arista Networks Inc.
- Ribbon Communications Inc.
- Pluribus Networks
- NVIDIA Corp.(Mellanox Networking)
- PacketLight Networks Ltd.
- Sterlite Technologies Ltd.(STL)
- Ekinops SA
- Megaport Ltd.
- Equinix Inc.
- Colt Technology Services Group Ltd.
- Microsemi Corporation
- PCCW Global Ltd.
第7章 市場機會與未來展望
According to Mordor Intelligence, the data center interconnect market size was valued at USD 16.24 billion in 2025 and estimated to grow from USD 18.62 billion in 2026 to reach USD 42.45 billion by 2032, at a CAGR of 14.73% during the forecast period (2026-2032).
This report is Segmented by Component (Hardware and More), Connectivity Type (Short-Haul and More), Application (Disaster Recovery and More), End-User Industry (Communication Service Providers and More), and Geography (North America and More). Market Forecasts are Provided in Terms of Value (USD).
Global Data Center Interconnect Market Trends and Insights
Expanding Edge and Hyperscale Data-Center Footprints
Hyperscale operators have earmarked USD 180 billion for distributed infrastructure that places compute close to users,forcing interconnect designs to support dense mesh topologies rather than hub-and-spoke layouts. Amazon's USD 100 billion expansion and Meta's USD 65 billion program typify this shift. Edge micro-facilities, projected to grow at a 37.9% CAGR, require power-efficient short-reach optics paired with programmable routing that can rebalance traffic in real time. Carrier hotels now double as edge nodes where cloud, content, and network operators converge, adding fresh demand for multi-tenant intra-metro links.
Surge in AI/HPC Traffic Requiring greater than 400 Gbps Links
AI model training generates all-to-all traffic patterns that saturate legacy 100 Gbps networks. Optical module shipments for 400G/800G exceeded 20 million units in 2024, underscoring aggressive migration timelines. NVIDIA's 800G photonic switch roadmap and IEEE's 800G Ethernet standard illustrate the ecosystem's pivot to coherent optics that push toward 1.6 Tbps lanes. Photonic switching fabrics reduce hop counts and latency, enabling AI clusters to scale without the oversubscription penalties of electrical spine-leaf trees.
High Upfront Cost of Coherent Optics and ROADMs
Advanced coherent engines and reconfigurable optical add-drop multiplexers (ROADMs) command premiums up to 300% over legacy gear, stretching capex budgets for mid-tier carriers. The ROADM market is projected at USD 1.2 billion by 2026, reflecting heavy investment needs. Operators in cost-sensitive regions postpone upgrades, reinforcing a two-tier global adoption pattern.
Other drivers and restraints analyzed in the detailed report include:
- Commercial 5G Roll-outs Accelerating Low-Latency Backhaul Demand
- Campus Liquid-Cooling Retrofits Boosting Short-Reach Optical Spend
- Shortage of Skilled Fiber-Construction Labor
For complete list of drivers and restraints, kindly check the Table Of Contents.
Segment Analysis
Hardware held 47.35% of 2025 revenue as operators procured dense DWDM shelves and coherent transceivers that underpin the data center interconnect market. The software tier will post a 16.12% CAGR as controllers automate bandwidth pooling, latency steering, and failover. Vendors pursuing co-packaged optics blend silicon switching with embedded lasers, lowering power per bit and shrinking footprints. Services revenue grows in tandem, reflecting demand for design, integration, and lifecycle support.
The data center interconnect market size for hardware is forecast to rise alongside AI cluster roll-outs, yet programmable orchestration remains the strategic differentiator. Operators use open APIs to stitch multi-vendor optics into a single intent-based fabric, cutting provisioning cycles from weeks to hours.
Short-haul links (< 80 km) delivered 60.25% of 2025 revenue because metro campuses, cloud on-ramps, and carrier hotels require dense east-west bandwidth. Long-haul systems will outpace with a 14.88% CAGR as hyperscalers pursue resilience across regions. The data center interconnect market size for long-haul will benefit from 1.6 Tbps coherent platforms that squeeze more capacity into existing fiber.
Projects such as the Medusa submarine cable add fresh routes linking Europe and Africa, creating new demand pools. Meanwhile, edge growth sustains short-haul volumes, ensuring balanced capex allocation between metro and backbone domains.
Complete Report Scope:
- by Component
- Hardware (DWDM, OTN, Packets)
- Software-Defined Networking and Control
- Services (Managed, Professional)
- by Connectivity Type
- Short-Haul
- Long-Haul
- by Application
- Disaster Recovery and Business Continuity
- Shared Data and Resource Clustering
- Data (Storage) Mobility
- Other Applications
- by End-user Industry
- Communication Service Providers (CSPs)
- Internet Content / Carrier-Neutral Providers (ICPs/CNPs)
- Government, Research and Education
- Other Verticals
- by Geography
- North America
- United States
- Canada
- Mexico
- South America
- Brazil
- Argentina
- Rest of South America
- Europe
- Germany
- United Kingdom
- France
- Russia
- Spain
- Italy
- Rest of Europe
- Asia-Pacific
- China
- Japan
- India
- South Korea
- Australia and New Zealand
- Rest of Asia-Pacific
- Middle East and Africa
- Middle East
- UAE
- Saudi Arabia
- Turkey
- Rest of Middle East
- Africa
- South Africa
- Nigeria
- Kenya
- Rest of Africa
- Middle East
- North America
Geography Analysis
North America leads the data center interconnect market owing to concentrated hyperscale campuses, advanced fiber corridors, and an active open-source ecosystem. DE-CIX Dallas's 400 GE upgrade highlights metro densification. U.S. projects spearhead photonic-switch adoption, aided by robust venture funding and favorable tax incentives.
Asia-Pacific is the fastest-growing region, with data-center capacity expected to triple by 2033 on the back of cloud adoption in China, Japan, India, and ASEAN markets. Domestic AI ambitions and 5G roll-outs accelerate both short-haul metro builds and cross-border long-haul corridors.
Europe balances sustainability rules and digital sovereignty objectives. Germany alone is projected to reach a USD 25.3 billion data-center valuation by 2029, purchasing high-efficiency optics to align with the EU's carbon-neutral pledge. Submarine cables such as 2Africa improve resilience, supporting content exchange with Middle Eastern and African hubs.
Latin America is a rising investment theater; Brazil accounts for 40% of regional spend, and Brookfield's search for an Ascenty partner underscores confidence in hyperscale growth. Mexico's Queretaro cluster attracts cloud majors seeking sub-20 ms latency to U.S. markets.
The Middle East and Africa pursue sovereign AI and cloud initiatives. Gulf states deploy liquid-cooled campuses tied to solar plants, while terrestrial routes along the Red Sea and new cable landings in Kenya widen continental reach.
- Ciena Corporation
- Cisco Systems Inc.
- Infinera Corporation
- Huawei Technologies Co. Ltd.
- Nokia Corporation (Nokia Networks)
- Juniper Networks Inc.
- ADVA Optical Networking SE
- Fujitsu Ltd.
- ZTE Corporation
- Arista Networks Inc.
- Ribbon Communications Inc.
- Pluribus Networks
- NVIDIA Corp. (Mellanox Networking)
- PacketLight Networks Ltd.
- Sterlite Technologies Ltd. (STL)
- Ekinops SA
- Megaport Ltd.
- Equinix Inc.
- Colt Technology Services Group Ltd.
- Microsemi Corporation
- PCCW Global Ltd.
Additional Benefits:
- The market estimate (ME) sheet in Excel format
- 3 months of analyst support
TABLE OF CONTENTS
1 INTRODUCTION
- 1.1 Study Assumptions and Market Definition
- 1.2 Scope of the Study
2 RESEARCH METHODOLOGY
3 EXECUTIVE SUMMARY
4 MARKET LANDSCAPE
- 4.1 Market Overview
- 4.2 Market Drivers
- 4.2.1 Expanding edge and hyperscale data-centre footprints
- 4.2.2 Surge in AI/HPC traffic requiring greater than 400 Gbps links
- 4.2.3 Commercial 5G roll-outs accelerating low-latency backhaul demand
- 4.2.4 Campus liquid-cooling retrofits boosting short-reach optical spend
- 4.2.5 Satellite ground-station colocation creating novel DCI nodes
- 4.2.6 Net-zero mandates driving adoption of photonic switching fabrics
- 4.3 Market Restraints
- 4.3.1 High upfront cost of coherent optics and ROADMs
- 4.3.2 Multi-vendor interoperability and network-complexity issues
- 4.3.3 Shortage of skilled fibre-construction labour
- 4.3.4 Municipal permitting delays for metro-haul trenching
- 4.4 Value / Supply-Chain Analysis
- 4.5 Regulatory Landscape
- 4.6 Technological Outlook
- 4.7 Porter's Five Forces
- 4.7.1 Bargaining Power of Suppliers
- 4.7.2 Bargaining Power of Consumers
- 4.7.3 Threat of New Entrants
- 4.7.4 Threat of Substitutes
- 4.7.5 Intensity of Competitive Rivalry
5 MARKET SIZE AND GROWTH FORECASTS (VALUE, USD BILLION)
- 5.1 by Component
- 5.1.1 Hardware (DWDM, OTN, Packets)
- 5.1.2 Software-Defined Networking and Control
- 5.1.3 Services (Managed, Professional)
- 5.2 by Connectivity Type
- 5.2.1 Short-Haul
- 5.2.2 Long-Haul
- 5.3 by Application
- 5.3.1 Disaster Recovery and Business Continuity
- 5.3.2 Shared Data and Resource Clustering
- 5.3.3 Data (Storage) Mobility
- 5.3.4 Other Applications
- 5.4 by End-user Industry
- 5.4.1 Communication Service Providers (CSPs)
- 5.4.2 Internet Content / Carrier-Neutral Providers (ICPs/CNPs)
- 5.4.3 Government, Research and Education
- 5.4.4 Other Verticals
- 5.5 by Geography
- 5.5.1 North America
- 5.5.1.1 United States
- 5.5.1.2 Canada
- 5.5.1.3 Mexico
- 5.5.2 South America
- 5.5.2.1 Brazil
- 5.5.2.2 Argentina
- 5.5.2.3 Rest of South America
- 5.5.3 Europe
- 5.5.3.1 Germany
- 5.5.3.2 United Kingdom
- 5.5.3.3 France
- 5.5.3.4 Russia
- 5.5.3.5 Spain
- 5.5.3.6 Italy
- 5.5.3.7 Rest of Europe
- 5.5.4 Asia-Pacific
- 5.5.4.1 China
- 5.5.4.2 Japan
- 5.5.4.3 India
- 5.5.4.4 South Korea
- 5.5.4.5 Australia and New Zealand
- 5.5.4.6 Rest of Asia-Pacific
- 5.5.5 Middle East and Africa
- 5.5.5.1 Middle East
- 5.5.5.1.1 UAE
- 5.5.5.1.2 Saudi Arabia
- 5.5.5.1.3 Turkey
- 5.5.5.1.4 Rest of Middle East
- 5.5.5.2 Africa
- 5.5.5.2.1 South Africa
- 5.5.5.2.2 Nigeria
- 5.5.5.2.3 Kenya
- 5.5.5.2.4 Rest of Africa
- 5.5.5.1 Middle East
- 5.5.1 North America
6 Competitive Landscape
- 6.1 Market Share Analysis
- 6.2 Company Profiles (includes Global-level Overview, Market-level Overview, Core Segments, Financials, Strategic Information, Market Rank/Share, Products and Services, Recent Developments)
- 6.2.1 Ciena Corporation
- 6.2.2 Cisco Systems Inc.
- 6.2.3 Infinera Corporation
- 6.2.4 Huawei Technologies Co. Ltd.
- 6.2.5 Nokia Corporation (Nokia Networks)
- 6.2.6 Juniper Networks Inc.
- 6.2.7 ADVA Optical Networking SE
- 6.2.8 Fujitsu Ltd.
- 6.2.9 ZTE Corporation
- 6.2.10 Arista Networks Inc.
- 6.2.11 Ribbon Communications Inc.
- 6.2.12 Pluribus Networks
- 6.2.13 NVIDIA Corp. (Mellanox Networking)
- 6.2.14 PacketLight Networks Ltd.
- 6.2.15 Sterlite Technologies Ltd. (STL)
- 6.2.16 Ekinops SA
- 6.2.17 Megaport Ltd.
- 6.2.18 Equinix Inc.
- 6.2.19 Colt Technology Services Group Ltd.
- 6.2.20 Microsemi Corporation
- 6.2.21 PCCW Global Ltd.
7 Market Opportunities and Future Outlook
- 7.1 White-space and Unmet-Need Assessment

 資料中心互連(DCI)路徑情報:市場佔有率分析、產業趨勢與統計資料、成長預測(2026-2031 年)
 全球資料中心互連市場:按產品、覆蓋範圍、資料速率、應用、最終用戶和地區分類-市場規模、產業動態、機會分析和預測(2026-2035 年)
 資料中心互連平台市場:按組件、技術、部署模式、頻寬、應用和最終用戶產業分類-2026-2032年全球市場預測
 CPO技術革命:人工智慧資料中心的下一代互連技術OLS市場關於跨資料中心連結的規模化最新趨勢資料中心互連市場:按類型、連接方式、應用、最終用途、國家及地區分類-全球產業分析、市場規模、市場佔有率及2026年至2033年預測
 全球資料中心互連(DCI)市場:機會與策略展望(至2035年)
 資料中心互連市場規模、佔有率和成長分析:按組件、技術、類型、組織規模、最終用戶和地區分類-2026-2033年產業預測資料中心耦合器市場:2026年至2032年全球市場預測(按層級、冷卻系統、機架密度、組件、功率容量和最終用戶分類)
 資料中心互連市場分析及預測(至2035年):類型、產品類型、服務、技術、元件、應用、部署模式、最終使用者、解決方案