


 |
市場調查報告書
商品編碼
2119556
資料中心互連(DCI)路徑情報:市場佔有率分析、產業趨勢與統計資料、成長預測(2026-2031 年)Data Center Interconnect Route Intelligence - Market Share Analysis, Industry Trends & Statistics, Growth Forecasts (2026 - 2031) |
||||||

※ 本網頁內容可能與最新版本有所差異。詳細情況請與我們聯繫。
根據 Mordor Intelligence 預測,資料中心互連 (DCI) 路徑智慧市場將從 2025 年的 5.7 億美元和 2026 年的 7.2 億美元成長到 2031 年的 18.1 億美元,2026 年至 2031 年的複合年成長率為 20.25%。
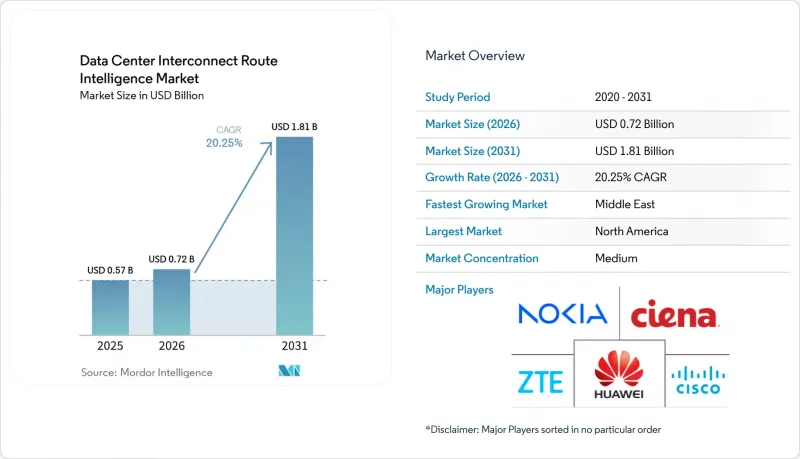
本報告按解決方案層(硬體和光纖傳輸、路由智慧軟體等)、連接媒體(暗纖等)、資料速率(最高可達 100G、400G、800G 等)、應用(工作負載和資料移動性等)、部署模式(企業自有資料中心互連等)以及地區進行細分。市場預測以美元計價。
全球資料中心互連 (DCI) 路徑智慧市場趨勢與洞察
人工智慧和高效能運算的可擴展跨平台部署
由於單一資料中心無法始終提供所需的電力、土地或運算能力,人工智慧訓練系統如今已不再局限於單一資料中心。據英偉達稱,Spectrum-XGS乙太網路在隔離站點之間實現了比標準乙太網路高出1.9倍的NCCL全縮減頻寬。 Meta設計了一個Prometheus叢集,預計容量為1GW,採用後端聚合技術,叢集間骨幹網路容量為每個區域對16-48Pbps。其設計採用了MACsec保護的BGP、連結頻寬屬性和不等價多路徑路由,確保路由決策在叢集內部完成。 KDDI也報告稱,在跨越30公里的分散式GPU訓練中,其完成時間與單一站點部署相當。因此,隨著電信業者優先考慮GPU利用率和作業完成率而非原始光吞吐量,資料中心互連(DCI)路由智慧市場將從中受益。
超大規模資料中心業者和新雲端的擴張
大規模雲端運算和人工智慧基礎設施專案正在催生對光鏈路和路由控制平台的集中訂單。由於規模龐大的容量規劃和通常集中的採購方式,自主人工智慧專案正在形成不同的採購模式。沙烏地阿拉伯的Human計畫在2034年建成6.6吉瓦的資料中心容量,目前正在建造一個200兆瓦的園區。阿拉伯聯合大公國的「星門」(Stargate)計劃在一個佔地19.2平方公里的場地內建造5吉瓦的容量,專案成本超過300億美元。這些趨勢增加了對園區、路由和服務供應商進行容量規劃的需求。資料中心互連(DCI)路由智慧市場受益於與供應商的多年合作關係,因為供應商必須在較短的部署週期內交付設備、軟體和整合服務。
光纖和路由基礎設施屬於高資本密集產業。
專用資料中心互連 (DCI) 網路需要大量的前期投資,包括土木工程、光纖通訊設備、路由設計和營運。據國際能源總署 (IEA) 稱,基礎設施項目的工期可能比計劃延長 20%,預算超支高達 80%。這些因素導致專用光纖路由的規劃延誤,並使小規模業者更加謹慎。此外,高容量網狀互連可能需要在新設施投入運作前進行大規模的網路升級。對於規模較小、無法將成本分攤到眾多地點的公司和區域營運商而言,這種限制尤其突出。因此,在資料中心互連 (DCI) 路由智慧市場中,由服務提供者管理的方案和基於託管的方案更受歡迎,因為這些模式允許將部分基礎設施成本轉移給專業服務提供者。
細分市場分析
2025年,硬體和光纖傳輸佔解決方案層營收的54.73%,佔據資料中心互連(DCI)路由智慧市場最大佔有率。該領域在ROADM部署、連貫電路系統升級、光放大器升級以及持續的波長擴展中繼續發揮核心作用。 Ciena公司、諾基亞公司和Coherent公司滿足了超大規模資料超大規模資料中心業者、營運商和主機服務供應商基於底盤和可插拔硬體的需求。隨著實體容量的擴展需要全站點規劃、安裝和測試,硬體需求也隨著多年投資計畫的實施而不斷演變。此外,由於企業和新型雲端服務供應商選擇外包日常路由管理,託管連線服務也從中受益。
預計到2031年,路由智慧軟體的複合年成長率將達到21.46%,成為該細分市場中成長最快的領域。買家越來越傾向於將策略感知路由、網路數位孿生和人工智慧遙測視為獨立於硬體升級之外的採購項目。 2026年1月,Smartoptics在其SoSmart平台中新增了光纖路由分析和改進的容量規劃功能,為營運商提供跨段損耗資訊和全網路由視圖。 Ciena也在2026年光纖通訊展(OFC 2026)上發表了基於代理的人工智慧功能,用於保障、路由和網路數位孿生檢驗。由OCI MSA推動的開放光通訊藍圖圖(Open Optics Roadmap )進一步促進了實體介面與流量控制軟體的分離。
到2025年,波長服務將佔連接介質收入的30.45%,在資料中心互連(DCI)路徑智慧市場中佔據最大佔有率。電信業者在需要為災害復原和可用區之間的連線提供延遲和運作服務等級保證時,會採用託管光路徑。對於希望建立私有光纖網路並直接控制容量的超大規模超大規模資料中心業者而言,暗纖仍然至關重要。電信級乙太網路繼續用於頻寬閾值較低的企業部署。海底光纜系統仍然是洲際雲連接的重要戰略介質,儘管規模縮小。微軟計劃部署15,000公里空中空光纖,顯示此類基礎設施項目是長期工程。
預計到2031年,IPoDWDM和路由光網路將以22.69%的複合年成長率成長,成為連接介質中成長最快的技術。該架構將IP路由和DWDM傳輸整合在單一平台上,減少了對獨立轉發器層的依賴。 IP Infusion發布了OcNOS 7.0,支援原生400G和800G ZR/ZR+光學模組,並提供分段路由功能,以在開放硬體上實現業務感知路徑。 2026年7月,1Finity更新了Virtuora,提供從L0到L3的雲端原生、多域、多廠商管理功能。這些工具使營運商能夠跨多個廠商的設備應用路由策略。
區域分析
到2025年,北美將佔全球收入的36.42%,在資料中心互連(DCI)路由智慧市場佔據最大的區域佔有率。美國憑藉著北維吉尼亞、達拉斯、鳳凰城和矽谷的資料中心活動,鞏固了這一地位。人工智慧叢集和多園區架構增加了這些地區對路由管理平台的需求。在加拿大,安大略省和魁北克省的擴張也帶動了需求成長。在墨西哥,路由功能透過毗鄰超大規模資料中心業者的早期專案向南擴展。聯邦能源監管委員會(FERC)的RM26-4指令透過將網路升級成本分配給高容量互連,影響了私營基礎設施的決策。
儘管歐洲和亞太地區對資料中心連接 (DCI) 的需求都十分顯著,但需求模式卻有所不同。德國、法國和荷蘭主要依賴高密度託管架構和跨境路由,以滿足資料主權的要求。 Ekinops 與 Proximus 簽署了一項為期 10 年的框架協議,為其覆蓋比利時 600 多個地點的 NEURON 網路提供支持,併計劃於 2026 年下半年進行初步部署。 2026 年 1 月,NTT-ME 推出了“日本高級直連全光子連接 (Japan Premium Direct Connect All-Photonics Connect)”,這是一條連接東京主要資料中心的低延遲、頻寬保證鏈路。中國採取了自主且垂直整合的方式來建構 AI 級 DCI 基礎設施,而印度、新加坡和澳洲的需求則因雲端運算的擴張而成長。
預計到2031年,中東地區的資料中心互連(DCI)路由智慧市場將以21.74%的複合年成長率成長,成為該市場規模成長最快的地區。 Stargate UAE計劃在阿布達比建置5吉瓦的資料中心,微軟計畫在2029年在阿拉伯聯合大公國投資總計152億美元。沙烏地阿拉伯的Human公司已開始建造一個200兆瓦的園區,目標是到2034年達到6.6吉瓦。這些項目將需要龐大的DCI容量以及新設施之間的協調路由規劃。非洲的DCI仍處於起步階段,南非、埃及、肯亞和奈及利亞的發展得益於海底光纜登陸站和企業雲的普及。目前,非洲的路由智慧應用主要集中在一級運營商的部署。
其他好處:
- Excel格式的市場預測(ME)表
- 3個月的分析師支持
目錄
第1章:引言
- 研究假設和市場定義
- 調查範圍
第2章:調查方法
第3章執行摘要
第4章 市場狀況
- 市場概覽
- 市場促進因素
- 擴大人工智慧和高效能運算的應用規模
- 超大規模資料中心業者和新雲端的擴張
- 向 400G、800G 和 1.6T連貫互連過渡
- 雲端可用性、跨區域複製和業務永續營運
- 邊緣運算、5G 和分散式資料中心的成長
- 考慮路線的韌性和國家基礎設施規劃
- 市場限制因素
- 光纖通訊和網路基礎設施屬於高資本密集產業。
- 對光纖、電力和授權的限制
- 多廠商互通性和操作複雜性
- 與根級安全、主權和資料儲存位置相關的風險
- 宏觀經濟因素對市場的影響
- 產業價值鏈分析
- 監理情勢
- 技術展望
- 波特五力分析
第5章 市場規模與成長預測
- 解決方案層
- 硬體和光纖傳輸
- 路線智慧軟體
- 託管連線服務
- 專業服務與整合
- 透過連接介質
- 暗纖
- 波長服務
- 電信級乙太網路
- IPoDWDM與路由光纖網路
- 海底電纜系統
- 按數據速率
- 最大 100G
- 200G 和 300G
- 400G
- 800G
- 1.6噸或以上
- 透過使用
- 即時災害復原和業務永續營運
- 共用資料和資源的叢集
- 工作負載和資料便攜性
- AI叢集聯邦和GPU規模
- 雲端可用區之間的互連
- 按部署模式
- 公司所有 DCI
- 提供者管理的 DCI
- 共置型 DCI
- 混合和多重雲端中心基礎設施
- 按地區
- 北美洲
- 美國
- 加拿大
- 墨西哥
- 南美洲
- 巴西
- 智利
- 阿根廷
- 其他南美國家
- 歐洲
- 德國
- 英國
- 法國
- 荷蘭
- 俄羅斯
- 其他歐洲國家
- 亞太地區
- 中國
- 印度
- 日本
- 新加坡
- 澳洲
- 其他亞太國家
- 中東
- 阿拉伯聯合大公國
- 沙烏地阿拉伯
- 卡達
- 土耳其
- 其他中東國家
- 非洲
- 南非
- 埃及
- 肯亞
- 奈及利亞
- 其他非洲國家
- 北美洲
第6章 競爭情勢
- 市場集中度
- 策略趨勢
- 市佔率分析
- 公司簡介
- Ciena Corporation
- Nokia Oyj
- Huawei Technologies Co., Ltd.
- ZTE Corporation
- Cisco Systems, Inc.
- Juniper Networks, Inc.
- Ekinops SA
- ADTRAN Holdings, Inc.
- Ribbon Communications Inc.
- Smartoptics Group AS
- PacketLight Networks Ltd.
- Lumentum Holdings Inc.
- Coherent Corp.
- Fujitsu Limited
- Arista Networks, Inc.
- Broadcom Inc.
- NVIDIA Corporation
第7章 市場機會與未來展望
According to Mordor Intelligence, the data center interconnect route intelligence market size is projected to expand from USD 0.57 billion in 2025 and USD 0.72 billion in 2026 to USD 1.81 billion by 2031, registering a CAGR of 20.25% between 2026 and 2031.
This report is Segmented by Solution Layer (Hardware and Optical Transport, Route-Intelligence Software, and More), Connectivity Medium (Dark Fiber, and More), Data Rate (Up To 100G, 400G, 800G, and More), Application (Workload and Data Mobility, and More), Deployment Model (Enterprise-Owned DCI, and More), and Geography. The Market Forecasts are Provided in Terms of Value (USD).
Global Data Center Interconnect Route Intelligence Market Trends and Insights
AI and HPC Scale-Across Deployments
AI training systems now extend across more than 1 data center because individual facilities cannot always provide the required power, land, or compute capacity. NVIDIA reported that Spectrum-XGS Ethernet delivered up to 1.9 times higher NCCL all-reduce bandwidth than standard Ethernet across separated sites. Meta designed its Prometheus cluster for 1 GW of planned capacity and used backend aggregation with 16-48 Pbps of inter-cluster backbone capacity for each regional pair. Its design used MACsec-secured BGP, link-bandwidth attributes, and unequal-cost multipath routing to place route decisions within the cluster fabric. KDDI also reported that distributed GPU training across 30 km achieved completion times comparable to those of a single-site deployment. The data center interconnect route intelligence market, therefore, benefits when operators prioritize GPU use and job completion over raw optical throughput.
Hyperscaler and Neocloud Expansion
Large cloud and AI infrastructure programs are creating concentrated orders for optical links and route-control platforms. Sovereign AI projects add a different buying pattern because their capacity plans are large and their procurement is often centralized. Saudi Arabia's Humain targeted 6.6 GW of data-center capacity by 2034, with initial construction of a 200 MW campus underway. Stargate UAE targeted 5 GW of capacity across a 19.2-square-kilometer site, with project cost exceeding USD 30 billion. These developments increase the need for capacity planning across campuses, routes, and service providers. The data center interconnect route intelligence market gains from multi-year supplier relationships because providers must deliver equipment, software, and integration services within short implementation windows.
High Capital Intensity of Optical and Route Infrastructure
Private DCI networks require significant upfront investment in civil works, optical equipment, route design, and operations. The International Energy Agency stated that infrastructure projects can take 20% longer than planned and can exceed budgets by up to 80%. These conditions can delay plans for dedicated optical routes and make smaller operators more cautious. Large-load grid interconnections can also require substantial network upgrades before new facilities can operate. The restraint is strongest for enterprises and regional carriers that lack the scale to spread costs across many sites. This has supported provider-managed and colocation-based options in the data center interconnect route intelligence market, as these models shift some infrastructure costs to specialized providers.
Other drivers and restraints analyzed in the detailed report include:
- Migration to 400G, 800G, and 1.6T Coherent Interconnects
- Cloud Availability-Zone Replication and Business Continuity
- Fiber, Power, and Permitting Constraints
For complete list of drivers and restraints, kindly check the Table Of Contents.
Segment Analysis
Hardware and Optical Transport accounted for 54.73% of solution-layer revenue in 2025, making it the largest share of the data center interconnect route intelligence market. The segment remained central to ROADM deployments, coherent line-system upgrades, optical amplifier refreshes, and continued wavelength additions. Ciena Corporation, Nokia Oyj, and Coherent Corp. served the chassis-based and pluggable hardware requirements of hyperscalers, carriers, and colocation providers. Hardware demand followed multiyear investment programs because physical capacity additions require planning, installation, and testing across sites. Managed Connectivity Services also benefited when enterprises and neocloud operators chose to outsource day-to-day route management.
Route-Intelligence Software is projected to grow at a 21.46% CAGR through 2031, the fastest rate in this segmentation. Buyers are increasingly treating policy-aware routing, network digital twins, and AI-supported telemetry as purchases that are separate from hardware upgrades. Smartoptics added Fiber Route Analysis and improved capacity planning to its SoSmart platform in January 2026, giving operators span-level loss information and route views across their networks. Ciena also presented agentic AI capabilities for assurance, routing, and network-digital-twin validation at OFC 2026. The open optical roadmap advanced by the OCI MSA further supports a separation between physical interfaces and the software used to control traffic.
Wavelength Services held 30.45% of connectivity-medium revenue in 2025, the largest share within this segmentation of the data center interconnect route intelligence market. Operators used managed optical paths when disaster recovery and availability-zone connections required service-level commitments for latency and uptime. Dark Fiber remained important for hyperscalers that built private optical networks and wanted direct control over capacity. Carrier Ethernet continued to serve enterprise deployments at lower bandwidth thresholds. Submarine Cable Systems remained a smaller but strategically important medium for intercontinental cloud connectivity. Microsoft's planned 15,000 km deployment of hollow-core fiber illustrated the long-cycle nature of such infrastructure programs.
IPoDWDM and Routed Optical Networking are expected to expand at a 22.69% CAGR through 2031, the highest rate among connectivity mediums. The architecture combines IP routing and DWDM transmission on 1 platform, reducing reliance on separate transponder layers. IP Infusion released OcNOS 7.0 with native 400G and 800G ZR and ZR+ optics, along with segment-routing features for service-aware paths on open hardware. 1Finity updated Virtuora in July 2026 to provide cloud-native, multi-domain and multi-vendor management from L0 through L3. These tools allow operators to apply route policies across equipment from more than 1 vendor.
Complete Report Scope:
- By Solution Layer
- Hardware and Optical Transport
- Route-Intelligence Software
- Managed Connectivity Services
- Professional Services and Integration
- By Connectivity Medium
- Dark Fiber
- Wavelength Services
- Carrier Ethernet
- IPoDWDM and Routed Optical Networking
- Submarine Cable Systems
- By Data Rate
- Up to 100G
- 200G and 300G
- 400G
- 800G
- 1.6T and Above
- By Application
- Real-Time Disaster Recovery and Business Continuity
- Shared Data and Resource Clustering
- Workload and Data Mobility
- AI Cluster Federation and GPU Scale-Across
- Cloud Availability-Zone Interconnection
- By Deployment Model
- Enterprise-Owned DCI
- Provider-Managed DCI
- Colocation-Based DCI
- Hybrid and Multi-Cloud DCI
- By Geography
- North America
- United States
- Canada
- Mexico
- South America
- Brazil
- Chile
- Argentina
- Rest of South America
- Europe
- Germany
- United Kingdom
- France
- Netherlands
- Russia
- Rest of Europe
- Asia-Pacific
- China
- India
- Japan
- Singapore
- Australia
- Rest of Asia-Pacific
- Middle East
- United Arab Emirates
- Saudi Arabia
- Qatar
- Turkey
- Rest of Middle East
- Africa
- South Africa
- Egypt
- Kenya
- Nigeria
- Rest of Africa
- North America
Geography Analysis
North America accounted for 36.42% of global revenue in 2025 and held the largest regional share of the data center interconnect route intelligence market. The United States supported most of this position through data-center activity in Northern Virginia, Dallas, Phoenix, and Silicon Valley. AI clusters and multi-campus architectures increased demand for route-management platforms in these locations. Canada added demand through expansion in Ontario and Quebec. Mexico extended routes southward through early hyperscaler-adjacent projects. FERC's RM26-4 order affected private infrastructure decisions by assigning the costs of network upgrades to large-load interconnections.
Europe and Asia-Pacific showed different demand patterns, although both had significant DCI requirements. Germany, France, and the Netherlands relied on dense colocation fabrics and cross-border routes shaped by data-sovereignty requirements. Ekinops secured a 10-year framework agreement with Proximus for the NEURON network across more than 600 Belgian sites, with initial deployment planned for the second half of 2026. NTT-ME launched Japan Premium Direct Connect All-Photonics Connect in January 2026 for low-latency, bandwidth-guaranteed links between major Tokyo data centers. China adopted a sovereign and vertically integrated approach to AI-grade DCI infrastructure, while India, Singapore, and Australia added demand through cloud expansion.
The Middle East is projected to grow at a 21.74% CAGR through 2031 and is the fastest-growing geography in the data center interconnect route intelligence market size. Stargate UAE targeted 5 GW of data-center capacity in Abu Dhabi, and Microsoft planned total UAE investment of USD 15.2 billion through 2029. Saudi Arabia's Humain targeted 6.6 GW by 2034 and began work on 200 MW campuses. These projects require large volumes of DCI capacity and coordinated route planning across new facilities. Africa remained an early-stage DCI region, with South Africa, Egypt, Kenya, and Nigeria supported by cable landing stations and enterprise cloud adoption. Route-intelligence use in Africa remained concentrated in tier-1 carrier deployments.
- Ciena Corporation
- Nokia Oyj
- Huawei Technologies Co., Ltd.
- ZTE Corporation
- Cisco Systems, Inc.
- Juniper Networks, Inc.
- Ekinops S.A.
- ADTRAN Holdings, Inc.
- Ribbon Communications Inc.
- Smartoptics Group AS
- PacketLight Networks Ltd.
- Lumentum Holdings Inc.
- Coherent Corp.
- Fujitsu Limited
- Arista Networks, Inc.
- Broadcom Inc.
- NVIDIA Corporation
Additional Benefits:
- The market estimate (ME) sheet in Excel format
- 3 months of analyst support
TABLE OF CONTENTS
1 INTRODUCTION
- 1.1 Study Assumptions and Market Definition
- 1.2 Scope of the Study
2 RESEARCH METHODOLOGY
3 EXECUTIVE SUMMARY
4 MARKET LANDSCAPE
- 4.1 Market Overview
- 4.2 Market Drivers
- 4.2.1 AI and HPC Scale-Across Deployments
- 4.2.2 Hyperscaler and Neocloud Expansion
- 4.2.3 Migration to 400G, 800G, and 1.6T Coherent Interconnects
- 4.2.4 Cloud Availability-Zone Replication and Business Continuity
- 4.2.5 Edge, 5G, and Distributed Data Center Growth
- 4.2.6 Route-Aware Resilience and Sovereign Infrastructure Planning
- 4.3 Market Restraints
- 4.3.1 High Capital Intensity of Optical and Route Infrastructure
- 4.3.2 Fiber, Power, and Permitting Constraints
- 4.3.3 Multi-Vendor Interoperability and Operational Complexity
- 4.3.4 Route-Level Security, Sovereignty, and Data-Residency Exposure
- 4.4 Impact of Macroeconomic Factors on the Market
- 4.5 Industry Value Chain Analysis
- 4.6 Regulatory Landscape
- 4.7 Technological Outlook
- 4.8 Porter's Five Forces Analysis
- 4.8.1 Threat of New Entrants
- 4.8.2 Bargaining Power of Suppliers
- 4.8.3 Bargaining Power of Buyers
- 4.8.4 Threat of Substitutes
- 4.8.5 Competitive Rivalry
5 MARKET SIZE AND GROWTH FORECASTS (VALUE)
- 5.1 By Solution Layer
- 5.1.1 Hardware and Optical Transport
- 5.1.2 Route-Intelligence Software
- 5.1.3 Managed Connectivity Services
- 5.1.4 Professional Services and Integration
- 5.2 By Connectivity Medium
- 5.2.1 Dark Fiber
- 5.2.2 Wavelength Services
- 5.2.3 Carrier Ethernet
- 5.2.4 IPoDWDM and Routed Optical Networking
- 5.2.5 Submarine Cable Systems
- 5.3 By Data Rate
- 5.3.1 Up to 100G
- 5.3.2 200G and 300G
- 5.3.3 400G
- 5.3.4 800G
- 5.3.5 1.6T and Above
- 5.4 By Application
- 5.4.1 Real-Time Disaster Recovery and Business Continuity
- 5.4.2 Shared Data and Resource Clustering
- 5.4.3 Workload and Data Mobility
- 5.4.4 AI Cluster Federation and GPU Scale-Across
- 5.4.5 Cloud Availability-Zone Interconnection
- 5.5 By Deployment Model
- 5.5.1 Enterprise-Owned DCI
- 5.5.2 Provider-Managed DCI
- 5.5.3 Colocation-Based DCI
- 5.5.4 Hybrid and Multi-Cloud DCI
- 5.6 By Geography
- 5.6.1 North America
- 5.6.1.1 United States
- 5.6.1.2 Canada
- 5.6.1.3 Mexico
- 5.6.2 South America
- 5.6.2.1 Brazil
- 5.6.2.2 Chile
- 5.6.2.3 Argentina
- 5.6.2.4 Rest of South America
- 5.6.3 Europe
- 5.6.3.1 Germany
- 5.6.3.2 United Kingdom
- 5.6.3.3 France
- 5.6.3.4 Netherlands
- 5.6.3.5 Russia
- 5.6.3.6 Rest of Europe
- 5.6.4 Asia-Pacific
- 5.6.4.1 China
- 5.6.4.2 India
- 5.6.4.3 Japan
- 5.6.4.4 Singapore
- 5.6.4.5 Australia
- 5.6.4.6 Rest of Asia-Pacific
- 5.6.5 Middle East
- 5.6.5.1 United Arab Emirates
- 5.6.5.2 Saudi Arabia
- 5.6.5.3 Qatar
- 5.6.5.4 Turkey
- 5.6.5.5 Rest of Middle East
- 5.6.6 Africa
- 5.6.6.1 South Africa
- 5.6.6.2 Egypt
- 5.6.6.3 Kenya
- 5.6.6.4 Nigeria
- 5.6.6.5 Rest of Africa
- 5.6.1 North America
6 COMPETITIVE LANDSCAPE
- 6.1 Market Concentration
- 6.2 Strategic Moves
- 6.3 Market Share Analysis
- 6.4 Company Profiles (includes Global Level Overview, Market Level Overview, Core Segments, Financials as available, Strategic Information, Market Rank/Share, Products and Services, Recent Developments)
- 6.4.1 Ciena Corporation
- 6.4.2 Nokia Oyj
- 6.4.3 Huawei Technologies Co., Ltd.
- 6.4.4 ZTE Corporation
- 6.4.5 Cisco Systems, Inc.
- 6.4.6 Juniper Networks, Inc.
- 6.4.7 Ekinops S.A.
- 6.4.8 ADTRAN Holdings, Inc.
- 6.4.9 Ribbon Communications Inc.
- 6.4.10 Smartoptics Group AS
- 6.4.11 PacketLight Networks Ltd.
- 6.4.12 Lumentum Holdings Inc.
- 6.4.13 Coherent Corp.
- 6.4.14 Fujitsu Limited
- 6.4.15 Arista Networks, Inc.
- 6.4.16 Broadcom Inc.
- 6.4.17 NVIDIA Corporation
7 MARKET OPPORTUNITIES AND FUTURE OUTLOOK
- 7.1 White-Space and Unmet-Need Assessment

 資料中心互連:市場佔有率分析、產業趨勢與統計、成長預測(2026-2032)
 全球資料中心互連市場:按產品、覆蓋範圍、資料速率、應用、最終用戶和地區分類-市場規模、產業動態、機會分析和預測(2026-2035 年)
 資料中心互連平台市場:按組件、技術、部署模式、頻寬、應用和最終用戶產業分類-2026-2032年全球市場預測
 CPO技術革命:人工智慧資料中心的下一代互連技術OLS市場關於跨資料中心連結的規模化最新趨勢資料中心互連市場:按類型、連接方式、應用、最終用途、國家及地區分類-全球產業分析、市場規模、市場佔有率及2026年至2033年預測
 全球資料中心互連(DCI)市場:機會與策略展望(至2035年)
 資料中心互連市場規模、佔有率和成長分析:按組件、技術、類型、組織規模、最終用戶和地區分類-2026-2033年產業預測資料中心耦合器市場:2026年至2032年全球市場預測(按層級、冷卻系統、機架密度、組件、功率容量和最終用戶分類)
 資料中心互連市場分析及預測(至2035年):類型、產品類型、服務、技術、元件、應用、部署模式、最終使用者、解決方案