


 |
市場調查報告書
商品編碼
2123314
超大規模資料中心:市場佔有率分析、產業趨勢與統計、成長預測(2026-2031)Hyperscale Data Center - Market Share Analysis, Industry Trends & Statistics, Growth Forecasts (2026 - 2031) |
||||||

※ 本網頁內容可能與最新版本有所差異。詳細情況請與我們聯繫。
根據 Mordor Intelligence 預測,超大規模資料中心市場規模預計將在 2026 年達到 2,054.8 億美元,到 2031 年達到 5,961 億美元,複合年成長率為 23.74%。
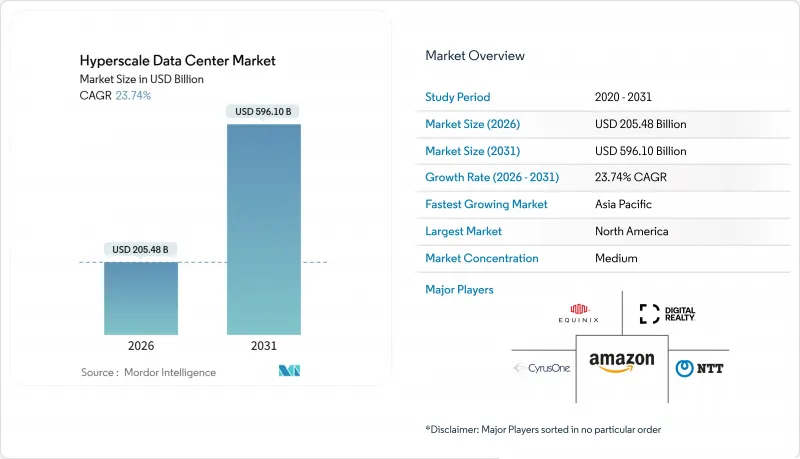
本報告按組件(IT基礎設施、電氣基礎設施、機械基礎設施、一般建築)、等級(三級、四級)和地區(北美、歐洲、亞太、南美、中東和非洲)進行細分。市場預測以美元計價。
全球超大規模資料中心市場趨勢及洞察
以 GPU 為中心的 AI 和 ML 工作負載爆炸性地成長,需要超過 50 千瓦的機架。
大規模語言模型的訓練已使機架負載遠超過 50 千瓦,使得空氣冷卻在這種負載水平下不再經濟。阿里雲預計在 2025 年連續九個季度實現人工智慧產品銷售額三位數成長,凸顯了市場對 GPU 密集容量的持續高需求。美國超大規模資料中心業者正在為 100 千瓦機櫃採用「晶片級」液冷和後門式熱交換器,從而縮短液冷基礎設施的投資回收期。這些措施減少了閒置容量,提高了電源效率,並將競爭優勢轉移到了掌控液冷供應鏈的供應商手中。無法快速維修的資料中心正在失去人工智慧訓練工作競標的競標機會,並在超大規模資料中心市場中失去市場佔有率。
歐洲超大規模雲端供應商的自主雲端部署
歐洲各國政府如今要求本國營業單位管理敏感數據,促使亞馬遜網路服務 (AWS)、微軟 Azure 和Google雲端在德國、法國和荷蘭建立主權環境。遵守 GDPR、德國 BSI C5 和法國 SecNumCloud 等框架推高了建設成本並延長了專案工期,但也使企業能夠向受監管的租戶提供更高的定價。黑石集團與 Digital Realty 投資 70 億美元在法蘭克福和巴黎推出園區,這清楚地表明了滿足這些監管要求所需的資本重新配置規模。擅長獲得當地授權和與電網談判的營運商正在獲得利潤豐厚的主權租賃協議,從而推動整個超大規模資料中心市場的成長。
乾旱地區對蒸發冷卻用水的限制
加州、亞利桑那州和內華達州的嚴重乾旱迫使水務部門限制工業用水量。西班牙埃布羅河流域在2024年水位創歷史新低後也實施了類似的限制措施,迫使資料中心遷移到封閉回路型液冷系統,而這些系統的安裝和營運成本更高。沒有長期再生水供應合約的設施在夏季高峰期可能面臨用水限制,這可能會危及服務等級協定 (SLA) 的履行。因此,新計畫優先考慮再生水、沿海海水淡化或風冷式冷卻器,這增加了資本成本,並減緩了超大規模資料中心市場的成長。
細分市場分析
預計2026年至2031年間,電力基礎設施市場將以24.65%的複合年成長率成長,增速將超過整個超大規模資料中心市場,因為營運商正在對其配電系統進行現代化改造,以適應50-100千瓦的機架。隨著不斷電系統(UPS)、鋰離子電池組和模組化開關設備在GPU叢集變得至關重要,分配給超大規模資料中心的電力基礎設施市場規模預計將迅速擴大。伊頓的9395XC UPS額定功率為2250千瓦,可擴展至3兆瓦,是滿足超大規模資料中心業者企業對高密度、低維護備用電源需求的理想選擇。預計到2025年, IT基礎設施將佔總營收的48.43%,但由於加速器成本攤提導致伺服器更換週期延長,其相對成長動能正在放緩。在機械基礎設施領域,晶片直接冷卻技術的普及正在推進,雖然初始投資增加,但透過提高能源效率降低了長期營運成本。儘管鋼材價格波動和技術純熟勞工短缺持續擠壓著建築業的利潤空間,但資料中心資訊管理軟體正透過利用閒置產能擴大市場佔有率。
電信業者認為,提前18-24個月預訂電氣設備至關重要,這樣可以在銅和半導體等原料成本進一步上漲之前鎖定價格。提供工廠整合電源撬裝設備和現場試運行前置作業時間的供應商能夠確保較高的利潤率。同時,超大規模資料中心業者正在透過群眾外包方式公開母線槽和電池化學成分的規範,以避免被特定供應商鎖定,這給通用組件的利潤率帶來了壓力。因此,擁有強大服務組合和可快速部署模組的電氣基礎設施供應商在預測期內預計將擴大其在超大規模資料中心市場的佔有率。
區域分析
預計到2025年,北美將佔據超大規模資料中心市場40.43%的佔有率,主要得益於維吉尼亞北部前所未有的光纖密度和強大的電網互聯。亞馬遜網路服務(AWS)、微軟和谷歌持續推出巨型園區,以及黑石集團250億美元的開發平臺,進一步鞏固了該地區的全球主導地位。然而,美國西南部對冷卻水使用的限制以及加州與高溫相關的授權延誤,正促使新建設轉向太平洋西北地區和德克薩斯州,這些地區擁有豐富的水力資源和自由化的電力市場,能夠提供更低的均衡成本。租賃趨勢顯示,超大規模資料超大規模資料中心業者正在預先鎖定整個100兆瓦的容量,這推動了零售託管需求,同時也鞏固了可再生能源購電協議。
亞太地區預計到2031年將維持24.57%的複合年成長率,這主要得益於中國人工智慧基礎設施的快速擴張、印度數位支付的蓬勃發展以及新加坡對自主雲端服務的需求。阿里巴巴承諾在三年內投資3,800億元人民幣(約530億美元),凸顯了中國致力於擴大國內運算規模的決心。在新加坡,土地稀缺和熱稅限制了新增供應,剩餘需求流向了柔佛和巴淡島。在印度,資料本地化法規和邦級激勵措施正在刺激孟買和棕地待開發區和改造Tier 4級資料中心。同時,在日本,現場可再生能源配額限制延長了東京和大阪的專案工期,導致成長重心轉移到電力供應充足的北海道和九州。總體而言,能夠獲得兆瓦級電力供應並成功應對各種授權製度的營運商將在不斷擴張的超大規模資料中心市場中佔據主導地位。
歐洲和中東/非洲地區正在出現不同的發展趨勢。歐洲的主權雲政策將需求分散到德國、法國、荷蘭和愛爾蘭等國,雖然提高了投資要求,但也允許了更高的定價。黑石集團和Digital Realty投資70億美元的合資企業清楚地表明了資本向受監管園區的集中。在中東,沙烏地阿拉伯的「NEOM數位谷」和阿拉伯聯合大公國的阿布達比叢集正利用稅收減免和快速授權吸引超大規模租戶,將該地區定位為洲際交通樞紐。南美洲以巴西為主導,其豐富的風能和太陽能資源符合碳中和目標,但外匯波動仍是一個障礙。在非洲,新興需求集中在南非和奈及利亞,其擴張取決於電網的發展和海底電纜的鋪設。這些趨勢共同構成了一個多極化的超大規模資料中心市場,每個地區都面臨著獨特的機會和風險。
其他好處:
- Excel格式的市場預測(ME)表
- 3個月的分析師支持
目錄
第1章:引言
- 研究假設和市場定義
- 調查範圍
第2章:調查方法
第3章執行摘要
第4章 市場狀況
- 市場概覽
- 市場促進因素
- 在美國和中國,以 GPU 為中心的 AI 和 ML 工作負載激增,需要超過 50 kW 的機架。
- 歐洲超大規模雲端供應商部署“主權雲端”
- 金融科技推動的強制性即時支付系統正在加速新加坡和印度對四級信用評級的需求。
- 5G邊緣網路和核心網路的融合,正在為北歐和大洋洲地區創造對區域樞紐的需求。
- 水冷式模組化撬裝設備可用於維修印度現有的設施。
- 沙烏地阿拉伯NEOM數位谷超大規模園區的稅收優惠
- 市場限制因素
- 美國西部和西班牙對蒸發冷卻用水的限制
- GPU供應鏈的瓶頸限制了機架級密度的擴展。
- 荷蘭、新加坡和德國提高了熱稅和碳排放稅。
- 日本新《綠色能源法》強制要求現場分配可再生能源
- 產業供應鏈分析
- 監理與合規展望
- 技術趨勢、水冷、晶片直噴、模組化配置
- 宏觀經濟因素對市場的影響
- 波特五力分析
第5章 市場規模與成長預測
- 按組件
- IT基礎設施
- 伺服器基礎架構
- 儲存基礎設備
- 網路基礎設施
- 電力基礎設施
- 配電單元
- 傳輸開關和開關設備
- UPS系統
- 發電機
- 其他電力基礎設施
- 機械基礎設施
- 冷卻系統
- 架子
- 其他機械基礎設施
- 一般建築
- 核心和外殼開發
- 安裝試運行服務
- 設計與工程
- 火災偵測、消防和物理安全
- DCIM/BMS解決方案
- IT基礎設施
- 層級特定
- 三級
- 第四級
- 按地區
- 北美洲
- 美國
- 加拿大
- 墨西哥
- 歐洲
- 英國
- 德國
- 荷蘭
- 法國
- 愛爾蘭
- 其他歐洲國家
- 亞太地區
- 中國
- 印度
- 新加坡
- 日本
- 澳洲
- 印尼
- 其他亞太國家
- 南美洲
- 巴西
- 智利
- 其他南美國家
- 中東和非洲
- 中東
- 阿拉伯聯合大公國
- 沙烏地阿拉伯
- 土耳其
- 其他中東國家
- 非洲
- 南非
- 奈及利亞
- 其他非洲國家
- 中東
- 北美洲
第6章 競爭情勢
- 市場集中度
- 策略趨勢
- 市佔率分析
- 公司簡介
- Digital Realty Trust, Inc.
- Equinix, Inc.
- Amazon Web Services, Inc.
- NTT Ltd.
- CyrusOne Inc.
- Quality Technology Services(QTS)
- Vantage Data Centers LLC
- Microsoft Corporation
- Alphabet Inc.(Google)
- Meta Platforms, Inc.
- Alibaba Group Holding Ltd.
- Tencent Holdings Ltd.
- Baidu, Inc.
- Oracle Corporation
- International Business Machines Corporation
- Switch, Inc.
- STACK Infrastructure
- Flexential Corp.
- Iron Mountain Data Centers
- OVHcloud
第7章 市場機會與未來展望
According to Mordor Intelligence, the hyperscale data center market size stands at USD 205.48 billion in 2026 and is projected to reach USD 596.10 billion by 2031, reflecting a 23.74% CAGR.
This report is Segmented by Component (IT Infrastructure, Electrical Infrastructure, Mechanical Infrastructure, and General Construction), Tier Type (Tier 3, and Tier 4), and Geography (North America, Europe, Asia-Pacific, South America, and Middle East and Africa). The Market Forecasts are Provided in Terms of Value (USD).
Global Hyperscale Data Center Market Trends and Insights
Exploding GPU-Centric AI and ML Workloads Requiring Greater Than 50 Kilowatt Racks
Training large language models is pushing per-rack loads well past 50 kilowatts, a level at which air cooling becomes economically untenable. Alibaba Cloud logged triple-digit AI product revenue growth for nine consecutive quarters in 2025, underscoring sustained appetite for GPU-dense capacity. U.S. hyperscalers are deploying direct-to-chip liquid cooling and rear-door heat exchangers that support 100-kilowatt cabinets, compressing the payback period on liquid infrastructure investments. These deployments shrink stranded capacity and improve power-usage efficiency, shifting competitive advantage toward operators that master liquid-cooling supply chains. Facilities that cannot retrofit quickly are losing bids for AI training workloads, eroding their share of the hyperscale data center market.
Hyperscale Cloud Providers' Sovereign-Cloud Roll-outs in Europe
European governments now require nationally domiciled entities to control sensitive data, prompting Amazon Web Services, Microsoft Azure, and Google Cloud to build sovereign environments in Germany, France, and the Netherlands. Compliance with GDPR, Germany's BSI C5, and France's SecNumCloud frameworks is inflating construction costs and extending timelines, but it also commands premium pricing from regulated tenants. Blackstone's USD 7 billion joint venture with Digital Realty to erect campuses in Frankfurt and Paris exemplifies the scale of capital redirected to meet these mandates. Operators adept at local permitting and grid negotiations are capturing higher-margin sovereign leases, lifting overall growth in the hyperscale data center market.
Water-Usage Restrictions for Evaporative Cooling in Arid Regions
Severe drought in California, Arizona, and Nevada has forced water authorities to impose volumetric caps on industrial consumption. Spain's Ebro River basin adopted similar limits after record-low flow rates in 2024, compelling data centers to transition to closed-loop liquid systems that cost more to install and run. Sites without long-term reclaimed-water contracts risk curtailment orders during summer peaks, threatening service-level agreements. New projects, therefore, prioritize recycled water, coastal desalination, or air-cooled chillers, raising the capital cost of entry and moderating growth in the hyperscale data center market.
Other drivers and restraints analyzed in the detailed report include:
- FinTech Real-Time Payment Mandates Accelerating Tier 4 Demand
- 5G Edge-Core Consolidation Creating Regional Hub Requirements
- GPU supply-chain bottlenecks limiting rack-level density expansion
For complete list of drivers and restraints, kindly check the Table Of Contents.
Segment Analysis
Electrical Infrastructure is on track to grow at a 24.65% CAGR from 2026 to 2031, eclipsing overall hyperscale data center market growth as operators overhaul power distribution to support 50-100 kilowatt racks. The hyperscale data center market size devoted to Electrical Infrastructure is projected to rise sharply as uninterruptible power supply systems, lithium-ion battery strings, and modular switchgear become mandatory for GPU clusters. Eaton's 9395XC UPS, rated at 2,250 kilowatts and scalable to 3 megawatts, typifies equipment that aligns with hyperscaler demand for high-density, low-maintenance backup power. IT Infrastructure, despite accounting for 48.43% of revenue in 2025, is experiencing longer server refresh cycles to amortize accelerator costs, which tempers its relative momentum. Mechanical Infrastructure is pivoting toward direct-to-chip cooling, increasing upfront capital but lowering long-term operating expense via reduced power-usage effectiveness. General Construction margins remain under pressure from steel-price volatility and skilled-labor shortages, while data center information management software gains share by unlocking stranded capacity.
Operators see a strategic imperative to pre-order electrical gear with 18-24-month lead times, locking in pricing before copper and semiconductor inputs inflate further. Vendors offering factory-integrated power skids and on-site commissioning teams command premium margins. Meanwhile, hyperscalers are crowd-sourcing open specifications for busways and battery chemistries to avoid vendor lock-in, which compresses margins for commodity components. Consequently, Electrical Infrastructure suppliers with strong service portfolios and rapid-deployment modules are positioned to gain hyperscale data center market share over the forecast period.
Complete Report Scope:
- By Component
- IT Infrastructure
- Server Infrastructure
- Storage Infrastructure
- Network Infrastructure
- Electrical Infrastructure
- Power Distribution Units
- Transfer Switches and Switchgears
- UPS Systems
- Generators
- Other Electrical Infrastructure
- Mechanical Infrastructure
- Cooling Systems
- Racks
- Other Mechanical Infrastructure
- General Construction
- Core and Shell Development
- Installation and Commisioning Services
- Design Engineering
- Fire Detection, Suppression and Physical Security
- DCIM/BMS Solutions
- IT Infrastructure
- By Tier Type
- Tier 3
- Tier 4
- By Geography
- North America
- United States
- Canada
- Mexico
- Europe
- United Kingdom
- Germany
- Netherlands
- France
- Ireland
- Rest of Europe
- Asia-Pacific
- China
- India
- Singapore
- Japan
- Australia
- Indonesia
- Rest of Asia-Pacific
- South America
- Brazil
- Chile
- Rest of South America
- Middle East and Africa
- Middle East
- United Arab Emirates
- Saudi Arabia
- Turkey
- Rest of Middle East
- Africa
- South Africa
- Nigeria
- Rest of Africa
- Middle East
- North America
Geography Analysis
North America retained 40.43% of the hyperscale data center market in 2025, underpinned by Northern Virginia's unprecedented fiber density and robust grid interconnects. Continued mega-campus launches by Amazon Web Services, Microsoft, and Google, coupled with Blackstone's USD 25 billion development pipeline, reinforce the region's global preeminence. Cooling-water restrictions in the Southwest and heat-related permitting delays in California, however, are shifting incremental builds toward the Pacific Northwest and Texas, where abundant hydropower and deregulated electricity markets lower levelized costs. Leasing dynamics show hyperscalers pre-committing to entire 100-megawatt phases, crowding out retail colocation demand and locking in power-purchase agreements for renewable energy.
Asia-Pacific is forecast to post a 24.57% CAGR through 2031, driven by China's AI infrastructure surge, India's digital-payments boom, and Singapore's sovereign-cloud requirements. Alibaba's pledge to invest RMB 380 billion (USD 53 billion) over three years underscores China's focus on domestic compute scale. Land scarcity and heat taxes are limiting fresh supply in Singapore, pushing overflow demand to Johor and Batam. India's data-localization rules and state-level incentives are facilitating Tier 4 greenfield and brownfield builds in Mumbai and Bengaluru. Meanwhile, Japan's on-site renewable quotas lengthen project timelines in Tokyo and Osaka, steering growth to power-rich Hokkaido and Kyushu. Overall, operators capable of securing multi-megawatt power blocks and navigating heterogeneous permitting regimes will capture the expanding hyperscale data center market.
Europe, the Middle East, and Africa display divergent trajectories. European sovereign-cloud policies fragment demand across Germany, France, the Netherlands, and Ireland, inflating investment requirements but enabling premium pricing. Blackstone and Digital Realty's USD 7 billion joint venture illustrates the concentration of capital into compliant campuses. In the Middle East, Saudi Arabia's NEOM Digital Valley and the UAE's Abu Dhabi clusters use tax holidays and rapid permitting to lure hyperscale tenants, positioning the region as an intercontinental traffic bridge. South America is led by Brazil, where abundant wind and solar resources align with carbon-neutral mandates, though currency volatility remains a hurdle. Africa's nascent demand centers on South Africa and Nigeria; expansion depends on grid upgrades and subsea cable landings. Collectively, these dynamics create a multi-polar hyperscale data center market with region-specific opportunities and risks.
- Digital Realty Trust, Inc.
- Equinix, Inc.
- Amazon Web Services, Inc.
- NTT Ltd.
- CyrusOne Inc.
- Quality Technology Services (QTS)
- Vantage Data Centers LLC
- Microsoft Corporation
- Alphabet Inc. (Google)
- Meta Platforms, Inc.
- Alibaba Group Holding Ltd.
- Tencent Holdings Ltd.
- Baidu, Inc.
- Oracle Corporation
- International Business Machines Corporation
- Switch, Inc.
- STACK Infrastructure
- Flexential Corp.
- Iron Mountain Data Centers
- OVHcloud
Additional Benefits:
- The market estimate (ME) sheet in Excel format
- 3 months of analyst support
TABLE OF CONTENTS
1 INTRODUCTION
- 1.1 Study Assumptions and Market Definition
- 1.2 Scope of the Study
2 RESEARCH METHODOLOGY
3 EXECUTIVE SUMMARY
4 MARKET LANDSCAPE
- 4.1 Market Overview
- 4.2 Market Drivers
- 4.2.1 Exploding GPU-Centric AI and ML Workloads Requiring >50 kW Racks in the United States and China
- 4.2.2 Hyperscale Cloud Providers' "Sovereign Cloud" Roll-outs in Europe
- 4.2.3 FinTech Real-Time Payment Mandates Accelerating Tier IV Demand in Singapore and India
- 4.2.4 5G Edge-Core Consolidation Creating Regional Hub Requirements in the Nordics and Oceania
- 4.2.5 Liquid-Cooled Modular Skids Enabling Brownfield Retrofits in India
- 4.2.6 Tax Incentives for Hyperscale Campuses in Saudi Arabia's NEOM Digital Valley
- 4.3 Market Restraints
- 4.3.1 Water-Usage Restrictions for Evaporative Cooling in the Western United States and Spain
- 4.3.2 GPU Supply-Chain Bottlenecks Limiting Rack-Level Density Expansion
- 4.3.3 Rising Heat-Tax and Carbon Levies in the Netherlands, Singapore and Germany
- 4.3.4 Mandatory On-site Renewable Quotas in Japan's New Green Energy Act
- 4.4 Industry Supply-Chain Analysis
- 4.5 Regulatory and Compliance Outlook
- 4.6 Technological Outlook, Liquid Cooling, Direct-to-Chip, Modular Builds
- 4.7 Impact of Macroeconomic Factors on the Market
- 4.8 Porter's Five Forces Analysis
- 4.8.1 Bargaining Power of Suppliers
- 4.8.2 Bargaining Power of Buyers
- 4.8.3 Threat of New Entrants
- 4.8.4 Threat of Substitutes
- 4.8.5 Competitive Rivalry
5 MARKET SIZE AND GROWTH FORECASTS (VALUE)
- 5.1 By Component
- 5.1.1 IT Infrastructure
- 5.1.1.1 Server Infrastructure
- 5.1.1.2 Storage Infrastructure
- 5.1.1.3 Network Infrastructure
- 5.1.2 Electrical Infrastructure
- 5.1.2.1 Power Distribution Units
- 5.1.2.2 Transfer Switches and Switchgears
- 5.1.2.3 UPS Systems
- 5.1.2.4 Generators
- 5.1.2.5 Other Electrical Infrastructure
- 5.1.3 Mechanical Infrastructure
- 5.1.3.1 Cooling Systems
- 5.1.3.2 Racks
- 5.1.3.3 Other Mechanical Infrastructure
- 5.1.4 General Construction
- 5.1.4.1 Core and Shell Development
- 5.1.4.2 Installation and Commisioning Services
- 5.1.4.3 Design Engineering
- 5.1.4.4 Fire Detection, Suppression and Physical Security
- 5.1.4.5 DCIM/BMS Solutions
- 5.1.1 IT Infrastructure
- 5.2 By Tier Type
- 5.2.1 Tier 3
- 5.2.2 Tier 4
- 5.3 By Geography
- 5.3.1 North America
- 5.3.1.1 United States
- 5.3.1.2 Canada
- 5.3.1.3 Mexico
- 5.3.2 Europe
- 5.3.2.1 United Kingdom
- 5.3.2.2 Germany
- 5.3.2.3 Netherlands
- 5.3.2.4 France
- 5.3.2.5 Ireland
- 5.3.2.6 Rest of Europe
- 5.3.3 Asia-Pacific
- 5.3.3.1 China
- 5.3.3.2 India
- 5.3.3.3 Singapore
- 5.3.3.4 Japan
- 5.3.3.5 Australia
- 5.3.3.6 Indonesia
- 5.3.3.7 Rest of Asia-Pacific
- 5.3.4 South America
- 5.3.4.1 Brazil
- 5.3.4.2 Chile
- 5.3.4.3 Rest of South America
- 5.3.5 Middle East and Africa
- 5.3.5.1 Middle East
- 5.3.5.1.1 United Arab Emirates
- 5.3.5.1.2 Saudi Arabia
- 5.3.5.1.3 Turkey
- 5.3.5.1.4 Rest of Middle East
- 5.3.5.2 Africa
- 5.3.5.2.1 South Africa
- 5.3.5.2.2 Nigeria
- 5.3.5.2.3 Rest of Africa
- 5.3.5.1 Middle East
- 5.3.1 North America
6 COMPETITIVE LANDSCAPE
- 6.1 Market Concentration
- 6.2 Strategic Moves
- 6.3 Market Share Analysis
- 6.4 Company Profiles (includes Global Level Overview, Market Level Overview, Core Segments, Financials as available, Strategic Information, Market Rank/Share, Products and Services, Recent Developments)
- 6.4.1 Digital Realty Trust, Inc.
- 6.4.2 Equinix, Inc.
- 6.4.3 Amazon Web Services, Inc.
- 6.4.4 NTT Ltd.
- 6.4.5 CyrusOne Inc.
- 6.4.6 Quality Technology Services (QTS)
- 6.4.7 Vantage Data Centers LLC
- 6.4.8 Microsoft Corporation
- 6.4.9 Alphabet Inc. (Google)
- 6.4.10 Meta Platforms, Inc.
- 6.4.11 Alibaba Group Holding Ltd.
- 6.4.12 Tencent Holdings Ltd.
- 6.4.13 Baidu, Inc.
- 6.4.14 Oracle Corporation
- 6.4.15 International Business Machines Corporation
- 6.4.16 Switch, Inc.
- 6.4.17 STACK Infrastructure
- 6.4.18 Flexential Corp.
- 6.4.19 Iron Mountain Data Centers
- 6.4.20 OVHcloud
7 MARKET OPPORTUNITIES AND FUTURE OUTLOOK
- 7.1 White-Space and Unmet-Need Assessment

 超大規模資料中心全球市場規模、佔有率、趨勢和成長分析報告(2026-2034)超大規模資料中心市場規模、佔有率、成長率、全球產業分析、區域趨勢以及 2026 年至 2034 年的預測。
 超級資料中心:市場佔有率分析、產業趨勢與統計、成長預測(2026-2031)
 超大規模資料中心市場機會、成長要素、產業趨勢分析及2026-2035年預測
 全球超大規模資料中心市場(至2040年):按組件類型、部署模式、資料中心類型、最終用戶、工作負載類型、冷卻技術、地區和主要參與者分類的趨勢和預測
 超大規模資料中心市場:按組件、電力容量、冷卻方式、所有權類型、部署模式、應用和最終用戶產業分類-2026-2032年全球市場預測馬來西亞超大規模資料中心:市場佔有率分析、產業趨勢與統計及成長預測(2025-2030 年)德國超大規模資料中心:市場佔有率分析、產業趨勢與統計及成長預測(2025-2031 年)
 全球超大規模資料中心市場:機會與策略展望(至2035年)
 超級資料中心市場規模、佔有率和趨勢分析報告:按解決方案、資料中心類型、冷卻技術、地區和細分市場預測(2026-2033 年)