


 |
市場調查報告書
商品編碼
2120341
超級資料中心:市場佔有率分析、產業趨勢與統計、成長預測(2026-2031)Mega Data Center - Market Share Analysis, Industry Trends & Statistics, Growth Forecasts (2026 - 2031) |
||||||

※ 本網頁內容可能與最新版本有所差異。詳細情況請與我們聯繫。
根據 Mordor Intelligence 預測,到 2026 年,超級資料中心市場規模將達到 265.4 億美元,到 2031 年將達到 336.5 億美元,預測期內複合年成長率為 4.86%。
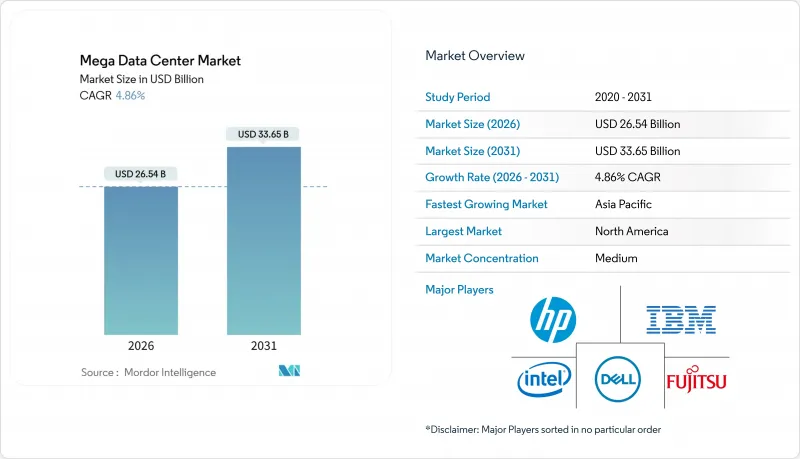
本報告按解決方案(儲存、網路、伺服器、安全性等)、資料中心類型(超大規模本地部署、超大規模託管)、冷卻技術(風冷、液冷)和地區(北美、南美、歐洲、亞太、中東和非洲)進行細分。市場預測以美元計價。
全球超級資料中心市場趨勢與洞察
人工智慧和機器學習領域對運算密度的需求呈現爆炸性成長
到2025年,大規模語言模型的訓練運作將使用超過每個叢集2萬個GPU,單一機架的負載將達到120千瓦。這迫使營運商轉向後門式熱交換器和直接冷卻板。這些液冷解決方案已從小眾市場迅速發展,在短短一年內就占到新安裝量的18%,使得單一站點的電力合約超過200兆瓦。隨著加速器更新週期縮短至24個月,資本週轉速度加快,營運商現在致力於最佳化三年總擁有成本(TCO)。因此,一種新的平衡已經形成:在園區範圍內,熱設計、電力基礎設施和升級頻率被整合在一起進行設計。
大型設施中銀行、金融服務和保險 (BFSI) 工作負載的增加
美國、歐盟和新加坡修訂了網路彈性法規,強制要求在每個交易節點上安裝硬體安全模組並實現亞秒級審計追蹤,這使得分散式架構不再適用於關鍵銀行工作負載的合規性要求。因此,領先的金融集團計劃在2025年將40%的核心銀行流程遷移到超級資料中心,以集中風險並加快事件回應速度。監管機構目前已表示將透過壓力測試檢驗底層資料中心的彈性指標,而這條遷移路徑已納入策略藍圖。
高昂的資本成本和安裝成本
典型的巨型園區預算超過10億美元,液冷系統、冗餘變電站和生物識別安全系統如今已成為必備設施。在歐洲,更嚴格的建築規範和ESG認證將導致基本成本從2024年起上漲15%,促使許多開發商選擇分階段開發園區並採用售後回租資金籌措。鋼鐵、半導體和勞動力成本的通膨壓力加劇了風險,並限制了那些擁有充足資本市場管道的開發商進入該領域。
細分市場分析
到2025年,儲存解決方案佔總營收的43.54%,在超級資料中心市場所有解決方案類型中佔據最大市場佔有率。與傳統SAN系統相比,物件儲存和NVMe over Fabric架構的IOPS提升了70%,實現了對Petabyte級AI儲存庫的亞毫秒存取。這種效能提升對於即時推理至關重要,使儲存成為超級資料中心市場的基石。以零信任框架為驅動的安全解決方案,將硬體級身份驗證整合到所有伺服器中,預計到2031年將實現5.67%的最高複合年成長率。供應商目前正在將入侵偵測和生物識別存取整合到統一平台中,這反映出他們正在從純軟體模式轉向其他模式。來自超大規模資料中心業者中心和儲存行業領導企業的聯合參考架構表明,採購趨勢強調預先檢驗的捆綁包,以縮短引進週期並降低工程風險。
NVMe over Fabric 的效能優勢可直接轉換為更高的營運利潤,因為更高的每瓦吞吐量可降低每次交易的冷卻成本。在安全性方面,NIST SP 800-207 和 ISO 27001 認證等監管要求支援高價策略,從而保護伺服器和網路領域的利潤免受商品化衝擊。板級整合的硬體安全模組 (HSM) 因其消除延遲開銷而對銀行、金融和保險 (BFSI) 以及國防客戶極具吸引力。總而言之,能夠滿足整合儲存和安全需求的解決方案供應商最有可能在超級資料中心市場中獲取增量收入。
區域分析
到2025年,北美將佔全球收入的39.74%,在超大規模資料中心業者資料中心營運商持續的資本投資和成熟的供應生態系統的支持下,佔據超級資料中心市場的最大佔有率。北維吉尼亞仍然是全球計算密度最高的叢集,而德克薩斯州、奧勒岡州和亞利桑那州的新興建設區域正在分散風險並利用可再生能源組合。加拿大和墨西哥受益於溢出需求和政府獎勵,而美國監管機構則維持著有利的授權環境。障礙包括電網擁塞和社區對用水的抵制,促使營運商實施閉合迴路冷卻和現場發電。
預計到2031年,亞太地區將以6.02%的複合年成長率成長,並有望成為超級資料中心市場成長最快的地區。中國的國家雲端運算計畫和印度的數位公共基礎設施計畫為大規模部署奠定了基礎,使人工智慧工作負載能夠根據資料主權法律進行在地化。日本和韓國正在投資建造以人工智慧為重點的園區,而澳洲則致力於成為該地區的災害復原中心。由於新加坡和孟買的土地和電力資源有限,開發商正將目光投向二線城市和模組化園區,這些園區的設計旨在實現分階段的擴展。
歐洲的成長軌跡正受到電力成本的限制,預計到2025年,平均電價將達到每度電0.15歐元(0.17美元)。新增資料中心容量集中在斯堪地那維亞和愛爾蘭,這些地區可再生能源的高普及率正在降低邊際成本,而較為涼爽的氣候也延長了自然風冷系統的使用壽命。德國、法國和英國持續吸引穩定的投資,但當地的反對意見正在延緩授權流程。歐盟的法規環境是世界上最嚴格的之一,強制要求廢熱再利用和零用水設計,從而影響全球最佳實踐。
其他好處:
- Excel格式的市場預測(ME)表
- 3個月的分析師支持
目錄
第1章:引言
- 本研究的前提條件與定義
- 調查範圍
第2章:調查方法
第3章執行摘要
第4章 市場狀況
- 市場概覽
- 市場促進因素
- 資料中心整合的需求日益成長
- 大型設施中銀行、金融服務和保險(BFSI)行業的作業量增加
- 人工智慧和機器學習領域運算密度需求的爆炸性成長
- 加速擴充雲端服務容量
- 節能型水冷系統的應用蓬勃發展
- 現場微電網發電,避免電網瓶頸
- 市場限制因素
- 高昂的資本成本和實施成本
- 電力成本上漲和供不應求
- 當地社區反對水和土地利用
- 高壓變壓器和開關設備的前置作業時間為 30 個月。
- 產業供應鏈分析
- 監理情勢
- 技術展望
- 波特五力分析
- 宏觀經濟因素對市場的影響
第5章 市場規模與成長預測
- 透過解決方案
- 貯存
- 網路
- 伺服器
- 安全
- 其他解決方案
- 依資料中心類型
- 超大規模自建
- 超大規模機房託管
- 按類型分類的冷卻技術
- 空氣冷卻
- 液冷
- 按地區
- 北美洲
- 美國
- 加拿大
- 墨西哥
- 南美洲
- 巴西
- 阿根廷
- 其他南美國家
- 歐洲
- 德國
- 法國
- 英國
- 義大利
- 西班牙
- 其他歐洲國家
- 亞太地區
- 中國
- 日本
- 印度
- 韓國
- 澳洲
- 其他亞太國家
- 中東和非洲
- 中東
- 沙烏地阿拉伯
- 阿拉伯聯合大公國
- 土耳其
- 其他中東國家
- 非洲
- 南非
- 埃及
- 奈及利亞
- 其他非洲國家
- 中東
- 北美洲
第6章 競爭情勢
- 市場集中度
- 策略趨勢
- 市佔率分析
- 公司簡介
- Amazon Web Services Inc.
- Microsoft Corporation
- Google LLC
- Meta Platforms Inc.
- Alibaba Cloud
- Cisco Systems Inc.
- Dell Technologies Inc.
- Fujitsu Ltd.
- Hewlett-Packard Enterprise Company
- IBM Corporation
- Intel Corporation
- Juniper Networks Inc.
- Schneider Electric SE
- Vertiv Group Corporation
- Digital Realty Trust Inc.
- Equinix Inc.
- NTT Ltd.
- Vantage Data Centers LLC
- CyrusOne LLC
- CoreWeave Inc.
第7章 市場機會與未來展望
According to Mordor Intelligence, the mega data center market size reached USD 26.54 billion in 2026 and is projected to reach USD 33.65 billion by 2031, reflecting a 4.86% CAGR during the forecast period.
This report is Segmented by Solution (Storage, Networking, Server, Security, and More), Data Center Type (Hyperscale Self-Build, and Hyperscale Colocation), Cooling Technology (Air-Based Cooling, and Liquid-Based Cooling), and Geography (North America, South America, Europe, Asia-Pacific, and Middle East and Africa). The Market Forecasts are Provided in Terms of Value (USD).
Global Mega Data Center Market Trends and Insights
Explosive AI and ML Compute Density Requirements
Large-language-model training runs exceeded 20,000 GPUs per cluster in 2025, pushing individual rack loads to 120 kilowatts and driving operators toward rear-door heat exchangers and direct-to-chip cold plates. These liquid solutions went from niche status to 18% of new installs within a year, enabling single-site power contracts of over 200 megawatts. Shorter 24-month accelerator refresh cycles intensify capital turnover, so operators now optimize designs for three-year total cost of ownership. The result is a new equilibrium in which thermal design, electrical infrastructure, and upgrade cadence are co-engineered at the campus scale.
Rising BFSI Workload Placement in Mega Facilities
Updated cyber-resilience rules in the United States, European Union, and Singapore mandated hardware security modules at each transaction node and sub-second audit trails, making distributed architectures non-compliant for critical banking workloads. Consequently, leading financial groups moved 40% more core-banking processes into mega facilities in 2025, pursuing risk centralization and faster incident response. Regulators now hint that stress tests will examine underlying data-center resilience metrics, locking this migration pathway into strategic roadmaps.
High Capital and Installation Costs
Typical mega campus budgets exceed USD 1 billion, with liquid cooling, redundant substations, and biometric security now mandatory line items. In Europe, tighter building codes and ESG certifications have added 15% to baseline costs since 2024, pushing many developers toward multi-phase campuses or sale-leaseback financing. Inflationary pressure on steel, semiconductors, and labor compounds risk, limiting participation to entities with deep capital market access.
Other drivers and restraints analyzed in the detailed report include:
- Accelerated Cloud-Service Capacity Buildouts
- Energy-Efficient Liquid-Cooling Adoption Wave
- Escalating Utility Power Costs and Scarcity
For complete list of drivers and restraints, kindly check the Table Of Contents.
Segment Analysis
Storage solutions accounted for 43.54% of 2025 revenue, yielding the single-largest market share for any solution type in the mega data center market. Object storage and NVMe-over-fabric architectures delivered 70% more IOPS than legacy SAN systems, enabling sub-millisecond access to petabyte-scale AI repositories. This performance uplift is critical for real-time inference, making storage a foundational pillar of the mega data center market. Security solutions are on track for the fastest 5.67% CAGR to 2031, propelled by zero-trust frameworks that bake hardware-rooted attestation into every server. Vendors now integrate intrusion detection and biometric access into unified platforms, reflecting a pivot from software-only models. Collaborative reference architectures between hyperscalers and storage leaders signal a procurement landscape that values pre-validated bundles, shortening deployment cycles and reducing engineering risk.
The performance edge of NVMe-over-fabric translates directly into operating income because higher throughput per watt reduces the cooling headroom required per transaction. On the security front, regulatory mandates such as NIST SP 800-207 and ISO 27001 certifications support premium pricing, cushioning margins against commoditization in server and networking segments. Hardware security modules embedded at board level eliminate latency overheads, appealing to BFSI and defense clients. Overall, solution providers that align with integrated storage-and-security demand are best positioned to capture incremental mega data center market revenue.
Complete Report Scope:
- By Solution
- Storage
- Networking
- Server
- Security
- Other Solutions
- By Data Center Type
- Hyperscale Self-Build
- Hyperscale Colocation
- By Cooling Technology
- Air-Based Cooling
- Liquid-Based Cooling
- By Geography
- North America
- United States
- Canada
- Mexico
- South America
- Brazil
- Argentina
- Rest of South America
- Europe
- Germany
- France
- United Kingdom
- Italy
- Spain
- Rest of Europe
- Asia-Pacific
- China
- Japan
- India
- South Korea
- Australia
- Rest of Asia-Pacific
- Middle East and Africa
- Middle East
- Saudi Arabia
- United Arab Emirates
- Turkey
- Rest of Middle East
- Africa
- South Africa
- Egypt
- Nigeria
- Rest of Africa
- Middle East
- North America
Geography Analysis
North America accounted for 39.74% of 2025 revenue, securing the largest share of the mega data center market amid sustained hyperscaler capital outlays and a mature supply ecosystem. Northern Virginia remains the world's densest cluster of compute, but emerging build zones in Texas, Oregon, and Arizona diversify risk and tap renewable portfolios. Canada and Mexico are benefiting from spillover demand and government incentives, while U.S. regulatory bodies maintain a favorable permitting environment. Grid congestion and community pushback over water use add friction, prompting operators to adopt closed-loop cooling and on-site generation.
Asia-Pacific is forecast to expand at a 6.02% CAGR through 2031, making it the fastest contributor to the incremental mega data center market. China's national cloud program and India's digital-public-infrastructure initiative anchor large deployments that localize AI workloads in line with data-sovereignty laws. Japan and South Korea invest in AI-focused campuses, while Australia positions itself as a disaster recovery hub for the region. Limited land and power in Singapore and Mumbai push developers toward tier-two cities and modular campuses designed for phased expansion.
Europe's trajectory is moderated by electricity costs that averaged EUR 0.15 per kilowatt-hour (USD 0.17 per kilowatt-hour) in 2025. New capacity gravitates to Scandinavia and Ireland, where renewable penetration lowers marginal costs and cooler climates extend free-air-cooling windows. Germany, France, and the United Kingdom continue to attract steady investment, though local opposition extends permitting timelines. The European Union's regulatory environment is the strictest globally, mandating waste-heat reuse and water-neutral designs, thereby influencing global best practices.
- Amazon Web Services Inc.
- Microsoft Corporation
- Google LLC
- Meta Platforms Inc.
- Alibaba Cloud
- Cisco Systems Inc.
- Dell Technologies Inc.
- Fujitsu Ltd.
- Hewlett-Packard Enterprise Company
- IBM Corporation
- Intel Corporation
- Juniper Networks Inc.
- Schneider Electric SE
- Vertiv Group Corporation
- Digital Realty Trust Inc.
- Equinix Inc.
- NTT Ltd.
- Vantage Data Centers LLC
- CyrusOne LLC
- CoreWeave Inc.
Additional Benefits:
- The market estimate (ME) sheet in Excel format
- 3 months of analyst support
TABLE OF CONTENTS
1 INTRODUCTION
- 1.1 Study Assumptions and Definitions
- 1.2 Scope of the Study
2 RESEARCH METHODOLOGY
3 EXECUTIVE SUMMARY
4 MARKET LANDSCAPE
- 4.1 Market Overview
- 4.2 Market Drivers
- 4.2.1 Increasing Demand for Data Center Consolidation
- 4.2.2 Rising BFSI Workload Placement in Mega Facilities
- 4.2.3 Explosive AI and ML Compute Density Requirements
- 4.2.4 Accelerated Cloud-Service Capacity Buildouts
- 4.2.5 Energy-Efficient Liquid-Cooling Adoption Wave
- 4.2.6 On-Site Microgrid Generation to Bypass Grid Bottlenecks
- 4.3 Market Restraints
- 4.3.1 High Capital and Installation Costs
- 4.3.2 Escalating Utility Power Costs and Scarcity
- 4.3.3 Community Backlash Over Water and Land Footprint
- 4.3.4 30-Month Lead Times for HV Transformers and Switchgear
- 4.4 Industry Supply-Chain Analysis
- 4.5 Regulatory Landscape
- 4.6 Technological Outlook
- 4.7 Porter's Five Forces Analysis
- 4.7.1 Threat of New Entrants
- 4.7.2 Bargaining Power of Suppliers
- 4.7.3 Bargaining Power of Buyers
- 4.7.4 Threat of Substitutes
- 4.7.5 Intensity of Competitive Rivalry
- 4.8 Impact of Macroeconomic Factors on the Market
5 MARKET SIZE AND GROWTH FORECASTS (VALUE)
- 5.1 By Solution
- 5.1.1 Storage
- 5.1.2 Networking
- 5.1.3 Server
- 5.1.4 Security
- 5.1.5 Other Solutions
- 5.2 By Data Center Type
- 5.2.1 Hyperscale Self-Build
- 5.2.2 Hyperscale Colocation
- 5.3 By Cooling Technology
- 5.3.1 Air-Based Cooling
- 5.3.2 Liquid-Based Cooling
- 5.4 By Geography
- 5.4.1 North America
- 5.4.1.1 United States
- 5.4.1.2 Canada
- 5.4.1.3 Mexico
- 5.4.2 South America
- 5.4.2.1 Brazil
- 5.4.2.2 Argentina
- 5.4.2.3 Rest of South America
- 5.4.3 Europe
- 5.4.3.1 Germany
- 5.4.3.2 France
- 5.4.3.3 United Kingdom
- 5.4.3.4 Italy
- 5.4.3.5 Spain
- 5.4.3.6 Rest of Europe
- 5.4.4 Asia-Pacific
- 5.4.4.1 China
- 5.4.4.2 Japan
- 5.4.4.3 India
- 5.4.4.4 South Korea
- 5.4.4.5 Australia
- 5.4.4.6 Rest of Asia-Pacific
- 5.4.5 Middle East and Africa
- 5.4.5.1 Middle East
- 5.4.5.1.1 Saudi Arabia
- 5.4.5.1.2 United Arab Emirates
- 5.4.5.1.3 Turkey
- 5.4.5.1.4 Rest of Middle East
- 5.4.5.2 Africa
- 5.4.5.2.1 South Africa
- 5.4.5.2.2 Egypt
- 5.4.5.2.3 Nigeria
- 5.4.5.2.4 Rest of Africa
- 5.4.5.1 Middle East
- 5.4.1 North America
6 COMPETITIVE LANDSCAPE
- 6.1 Market Concentration
- 6.2 Strategic Moves
- 6.3 Market Share Analysis
- 6.4 Company Profiles (includes Global Level Overview, Market Level Overview, Core Segments, Financials, Strategic Information, Market Rank/Share, Products and Services, Recent Developments)
- 6.4.1 Amazon Web Services Inc.
- 6.4.2 Microsoft Corporation
- 6.4.3 Google LLC
- 6.4.4 Meta Platforms Inc.
- 6.4.5 Alibaba Cloud
- 6.4.6 Cisco Systems Inc.
- 6.4.7 Dell Technologies Inc.
- 6.4.8 Fujitsu Ltd.
- 6.4.9 Hewlett-Packard Enterprise Company
- 6.4.10 IBM Corporation
- 6.4.11 Intel Corporation
- 6.4.12 Juniper Networks Inc.
- 6.4.13 Schneider Electric SE
- 6.4.14 Vertiv Group Corporation
- 6.4.15 Digital Realty Trust Inc.
- 6.4.16 Equinix Inc.
- 6.4.17 NTT Ltd.
- 6.4.18 Vantage Data Centers LLC
- 6.4.19 CyrusOne LLC
- 6.4.20 CoreWeave Inc.
7 MARKET OPPORTUNITIES AND FUTURE OUTLOOK
- 7.1 White-Space and Unmet-Need Assessment

 超大規模資料中心全球市場規模、佔有率、趨勢和成長分析報告(2026-2034)超大規模資料中心市場規模、佔有率、成長率、全球產業分析、區域趨勢以及 2026 年至 2034 年的預測。
 超大規模資料中心:市場佔有率分析、產業趨勢與統計、成長預測(2026-2031)
 超大規模資料中心市場機會、成長要素、產業趨勢分析及2026-2035年預測
 全球超大規模資料中心市場(至2040年):按組件類型、部署模式、資料中心類型、最終用戶、工作負載類型、冷卻技術、地區和主要參與者分類的趨勢和預測
 超大規模資料中心市場:按組件、電力容量、冷卻方式、所有權類型、部署模式、應用和最終用戶產業分類-2026-2032年全球市場預測馬來西亞超大規模資料中心:市場佔有率分析、產業趨勢與統計及成長預測(2025-2030 年)德國超大規模資料中心:市場佔有率分析、產業趨勢與統計及成長預測(2025-2031 年)
 全球超大規模資料中心市場:機會與策略展望(至2035年)
 超級資料中心市場規模、佔有率和趨勢分析報告:按解決方案、資料中心類型、冷卻技術、地區和細分市場預測(2026-2033 年)